

Key Insights
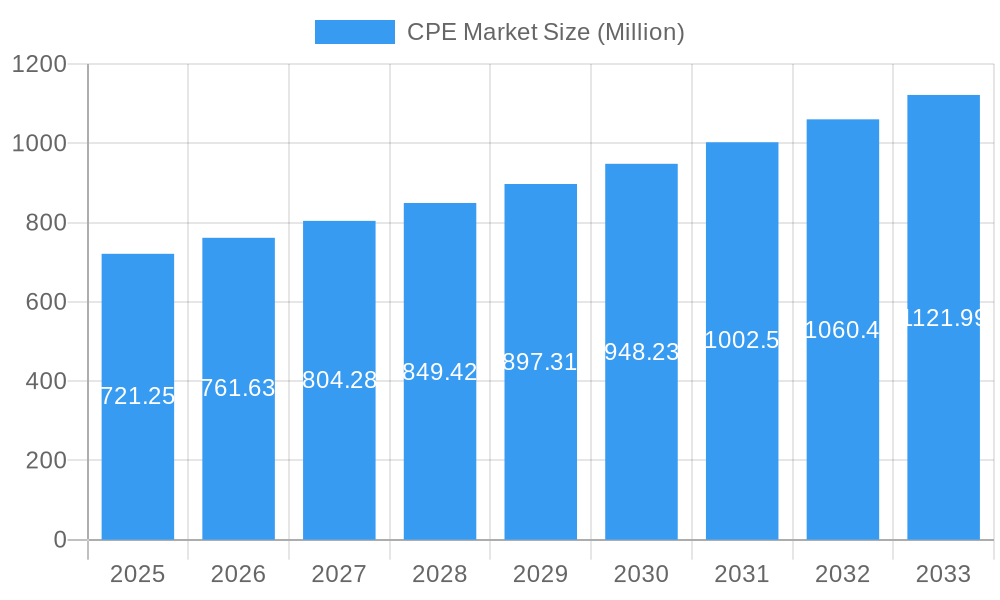
The Chlorinated Polyethylene (CPE) market, valued at $721.25 million in 2025, is projected to experience robust growth, driven by increasing demand from diverse sectors. The 5.45% CAGR from 2025 to 2033 indicates a significant expansion, fueled primarily by its exceptional properties like flexibility, durability, and resistance to chemicals and UV radiation. Key application areas include wire and cable coatings, automotive parts, and construction materials, further bolstering market growth. The rising adoption of CPE in sustainable infrastructure projects, coupled with its use in advanced manufacturing processes like 3D printing, presents lucrative opportunities. However, fluctuations in raw material prices and stringent environmental regulations pose potential challenges. Competitive landscape analysis reveals a mix of established global players and regional manufacturers, leading to innovation and price competition. The market is segmented based on type (chlorination degree, molecular weight), application (wire & cable, automotive, construction, etc.), and region (North America, Europe, Asia-Pacific, etc.), with Asia-Pacific anticipated to hold a significant share due to robust industrial growth in the region. Growth will be further enhanced by ongoing research and development efforts focused on improving CPE's performance characteristics and expanding its applications in emerging technologies.
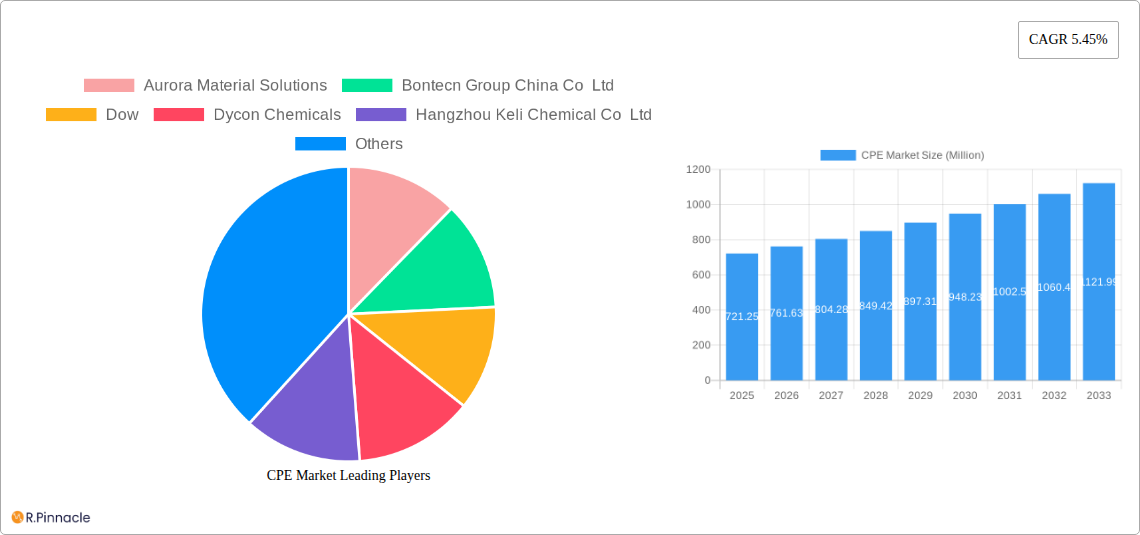
CPE Market Market Size (In Million)
The CPE market's future trajectory depends on successfully navigating the challenges of raw material cost volatility and evolving environmental regulations. Strategic partnerships and technological advancements will be crucial for manufacturers to gain a competitive edge. Market players are focusing on developing high-performance CPE grades tailored to specific applications, driving innovation and creating value-added solutions for their customers. Furthermore, the increasing focus on sustainability will likely lead to the development of eco-friendly CPE production processes and the exploration of alternative materials. This continuous evolution ensures the CPE market remains dynamic and holds significant potential for future growth, especially as consumer demand for durable and versatile materials increases across various sectors.
CPE Market Company Market Share
CPE Market Report: A Comprehensive Analysis (2019-2033)
This in-depth report provides a comprehensive analysis of the CPE market, offering actionable insights for industry professionals. With a study period spanning 2019-2033, a base year of 2025, and a forecast period of 2025-2033, this report is your essential guide to navigating the evolving landscape of chlorinated polyethylene. The report leverages extensive market research and data analysis, offering a clear understanding of market dynamics, key players, and future growth opportunities. The total market size is projected to reach xx Million by 2033, representing a CAGR of xx%.
CPE Market Market Structure & Innovation Trends
This section analyzes the competitive landscape of the CPE market, encompassing market concentration, innovation drivers, regulatory frameworks, product substitutes, end-user demographics, and M&A activities. The market is characterized by a mix of large multinational corporations and smaller, specialized players. Market concentration is moderate, with the top five players holding an estimated xx% market share in 2025.
- Market Concentration: Moderate, top 5 players holding approximately xx% market share (2025).
- Innovation Drivers: Growing demand for high-performance materials in various end-use sectors, including automotive, construction, and wire & cable. Advancements in CPE formulations focusing on improved flexibility, durability, and chemical resistance.
- Regulatory Frameworks: Environmental regulations are driving the development of more sustainable CPE production processes. Safety standards for specific applications are also influencing product development.
- Product Substitutes: Competition from alternative materials like PVC and other polymers. The competitive landscape is shaped by cost-effectiveness, performance characteristics, and regulatory compliance.
- End-User Demographics: The major end-use sectors driving CPE demand are automotive (xx Million), construction (xx Million), and wire & cable (xx Million) in 2025.
- M&A Activities: Recent mergers and acquisitions (M&A) activity reflects the consolidation trend in the market. For instance, the May 2024 acquisition of EnCom Polymers Inc. by Aurora Plastics LLC significantly expanded Aurora's product portfolio and market reach. The total value of M&A deals in the CPE market in 2024 is estimated at xx Million.
CPE Market Market Dynamics & Trends
This section delves into the key market dynamics and trends driving CPE market growth. The market is experiencing growth fueled by increasing demand from various sectors, technological advancements, evolving consumer preferences, and intense competitive dynamics. The global CPE market is projected to witness robust growth, driven by the increasing demand for flexible and durable materials across diverse applications.
The CAGR during the forecast period (2025-2033) is estimated to be xx%. Market penetration is expected to increase in developing economies due to rising infrastructure development and industrialization. Technological innovations, such as the development of specialty CPE grades with enhanced properties, are further contributing to market expansion. However, price volatility of raw materials and stringent environmental regulations pose challenges to market growth. Competitive pressures necessitate continuous product innovation and cost optimization to maintain market share.
Dominant Regions & Segments in CPE Market
This section identifies the leading regions and segments within the CPE market. Asia Pacific is currently the dominant region, fueled by strong demand from China and other rapidly developing economies. The construction, automotive, and wire & cable sectors are significant drivers within this region.
- Key Drivers in Asia Pacific:
- Rapid industrialization and infrastructure development.
- Growing automotive and construction sectors.
- Favorable government policies supporting manufacturing.
- Dominance Analysis: The Asia Pacific region's dominance stems from its large and rapidly growing economies, robust industrial base, and increasing infrastructure investment. China, in particular, plays a crucial role due to its vast manufacturing capabilities and high consumption rates.
CPE Market Product Innovations
Recent product developments in the CPE market focus on enhancing material properties to meet the demands of various applications. This includes the creation of CPE compounds with improved flexibility, durability, and resistance to chemicals and UV degradation. New applications are being explored in sectors such as automotive interiors, flexible packaging, and specialized coatings, leveraging CPE's unique properties.
Report Scope & Segmentation Analysis
This report segments the CPE market based on several factors, including type, application, and region. Further segmentation analyses provide detailed insights into specific market segments. Growth projections for each segment are detailed within the report.
Key Drivers of CPE Market Growth
The CPE market's growth is propelled by several key factors: increasing demand from various end-use industries (automotive, construction, wire & cable), technological advancements leading to improved material properties, and government support for infrastructure projects. The rising adoption of CPE in emerging economies also contributes significantly to market expansion.
Challenges in the CPE Market Sector
The CPE market faces challenges such as fluctuating raw material prices, stringent environmental regulations, and intense competition from alternative materials. These factors can impact production costs and market profitability. Supply chain disruptions can also pose a significant risk, affecting production and delivery timelines.
Emerging Opportunities in CPE Market
Emerging opportunities lie in the development of sustainable and eco-friendly CPE formulations, catering to the growing demand for environmentally conscious materials. Expanding into new applications, such as renewable energy and medical devices, represents further potential for market growth. Focus on customized solutions for niche industries also presents significant opportunities.
Leading Players in the CPE Market Market
- Aurora Material Solutions
- Bontecn Group China Co Ltd
- Dow
- Dycon Chemicals
- Hangzhou Keli Chemical Co Ltd
- Jiangsu Tianteng Chemical Industry Co Ltd
- Resonac Holdings Corporation
- Shandong Gaoxin Chemical Co Ltd
- Shandong Ketian Chemical Co Ltd
- Shandong Novista Chemical Ltd (Novista Group)
- Shandong Xiangsheng New Materials Technology Co Ltd
- Shandong Xuye New Materials Co Ltd
- Sundow Polymers Co Ltd
- Weifang Yaxing Chemical Co Ltd
- *List Not Exhaustive
Key Developments in CPE Market Industry
- May 2024: Aurora Plastics LLC (Aurora) announced the acquisition of EnCom Polymers Inc., expanding its product offering to include chlorinated polyethylene alloys (CPE) and strengthening its product portfolio.
Future Outlook for CPE Market Market
The future of the CPE market looks promising, driven by continuous innovation, expanding applications, and growth in emerging economies. Strategic partnerships and collaborations among key players will play a vital role in shaping market dynamics. The focus on sustainability and eco-friendly solutions will further drive market growth.
CPE Market Segmentation
-
1. Product
- 1.1. CPE 135A
- 1.2. CPA 135B
- 1.3. Other Products
-
2. Application
- 2.1. Impact Modifier
- 2.2. Wire and Cable Jacketing
- 2.3. Hose and Tubing
- 2.4. Adhesives
- 2.5. Other Applications
CPE Market Segmentation By Geography
-
1. Asia Pacific
- 1.1. China
- 1.2. India
- 1.3. Japan
- 1.4. South Korea
- 1.5. Rest of Asia Pacific
-
2. North America
- 2.1. United States
- 2.2. Canada
- 2.3. Mexico
-
3. Europe
- 3.1. Germany
- 3.2. United Kingdom
- 3.3. France
- 3.4. Italy
- 3.5. Rest of Europe
-
4. South America
- 4.1. Brazil
- 4.2. Argentina
- 4.3. Rest of South America
-
5. Middle East and Africa
- 5.1. Saudi Arabia
- 5.2. South Africa
- 5.3. Rest of Middle East and Africa
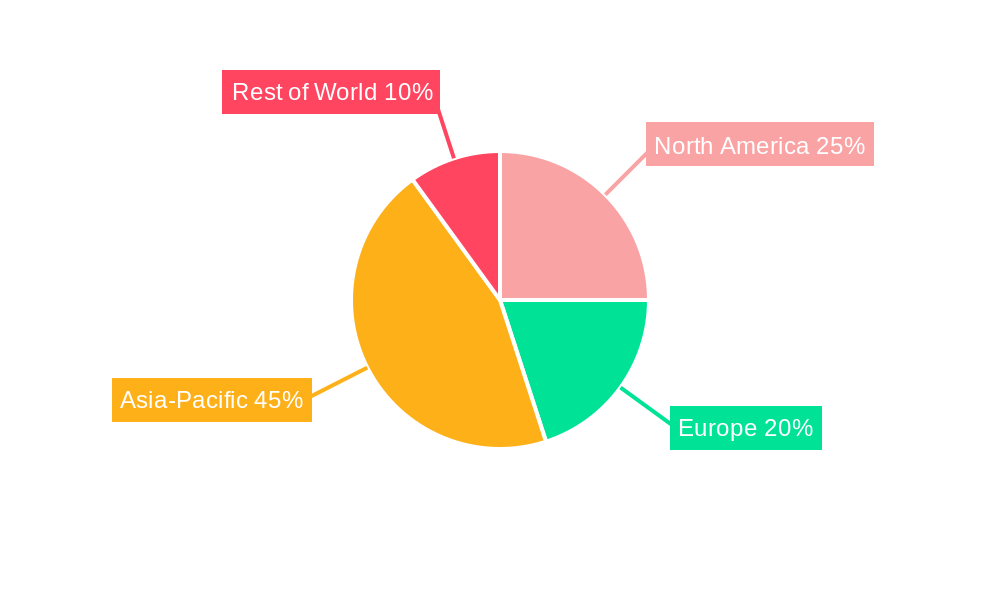
CPE Market Regional Market Share
Geographic Coverage of CPE Market
CPE Market REPORT HIGHLIGHTS
| Aspects | Details |
|---|---|
| Study Period | 2020-2034 |
| Base Year | 2025 |
| Estimated Year | 2026 |
| Forecast Period | 2026-2034 |
| Historical Period | 2020-2025 |
| Growth Rate | CAGR of 5.45% from 2020-2034 |
| Segmentation |
|
Table of Contents
- 1. Introduction
- 1.1. Research Scope
- 1.2. Market Segmentation
- 1.3. Research Objective
- 1.4. Definitions and Assumptions
- 2. Executive Summary
- 2.1. Market Snapshot
- 3. Market Dynamics
- 3.1. Market Drivers
- 3.2. Market Restrains
- 3.3. Market Trends
- 3.4. Market Opportunities
- 4. Market Factor Analysis
- 4.1. Porters Five Forces
- 4.1.1. Bargaining Power of Suppliers
- 4.1.2. Bargaining Power of Buyers
- 4.1.3. Threat of New Entrants
- 4.1.4. Threat of Substitutes
- 4.1.5. Competitive Rivalry
- 4.2. PESTEL analysis
- 4.3. BCG Analysis
- 4.3.1. Stars (High Growth, High Market Share)
- 4.3.2. Cash Cows (Low Growth, High Market Share)
- 4.3.3. Question Mark (High Growth, Low Market Share)
- 4.3.4. Dogs (Low Growth, Low Market Share)
- 4.4. Ansoff Matrix Analysis
- 4.5. Supply Chain Analysis
- 4.6. Regulatory Landscape
- 4.7. Current Market Potential and Opportunity Assessment (TAM–SAM–SOM Framework)
- 4.8. PRI Analyst Note
- 4.1. Porters Five Forces
- 5. Market Analysis, Insights and Forecast 2021-2033
- 5.1. Market Analysis, Insights and Forecast - by Product
- 5.1.1. CPE 135A
- 5.1.2. CPA 135B
- 5.1.3. Other Products
- 5.2. Market Analysis, Insights and Forecast - by Application
- 5.2.1. Impact Modifier
- 5.2.2. Wire and Cable Jacketing
- 5.2.3. Hose and Tubing
- 5.2.4. Adhesives
- 5.2.5. Other Applications
- 5.3. Market Analysis, Insights and Forecast - by Region
- 5.3.1. Asia Pacific
- 5.3.2. North America
- 5.3.3. Europe
- 5.3.4. South America
- 5.3.5. Middle East and Africa
- 5.1. Market Analysis, Insights and Forecast - by Product
- 6. Global CPE Market Analysis, Insights and Forecast, 2021-2033
- 6.1. Market Analysis, Insights and Forecast - by Product
- 6.1.1. CPE 135A
- 6.1.2. CPA 135B
- 6.1.3. Other Products
- 6.2. Market Analysis, Insights and Forecast - by Application
- 6.2.1. Impact Modifier
- 6.2.2. Wire and Cable Jacketing
- 6.2.3. Hose and Tubing
- 6.2.4. Adhesives
- 6.2.5. Other Applications
- 6.1. Market Analysis, Insights and Forecast - by Product
- 7. Asia Pacific CPE Market Analysis, Insights and Forecast, 2020-2032
- 7.1. Market Analysis, Insights and Forecast - by Product
- 7.1.1. CPE 135A
- 7.1.2. CPA 135B
- 7.1.3. Other Products
- 7.2. Market Analysis, Insights and Forecast - by Application
- 7.2.1. Impact Modifier
- 7.2.2. Wire and Cable Jacketing
- 7.2.3. Hose and Tubing
- 7.2.4. Adhesives
- 7.2.5. Other Applications
- 7.1. Market Analysis, Insights and Forecast - by Product
- 8. North America CPE Market Analysis, Insights and Forecast, 2020-2032
- 8.1. Market Analysis, Insights and Forecast - by Product
- 8.1.1. CPE 135A
- 8.1.2. CPA 135B
- 8.1.3. Other Products
- 8.2. Market Analysis, Insights and Forecast - by Application
- 8.2.1. Impact Modifier
- 8.2.2. Wire and Cable Jacketing
- 8.2.3. Hose and Tubing
- 8.2.4. Adhesives
- 8.2.5. Other Applications
- 8.1. Market Analysis, Insights and Forecast - by Product
- 9. Europe CPE Market Analysis, Insights and Forecast, 2020-2032
- 9.1. Market Analysis, Insights and Forecast - by Product
- 9.1.1. CPE 135A
- 9.1.2. CPA 135B
- 9.1.3. Other Products
- 9.2. Market Analysis, Insights and Forecast - by Application
- 9.2.1. Impact Modifier
- 9.2.2. Wire and Cable Jacketing
- 9.2.3. Hose and Tubing
- 9.2.4. Adhesives
- 9.2.5. Other Applications
- 9.1. Market Analysis, Insights and Forecast - by Product
- 10. South America CPE Market Analysis, Insights and Forecast, 2020-2032
- 10.1. Market Analysis, Insights and Forecast - by Product
- 10.1.1. CPE 135A
- 10.1.2. CPA 135B
- 10.1.3. Other Products
- 10.2. Market Analysis, Insights and Forecast - by Application
- 10.2.1. Impact Modifier
- 10.2.2. Wire and Cable Jacketing
- 10.2.3. Hose and Tubing
- 10.2.4. Adhesives
- 10.2.5. Other Applications
- 10.1. Market Analysis, Insights and Forecast - by Product
- 11. Middle East and Africa CPE Market Analysis, Insights and Forecast, 2020-2032
- 11.1. Market Analysis, Insights and Forecast - by Product
- 11.1.1. CPE 135A
- 11.1.2. CPA 135B
- 11.1.3. Other Products
- 11.2. Market Analysis, Insights and Forecast - by Application
- 11.2.1. Impact Modifier
- 11.2.2. Wire and Cable Jacketing
- 11.2.3. Hose and Tubing
- 11.2.4. Adhesives
- 11.2.5. Other Applications
- 11.1. Market Analysis, Insights and Forecast - by Product
- 12. Competitive Analysis
- 12.1. Company Profiles
- 12.1.1 Aurora Material Solutions
- 12.1.1.1. Company Overview
- 12.1.1.2. Products
- 12.1.1.3. Company Financials
- 12.1.1.4. SWOT Analysis
- 12.1.2 Bontecn Group China Co Ltd
- 12.1.2.1. Company Overview
- 12.1.2.2. Products
- 12.1.2.3. Company Financials
- 12.1.2.4. SWOT Analysis
- 12.1.3 Dow
- 12.1.3.1. Company Overview
- 12.1.3.2. Products
- 12.1.3.3. Company Financials
- 12.1.3.4. SWOT Analysis
- 12.1.4 Dycon Chemicals
- 12.1.4.1. Company Overview
- 12.1.4.2. Products
- 12.1.4.3. Company Financials
- 12.1.4.4. SWOT Analysis
- 12.1.5 Hangzhou Keli Chemical Co Ltd
- 12.1.5.1. Company Overview
- 12.1.5.2. Products
- 12.1.5.3. Company Financials
- 12.1.5.4. SWOT Analysis
- 12.1.6 Jiangsu Tianteng Chemical Industry Co Ltd
- 12.1.6.1. Company Overview
- 12.1.6.2. Products
- 12.1.6.3. Company Financials
- 12.1.6.4. SWOT Analysis
- 12.1.7 Resonac Holdings Corporation
- 12.1.7.1. Company Overview
- 12.1.7.2. Products
- 12.1.7.3. Company Financials
- 12.1.7.4. SWOT Analysis
- 12.1.8 Shandong Gaoxin Chemical Co Ltd
- 12.1.8.1. Company Overview
- 12.1.8.2. Products
- 12.1.8.3. Company Financials
- 12.1.8.4. SWOT Analysis
- 12.1.9 Shandong Ketian Chemical Co Ltd
- 12.1.9.1. Company Overview
- 12.1.9.2. Products
- 12.1.9.3. Company Financials
- 12.1.9.4. SWOT Analysis
- 12.1.10 Shandong Novista Chemical Ltd (Novista Group)
- 12.1.10.1. Company Overview
- 12.1.10.2. Products
- 12.1.10.3. Company Financials
- 12.1.10.4. SWOT Analysis
- 12.1.11 Shandong Xiangsheng New Materials Technology Co Ltd
- 12.1.11.1. Company Overview
- 12.1.11.2. Products
- 12.1.11.3. Company Financials
- 12.1.11.4. SWOT Analysis
- 12.1.12 Shandong Xuye New Materials Co Ltd
- 12.1.12.1. Company Overview
- 12.1.12.2. Products
- 12.1.12.3. Company Financials
- 12.1.12.4. SWOT Analysis
- 12.1.13 Sundow Polymers Co Ltd
- 12.1.13.1. Company Overview
- 12.1.13.2. Products
- 12.1.13.3. Company Financials
- 12.1.13.4. SWOT Analysis
- 12.1.14 Weifang Yaxing Chemical Co Ltd*List Not Exhaustive
- 12.1.14.1. Company Overview
- 12.1.14.2. Products
- 12.1.14.3. Company Financials
- 12.1.14.4. SWOT Analysis
- 12.1.1 Aurora Material Solutions
- 12.2. Market Entropy
- 12.2.1 Company's Key Areas Served
- 12.2.2 Recent Developments
- 12.3. Company Market Share Analysis 2025
- 12.3.1 Top 5 Companies Market Share Analysis
- 12.3.2 Top 3 Companies Market Share Analysis
- 12.4. List of Potential Customers
- 13. Research Methodology
List of Figures
- Figure 1: Global CPE Market Revenue Breakdown (Million, %) by Region 2025 & 2033
- Figure 2: Global CPE Market Volume Breakdown (Million, %) by Region 2025 & 2033
- Figure 3: Asia Pacific CPE Market Revenue (Million), by Product 2025 & 2033
- Figure 4: Asia Pacific CPE Market Volume (Million), by Product 2025 & 2033
- Figure 5: Asia Pacific CPE Market Revenue Share (%), by Product 2025 & 2033
- Figure 6: Asia Pacific CPE Market Volume Share (%), by Product 2025 & 2033
- Figure 7: Asia Pacific CPE Market Revenue (Million), by Application 2025 & 2033
- Figure 8: Asia Pacific CPE Market Volume (Million), by Application 2025 & 2033
- Figure 9: Asia Pacific CPE Market Revenue Share (%), by Application 2025 & 2033
- Figure 10: Asia Pacific CPE Market Volume Share (%), by Application 2025 & 2033
- Figure 11: Asia Pacific CPE Market Revenue (Million), by Country 2025 & 2033
- Figure 12: Asia Pacific CPE Market Volume (Million), by Country 2025 & 2033
- Figure 13: Asia Pacific CPE Market Revenue Share (%), by Country 2025 & 2033
- Figure 14: Asia Pacific CPE Market Volume Share (%), by Country 2025 & 2033
- Figure 15: North America CPE Market Revenue (Million), by Product 2025 & 2033
- Figure 16: North America CPE Market Volume (Million), by Product 2025 & 2033
- Figure 17: North America CPE Market Revenue Share (%), by Product 2025 & 2033
- Figure 18: North America CPE Market Volume Share (%), by Product 2025 & 2033
- Figure 19: North America CPE Market Revenue (Million), by Application 2025 & 2033
- Figure 20: North America CPE Market Volume (Million), by Application 2025 & 2033
- Figure 21: North America CPE Market Revenue Share (%), by Application 2025 & 2033
- Figure 22: North America CPE Market Volume Share (%), by Application 2025 & 2033
- Figure 23: North America CPE Market Revenue (Million), by Country 2025 & 2033
- Figure 24: North America CPE Market Volume (Million), by Country 2025 & 2033
- Figure 25: North America CPE Market Revenue Share (%), by Country 2025 & 2033
- Figure 26: North America CPE Market Volume Share (%), by Country 2025 & 2033
- Figure 27: Europe CPE Market Revenue (Million), by Product 2025 & 2033
- Figure 28: Europe CPE Market Volume (Million), by Product 2025 & 2033
- Figure 29: Europe CPE Market Revenue Share (%), by Product 2025 & 2033
- Figure 30: Europe CPE Market Volume Share (%), by Product 2025 & 2033
- Figure 31: Europe CPE Market Revenue (Million), by Application 2025 & 2033
- Figure 32: Europe CPE Market Volume (Million), by Application 2025 & 2033
- Figure 33: Europe CPE Market Revenue Share (%), by Application 2025 & 2033
- Figure 34: Europe CPE Market Volume Share (%), by Application 2025 & 2033
- Figure 35: Europe CPE Market Revenue (Million), by Country 2025 & 2033
- Figure 36: Europe CPE Market Volume (Million), by Country 2025 & 2033
- Figure 37: Europe CPE Market Revenue Share (%), by Country 2025 & 2033
- Figure 38: Europe CPE Market Volume Share (%), by Country 2025 & 2033
- Figure 39: South America CPE Market Revenue (Million), by Product 2025 & 2033
- Figure 40: South America CPE Market Volume (Million), by Product 2025 & 2033
- Figure 41: South America CPE Market Revenue Share (%), by Product 2025 & 2033
- Figure 42: South America CPE Market Volume Share (%), by Product 2025 & 2033
- Figure 43: South America CPE Market Revenue (Million), by Application 2025 & 2033
- Figure 44: South America CPE Market Volume (Million), by Application 2025 & 2033
- Figure 45: South America CPE Market Revenue Share (%), by Application 2025 & 2033
- Figure 46: South America CPE Market Volume Share (%), by Application 2025 & 2033
- Figure 47: South America CPE Market Revenue (Million), by Country 2025 & 2033
- Figure 48: South America CPE Market Volume (Million), by Country 2025 & 2033
- Figure 49: South America CPE Market Revenue Share (%), by Country 2025 & 2033
- Figure 50: South America CPE Market Volume Share (%), by Country 2025 & 2033
- Figure 51: Middle East and Africa CPE Market Revenue (Million), by Product 2025 & 2033
- Figure 52: Middle East and Africa CPE Market Volume (Million), by Product 2025 & 2033
- Figure 53: Middle East and Africa CPE Market Revenue Share (%), by Product 2025 & 2033
- Figure 54: Middle East and Africa CPE Market Volume Share (%), by Product 2025 & 2033
- Figure 55: Middle East and Africa CPE Market Revenue (Million), by Application 2025 & 2033
- Figure 56: Middle East and Africa CPE Market Volume (Million), by Application 2025 & 2033
- Figure 57: Middle East and Africa CPE Market Revenue Share (%), by Application 2025 & 2033
- Figure 58: Middle East and Africa CPE Market Volume Share (%), by Application 2025 & 2033
- Figure 59: Middle East and Africa CPE Market Revenue (Million), by Country 2025 & 2033
- Figure 60: Middle East and Africa CPE Market Volume (Million), by Country 2025 & 2033
- Figure 61: Middle East and Africa CPE Market Revenue Share (%), by Country 2025 & 2033
- Figure 62: Middle East and Africa CPE Market Volume Share (%), by Country 2025 & 2033
List of Tables
- Table 1: Global CPE Market Revenue Million Forecast, by Product 2020 & 2033
- Table 2: Global CPE Market Volume Million Forecast, by Product 2020 & 2033
- Table 3: Global CPE Market Revenue Million Forecast, by Application 2020 & 2033
- Table 4: Global CPE Market Volume Million Forecast, by Application 2020 & 2033
- Table 5: Global CPE Market Revenue Million Forecast, by Region 2020 & 2033
- Table 6: Global CPE Market Volume Million Forecast, by Region 2020 & 2033
- Table 7: Global CPE Market Revenue Million Forecast, by Product 2020 & 2033
- Table 8: Global CPE Market Volume Million Forecast, by Product 2020 & 2033
- Table 9: Global CPE Market Revenue Million Forecast, by Application 2020 & 2033
- Table 10: Global CPE Market Volume Million Forecast, by Application 2020 & 2033
- Table 11: Global CPE Market Revenue Million Forecast, by Country 2020 & 2033
- Table 12: Global CPE Market Volume Million Forecast, by Country 2020 & 2033
- Table 13: China CPE Market Revenue (Million) Forecast, by Application 2020 & 2033
- Table 14: China CPE Market Volume (Million) Forecast, by Application 2020 & 2033
- Table 15: India CPE Market Revenue (Million) Forecast, by Application 2020 & 2033
- Table 16: India CPE Market Volume (Million) Forecast, by Application 2020 & 2033
- Table 17: Japan CPE Market Revenue (Million) Forecast, by Application 2020 & 2033
- Table 18: Japan CPE Market Volume (Million) Forecast, by Application 2020 & 2033
- Table 19: South Korea CPE Market Revenue (Million) Forecast, by Application 2020 & 2033
- Table 20: South Korea CPE Market Volume (Million) Forecast, by Application 2020 & 2033
- Table 21: Rest of Asia Pacific CPE Market Revenue (Million) Forecast, by Application 2020 & 2033
- Table 22: Rest of Asia Pacific CPE Market Volume (Million) Forecast, by Application 2020 & 2033
- Table 23: Global CPE Market Revenue Million Forecast, by Product 2020 & 2033
- Table 24: Global CPE Market Volume Million Forecast, by Product 2020 & 2033
- Table 25: Global CPE Market Revenue Million Forecast, by Application 2020 & 2033
- Table 26: Global CPE Market Volume Million Forecast, by Application 2020 & 2033
- Table 27: Global CPE Market Revenue Million Forecast, by Country 2020 & 2033
- Table 28: Global CPE Market Volume Million Forecast, by Country 2020 & 2033
- Table 29: United States CPE Market Revenue (Million) Forecast, by Application 2020 & 2033
- Table 30: United States CPE Market Volume (Million) Forecast, by Application 2020 & 2033
- Table 31: Canada CPE Market Revenue (Million) Forecast, by Application 2020 & 2033
- Table 32: Canada CPE Market Volume (Million) Forecast, by Application 2020 & 2033
- Table 33: Mexico CPE Market Revenue (Million) Forecast, by Application 2020 & 2033
- Table 34: Mexico CPE Market Volume (Million) Forecast, by Application 2020 & 2033
- Table 35: Global CPE Market Revenue Million Forecast, by Product 2020 & 2033
- Table 36: Global CPE Market Volume Million Forecast, by Product 2020 & 2033
- Table 37: Global CPE Market Revenue Million Forecast, by Application 2020 & 2033
- Table 38: Global CPE Market Volume Million Forecast, by Application 2020 & 2033
- Table 39: Global CPE Market Revenue Million Forecast, by Country 2020 & 2033
- Table 40: Global CPE Market Volume Million Forecast, by Country 2020 & 2033
- Table 41: Germany CPE Market Revenue (Million) Forecast, by Application 2020 & 2033
- Table 42: Germany CPE Market Volume (Million) Forecast, by Application 2020 & 2033
- Table 43: United Kingdom CPE Market Revenue (Million) Forecast, by Application 2020 & 2033
- Table 44: United Kingdom CPE Market Volume (Million) Forecast, by Application 2020 & 2033
- Table 45: France CPE Market Revenue (Million) Forecast, by Application 2020 & 2033
- Table 46: France CPE Market Volume (Million) Forecast, by Application 2020 & 2033
- Table 47: Italy CPE Market Revenue (Million) Forecast, by Application 2020 & 2033
- Table 48: Italy CPE Market Volume (Million) Forecast, by Application 2020 & 2033
- Table 49: Rest of Europe CPE Market Revenue (Million) Forecast, by Application 2020 & 2033
- Table 50: Rest of Europe CPE Market Volume (Million) Forecast, by Application 2020 & 2033
- Table 51: Global CPE Market Revenue Million Forecast, by Product 2020 & 2033
- Table 52: Global CPE Market Volume Million Forecast, by Product 2020 & 2033
- Table 53: Global CPE Market Revenue Million Forecast, by Application 2020 & 2033
- Table 54: Global CPE Market Volume Million Forecast, by Application 2020 & 2033
- Table 55: Global CPE Market Revenue Million Forecast, by Country 2020 & 2033
- Table 56: Global CPE Market Volume Million Forecast, by Country 2020 & 2033
- Table 57: Brazil CPE Market Revenue (Million) Forecast, by Application 2020 & 2033
- Table 58: Brazil CPE Market Volume (Million) Forecast, by Application 2020 & 2033
- Table 59: Argentina CPE Market Revenue (Million) Forecast, by Application 2020 & 2033
- Table 60: Argentina CPE Market Volume (Million) Forecast, by Application 2020 & 2033
- Table 61: Rest of South America CPE Market Revenue (Million) Forecast, by Application 2020 & 2033
- Table 62: Rest of South America CPE Market Volume (Million) Forecast, by Application 2020 & 2033
- Table 63: Global CPE Market Revenue Million Forecast, by Product 2020 & 2033
- Table 64: Global CPE Market Volume Million Forecast, by Product 2020 & 2033
- Table 65: Global CPE Market Revenue Million Forecast, by Application 2020 & 2033
- Table 66: Global CPE Market Volume Million Forecast, by Application 2020 & 2033
- Table 67: Global CPE Market Revenue Million Forecast, by Country 2020 & 2033
- Table 68: Global CPE Market Volume Million Forecast, by Country 2020 & 2033
- Table 69: Saudi Arabia CPE Market Revenue (Million) Forecast, by Application 2020 & 2033
- Table 70: Saudi Arabia CPE Market Volume (Million) Forecast, by Application 2020 & 2033
- Table 71: South Africa CPE Market Revenue (Million) Forecast, by Application 2020 & 2033
- Table 72: South Africa CPE Market Volume (Million) Forecast, by Application 2020 & 2033
- Table 73: Rest of Middle East and Africa CPE Market Revenue (Million) Forecast, by Application 2020 & 2033
- Table 74: Rest of Middle East and Africa CPE Market Volume (Million) Forecast, by Application 2020 & 2033
Frequently Asked Questions
1. What is the projected Compound Annual Growth Rate (CAGR) of the CPE Market?
The projected CAGR is approximately 5.45%.
2. Which companies are prominent players in the CPE Market?
Key companies in the market include Aurora Material Solutions, Bontecn Group China Co Ltd, Dow, Dycon Chemicals, Hangzhou Keli Chemical Co Ltd, Jiangsu Tianteng Chemical Industry Co Ltd, Resonac Holdings Corporation, Shandong Gaoxin Chemical Co Ltd, Shandong Ketian Chemical Co Ltd, Shandong Novista Chemical Ltd (Novista Group), Shandong Xiangsheng New Materials Technology Co Ltd, Shandong Xuye New Materials Co Ltd, Sundow Polymers Co Ltd, Weifang Yaxing Chemical Co Ltd*List Not Exhaustive.
3. What are the main segments of the CPE Market?
The market segments include Product, Application.
4. Can you provide details about the market size?
The market size is estimated to be USD 721.25 Million as of 2022.
5. What are some drivers contributing to market growth?
Rising Demand for CPE-based Impact Modifiers in PVC Products; Growing Demand for CPE-based Hoses and Tubes in the Automotive Industry.
6. What are the notable trends driving market growth?
Impact Modifier is Expected to Dominate the Market.
7. Are there any restraints impacting market growth?
Rising Demand for CPE-based Impact Modifiers in PVC Products; Growing Demand for CPE-based Hoses and Tubes in the Automotive Industry.
8. Can you provide examples of recent developments in the market?
May 2024: Aurora Plastics LLC (Aurora) announced the acquisition of EnCom Polymers Inc., extending its product offering to include chlorinated polyethylene alloys (CPE). This acquisition strengthened Aurora Plastics LLC's product portfolio.
9. What pricing options are available for accessing the report?
Pricing options include single-user, multi-user, and enterprise licenses priced at USD 4750, USD 5250, and USD 8750 respectively.
10. Is the market size provided in terms of value or volume?
The market size is provided in terms of value, measured in Million and volume, measured in Million.
11. Are there any specific market keywords associated with the report?
Yes, the market keyword associated with the report is "CPE Market," which aids in identifying and referencing the specific market segment covered.
12. How do I determine which pricing option suits my needs best?
The pricing options vary based on user requirements and access needs. Individual users may opt for single-user licenses, while businesses requiring broader access may choose multi-user or enterprise licenses for cost-effective access to the report.
13. Are there any additional resources or data provided in the CPE Market report?
While the report offers comprehensive insights, it's advisable to review the specific contents or supplementary materials provided to ascertain if additional resources or data are available.
14. How can I stay updated on further developments or reports in the CPE Market?
To stay informed about further developments, trends, and reports in the CPE Market, consider subscribing to industry newsletters, following relevant companies and organizations, or regularly checking reputable industry news sources and publications.
Methodology
Step 1 - Identification of Relevant Samples Size from Population Database


Step 2 - Approaches for Defining Global Market Size (Value, Volume* & Price*)

Note*: In applicable scenarios
Step 3 - Data Sources
Primary Research
- Web Analytics
- Survey Reports
- Research Institute
- Latest Research Reports
- Opinion Leaders
Secondary Research
- Annual Reports
- White Paper
- Latest Press Release
- Industry Association
- Paid Database
- Investor Presentations

Step 4 - Data Triangulation
Involves using different sources of information in order to increase the validity of a study
These sources are likely to be stakeholders in a program - participants, other researchers, program staff, other community members, and so on.
Then we put all data in single framework & apply various statistical tools to find out the dynamic on the market.
During the analysis stage, feedback from the stakeholder groups would be compared to determine areas of agreement as well as areas of divergence