

Key Insights
The global crash cushion market is projected to reach an impressive $804.7 million by 2025, demonstrating a robust Compound Annual Growth Rate (CAGR) of 3.9% during the forecast period of 2025-2033. This significant market valuation underscores the critical role of crash cushions in enhancing road safety and mitigating the severity of vehicle impacts. The market is propelled by a confluence of factors, most notably the increasing global emphasis on infrastructure development and the subsequent expansion of road networks, especially in emerging economies. Growing concerns for pedestrian and driver safety, coupled with stringent regulatory mandates for roadside safety features, are acting as powerful drivers for market expansion. Furthermore, advancements in material science and engineering have led to the development of more effective, lightweight, and cost-efficient crash cushion designs, further stimulating adoption across various road applications. The continuous need to upgrade aging road infrastructure and incorporate modern safety solutions in new projects will continue to fuel demand.
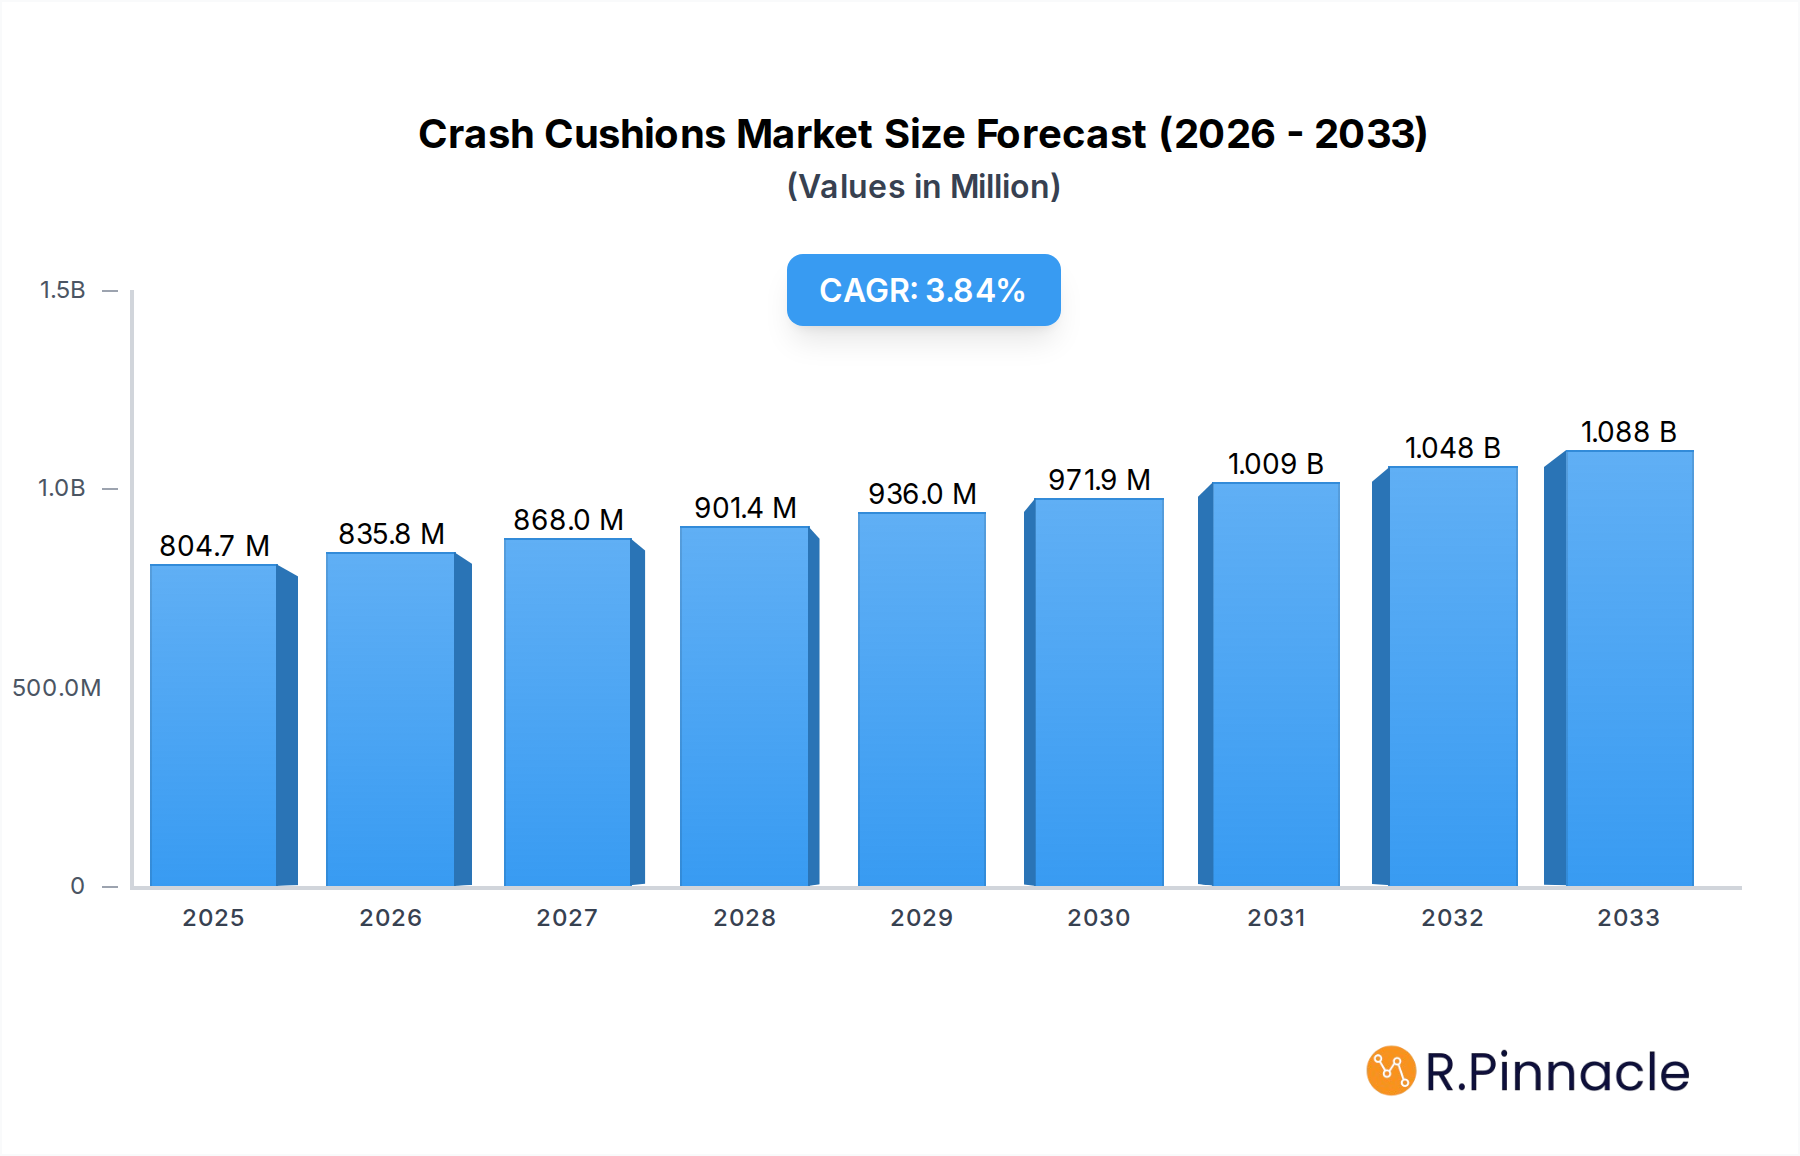
Crash Cushions Market Size (In Million)
The market is segmented by application into highway, urban road, and others, with highways likely representing the largest segment due to higher speed limits and increased traffic volumes. Non-redirective and redirective crash cushions form the primary types, with redirective systems gaining traction for their ability to guide errant vehicles away from hazards. Key players like Verdegro, Lindsay Corporation, and Trinity Industries are actively investing in research and development to introduce innovative products that offer superior impact absorption and protection. The market is expected to witness steady growth across all major regions, with Asia Pacific, driven by China and India's substantial infrastructure investments, and North America, with its mature road network and focus on safety upgrades, emerging as significant contributors. Europe also presents a substantial market, owing to its comprehensive safety standards and ongoing road modernization projects. The ongoing smart city initiatives and the integration of intelligent transportation systems are also expected to create new avenues for advanced crash cushion technologies.

Crash Cushions Company Market Share
Crash Cushions Market Analysis: A Comprehensive Report (2019–2033)
This in-depth report provides a definitive analysis of the global crash cushions market, offering crucial insights for industry stakeholders. Covering a comprehensive study period from 2019 to 2033, with a base year of 2025, this report delves into market structure, dynamics, regional dominance, product innovations, and future outlook. Leverage actionable data and strategic recommendations to navigate the evolving landscape of road safety solutions.
Crash Cushions Market Structure & Innovation Trends
The global crash cushions market exhibits a XX concentration, with leading players like Verdegro, Stuer-Egghe, TrafFix Devices, Lindsay Corporation, Trinity Industries, Valmont Industries, OBO Bettermann Group, Shindo Industry, SMA Road Safety, Gregory Industries, Hill & Smith, and Smart Air Chamber (SAC) holding significant market share. Innovation is primarily driven by the demand for enhanced safety standards, technological advancements in energy absorption, and the increasing implementation of smart infrastructure solutions. Regulatory frameworks, particularly those from governmental road safety agencies, play a pivotal role in shaping product development and market entry. Product substitutes, while limited, include alternative traffic control measures and passive safety barriers, but dedicated crash cushions remain the preferred choice for critical impact absorption. End-user demographics are predominantly government transportation departments, construction companies, and private infrastructure developers. Mergers and acquisitions (M&A) activities have been sporadic, with deal values often in the range of tens to hundreds of million. For instance, a notable M&A transaction in 2023 involving a key player was valued at approximately xx million, indicating consolidation potential in niche segments.
Market Concentration & Key Players
- Leading Companies: Verdegro, Stuer-Egghe, TrafFix Devices, Lindsay Corporation, Trinity Industries, Valmont Industries, OBO Bettermann Group, Shindo Industry, SMA Road Safety, Gregory Industries, Hill & Smith, Smart Air Chamber (SAC).
- Market Share: Estimated XX% held by top 5 players.
- M&A Activity: Focused on acquiring innovative technologies and expanding regional reach.
- Deal Values: Ranging from xx million to xx million for strategic acquisitions.
Crash Cushions Market Dynamics & Trends
The crash cushions market is poised for robust growth, driven by an escalating global emphasis on road safety and a significant increase in infrastructure development projects worldwide. This surge in construction and renovation of roadways, coupled with stricter government regulations mandating the deployment of advanced safety features, acts as a primary growth catalyst. Technological disruptions are continuously shaping the market, with a strong focus on developing lighter, more durable, and highly energy-absorbent crash cushion systems. Innovations in materials science, such as advanced composites and recyclable polymers, are enabling the creation of more effective and environmentally friendly solutions. Furthermore, the integration of smart technologies, including sensors and connectivity features, is paving the way for intelligent traffic management and real-time impact data collection. Consumer preferences are increasingly shifting towards crash cushions that offer superior impact protection, ease of installation and maintenance, and cost-effectiveness over their lifecycle. The competitive dynamics within the market are characterized by intense innovation, strategic partnerships, and a growing demand for customized solutions to meet diverse road conditions and traffic volumes. The market penetration of advanced crash cushion systems is projected to witness a significant upward trend, driven by both new installations and the replacement of older, less efficient systems. The projected Compound Annual Growth Rate (CAGR) for the crash cushions market is approximately xx% from 2025 to 2033. This growth is fueled by an estimated market size of xx billion in 2025, expected to reach xx billion by 2033.
Key Growth Drivers
- Infrastructure Investment: Significant global spending on new road construction and upgrades.
- Safety Regulations: Increasing stringency of road safety standards worldwide.
- Technological Advancements: Development of lighter, more durable, and energy-efficient materials.
- Smart Infrastructure Integration: Adoption of connected technologies for enhanced traffic management.
Market Penetration
- Current Penetration: xx% for advanced crash cushion systems.
- Projected Penetration: xx% by 2033.
Dominant Regions & Segments in Crash Cushions
North America currently stands as the dominant region in the global crash cushions market, largely due to its well-established infrastructure, continuous investment in road safety enhancements, and stringent regulatory environment. The United States, in particular, represents a substantial portion of this regional dominance, driven by extensive highway networks and ongoing infrastructure modernization programs. The Highway application segment is the largest contributor to the market's revenue, accounting for an estimated XX% of the total market size in 2025. This is directly linked to the high volume of traffic and the critical need for impact protection on major arterial routes and interstates.
Leading Region: North America (driven by the USA).
Key Drivers for North America:
- Extensive highway infrastructure.
- Government initiatives focused on road safety.
- High adoption rate of advanced safety technologies.
- Significant spending on infrastructure upgrades.
Dominant Application Segment: Highway.
- Economic Policies: Government funding for transportation projects directly boosts highway infrastructure development.
- Infrastructure Needs: The sheer scale of highway systems necessitates robust safety barriers.
- Traffic Volume: High-speed traffic on highways increases the risk and need for effective crash cushions.
Dominant Type: Redirective Crash Cushions.
- Performance Advantages: Ability to redirect errant vehicles safely away from hazards, reducing severity of accidents.
- Technological Maturity: Well-established designs and performance validation.
- Regulatory Compliance: Meeting specific safety standards for highway applications.
The Redirective Crash Cushions segment also leads in terms of market share, owing to their superior capability in managing vehicle impacts by not only absorbing energy but also guiding the vehicle away from potential hazards. This makes them indispensable for highway applications where the consequences of uncontrolled impacts can be severe.
Crash Cushions Product Innovations
Recent product innovations in the crash cushions market are centered around enhanced energy absorption capabilities, modular designs for easier installation and repair, and the integration of intelligent sensing technologies. Companies are actively developing lighter yet stronger materials, improving the impact performance of non-redirective and redirective systems, and exploring sustainable and recyclable components. These advancements aim to offer improved safety outcomes, reduced lifecycle costs, and greater adaptability to diverse road environments, providing a distinct competitive advantage in a safety-conscious market.
Report Scope & Segmentation Analysis
This report meticulously segments the crash cushions market across key categories to provide granular insights. The Application segmentation includes Highway, Urban Road, and Others. The Type segmentation encompasses Non-redirective Crash Cushions and Redirective Crash Cushions. Each segment's market size, growth projections, and competitive dynamics are thoroughly analyzed, offering a comprehensive understanding of their individual market potential and strategic importance for stakeholders.
Application Segments:
- Highway: Expected to hold the largest market share, with a CAGR of xx% during the forecast period.
- Urban Road: Growing at a CAGR of xx%, driven by increasing traffic congestion and road safety concerns in cities.
- Others: Encompassing diverse applications like construction sites and temporary work zones, with a projected CAGR of xx%.
Type Segments:
- Non-redirective Crash Cushions: Market size estimated at xx million in 2025, with a CAGR of xx%.
- Redirective Crash Cushions: Dominant segment, projected to reach xx billion by 2033, with a CAGR of xx%.
Key Drivers of Crash Cushions Growth
The crash cushions sector is propelled by several key drivers, primarily stemming from an unwavering global commitment to road safety. Increased government spending on infrastructure modernization and expansion projects worldwide directly translates into higher demand for safety barriers. Furthermore, the continuous evolution of stringent safety regulations mandates the adoption of advanced and certified crash cushion systems, pushing manufacturers to innovate. Technological advancements in materials science and engineering have led to the development of more efficient, lighter, and cost-effective crash cushion solutions, enhancing their market appeal. The growing awareness among transportation authorities and the public about the critical role of crash cushions in mitigating accident severity is also a significant growth accelerant.
- Government Mandates: Increasingly strict safety regulations and standards.
- Infrastructure Development: Global investment in new roads and upgrades.
- Technological Innovation: Advancements in materials and design for better performance.
- Safety Awareness: Growing understanding of crash cushions' role in accident mitigation.
Challenges in the Crash Cushions Sector
Despite the positive growth trajectory, the crash cushions sector faces several challenges. Regulatory hurdles can be significant, with lengthy and complex approval processes for new products in different regions, potentially delaying market entry. Supply chain disruptions, particularly those impacting raw material availability and logistics, can lead to increased costs and production delays. Intense competitive pressure from established players and emerging manufacturers necessitates continuous innovation and cost optimization. Furthermore, the initial capital investment for implementing advanced crash cushion systems can be a barrier for some smaller municipalities or developing regions, impacting wider adoption.
- Regulatory Compliance: Navigating diverse and evolving safety standards.
- Supply Chain Volatility: Risks associated with raw material availability and logistics.
- Competitive Landscape: Pressure to innovate and maintain cost-effectiveness.
- High Initial Investment: Cost barrier for implementing advanced systems.
Emerging Opportunities in Crash Cushions
The crash cushions market presents several compelling emerging opportunities. The increasing focus on sustainable infrastructure opens avenues for crash cushions made from recycled materials or designed for easier end-of-life recycling. The integration of IoT and AI technologies into crash cushions, enabling real-time data collection on traffic flow, impact events, and system performance, offers opportunities for smart city solutions and predictive maintenance. Expanding into developing economies with nascent infrastructure development and a growing emphasis on road safety represents a significant growth frontier. Furthermore, the development of specialized crash cushions for unique applications, such as those designed for electric vehicles or high-speed rail corridors, offers niche market potential.
- Sustainable Materials: Development of eco-friendly and recyclable crash cushions.
- Smart Technologies: Integration of IoT and AI for data collection and analysis.
- Emerging Markets: Expansion into developing regions with growing infrastructure needs.
- Niche Applications: Specialized solutions for unique transportation scenarios.
Leading Players in the Crash Cushions Market
- Verdegro
- Stuer-Egghe
- TrafFix Devices
- Lindsay Corporation
- Trinity Industries
- Valmont Industries
- OBO Bettermann Group
- Shindo Industry
- SMA Road Safety
- Gregory Industries
- Hill & Smith
- Smart Air Chamber (SAC)
Key Developments in Crash Cushions Industry
- 2024 March: Launch of new lightweight, modular crash cushion system by [Company Name] enhancing installation speed and reducing maintenance costs.
- 2023 November: Strategic partnership between Verdegro and a European research institute to develop next-generation impact absorption materials.
- 2023 August: TrafFix Devices expands its product line with innovative non-redirective crash cushions for urban environments.
- 2022 December: Lindsay Corporation announces acquisition of a specialized crash cushion technology firm, strengthening its market position in North America.
- 2022 June: Trinity Industries introduces a recyclable crash cushion design, aligning with sustainability trends in the infrastructure sector.
- 2021 October: OBO Bettermann Group integrates smart sensor technology into its crash cushion offerings for real-time monitoring.
Future Outlook for Crash Cushions Market
The future outlook for the crash cushions market remains highly optimistic, driven by sustained global investment in road infrastructure and an ever-increasing priority placed on public safety. The continued advancements in material science and smart technologies will lead to more efficient, intelligent, and sustainable crash cushion solutions. Strategic opportunities lie in capitalizing on the growing demand in emerging markets, developing specialized products for evolving transportation needs, and leveraging data analytics from integrated smart systems. The market is expected to witness further consolidation and innovation as companies strive to offer comprehensive safety solutions that meet the complex challenges of modern transportation networks.
Crash Cushions Segmentation
-
1. Application
- 1.1. Highway
- 1.2. Urban Road
- 1.3. Others
-
2. Types
- 2.1. Non-redirective Crash Cushions
- 2.2. Redirective Crash Cushions
Crash Cushions Segmentation By Geography
-
1. North America
- 1.1. United States
- 1.2. Canada
- 1.3. Mexico
-
2. South America
- 2.1. Brazil
- 2.2. Argentina
- 2.3. Rest of South America
-
3. Europe
- 3.1. United Kingdom
- 3.2. Germany
- 3.3. France
- 3.4. Italy
- 3.5. Spain
- 3.6. Russia
- 3.7. Benelux
- 3.8. Nordics
- 3.9. Rest of Europe
-
4. Middle East & Africa
- 4.1. Turkey
- 4.2. Israel
- 4.3. GCC
- 4.4. North Africa
- 4.5. South Africa
- 4.6. Rest of Middle East & Africa
-
5. Asia Pacific
- 5.1. China
- 5.2. India
- 5.3. Japan
- 5.4. South Korea
- 5.5. ASEAN
- 5.6. Oceania
- 5.7. Rest of Asia Pacific
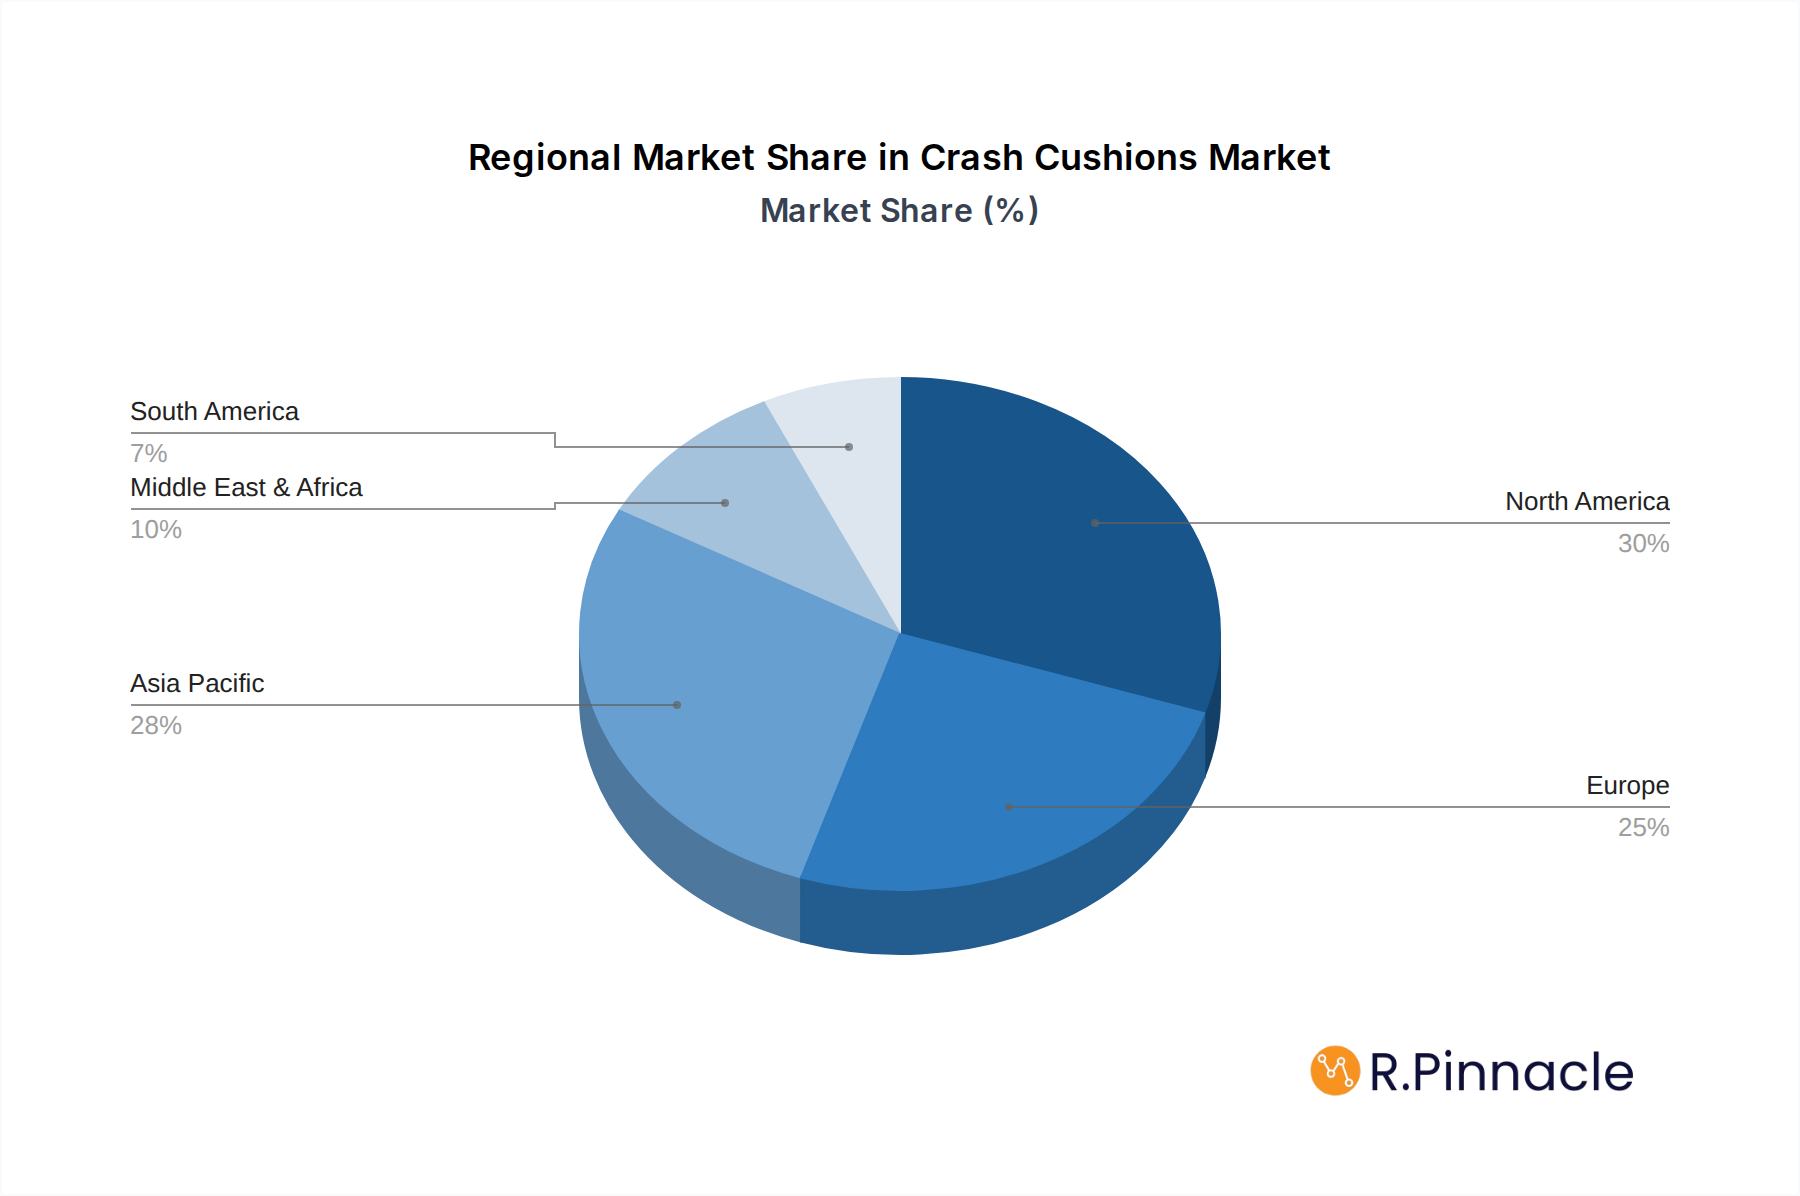
Crash Cushions Regional Market Share
Geographic Coverage of Crash Cushions
Crash Cushions REPORT HIGHLIGHTS
| Aspects | Details |
|---|---|
| Study Period | 2020-2034 |
| Base Year | 2025 |
| Estimated Year | 2026 |
| Forecast Period | 2026-2034 |
| Historical Period | 2020-2025 |
| Growth Rate | CAGR of 3.9% from 2020-2034 |
| Segmentation |
|
Table of Contents
- 1. Introduction
- 1.1. Research Scope
- 1.2. Market Segmentation
- 1.3. Research Methodology
- 1.4. Definitions and Assumptions
- 2. Executive Summary
- 2.1. Introduction
- 3. Market Dynamics
- 3.1. Introduction
- 3.2. Market Drivers
- 3.3. Market Restrains
- 3.4. Market Trends
- 4. Market Factor Analysis
- 4.1. Porters Five Forces
- 4.2. Supply/Value Chain
- 4.3. PESTEL analysis
- 4.4. Market Entropy
- 4.5. Patent/Trademark Analysis
- 5. Global Crash Cushions Analysis, Insights and Forecast, 2020-2032
- 5.1. Market Analysis, Insights and Forecast - by Application
- 5.1.1. Highway
- 5.1.2. Urban Road
- 5.1.3. Others
- 5.2. Market Analysis, Insights and Forecast - by Types
- 5.2.1. Non-redirective Crash Cushions
- 5.2.2. Redirective Crash Cushions
- 5.3. Market Analysis, Insights and Forecast - by Region
- 5.3.1. North America
- 5.3.2. South America
- 5.3.3. Europe
- 5.3.4. Middle East & Africa
- 5.3.5. Asia Pacific
- 5.1. Market Analysis, Insights and Forecast - by Application
- 6. North America Crash Cushions Analysis, Insights and Forecast, 2020-2032
- 6.1. Market Analysis, Insights and Forecast - by Application
- 6.1.1. Highway
- 6.1.2. Urban Road
- 6.1.3. Others
- 6.2. Market Analysis, Insights and Forecast - by Types
- 6.2.1. Non-redirective Crash Cushions
- 6.2.2. Redirective Crash Cushions
- 6.1. Market Analysis, Insights and Forecast - by Application
- 7. South America Crash Cushions Analysis, Insights and Forecast, 2020-2032
- 7.1. Market Analysis, Insights and Forecast - by Application
- 7.1.1. Highway
- 7.1.2. Urban Road
- 7.1.3. Others
- 7.2. Market Analysis, Insights and Forecast - by Types
- 7.2.1. Non-redirective Crash Cushions
- 7.2.2. Redirective Crash Cushions
- 7.1. Market Analysis, Insights and Forecast - by Application
- 8. Europe Crash Cushions Analysis, Insights and Forecast, 2020-2032
- 8.1. Market Analysis, Insights and Forecast - by Application
- 8.1.1. Highway
- 8.1.2. Urban Road
- 8.1.3. Others
- 8.2. Market Analysis, Insights and Forecast - by Types
- 8.2.1. Non-redirective Crash Cushions
- 8.2.2. Redirective Crash Cushions
- 8.1. Market Analysis, Insights and Forecast - by Application
- 9. Middle East & Africa Crash Cushions Analysis, Insights and Forecast, 2020-2032
- 9.1. Market Analysis, Insights and Forecast - by Application
- 9.1.1. Highway
- 9.1.2. Urban Road
- 9.1.3. Others
- 9.2. Market Analysis, Insights and Forecast - by Types
- 9.2.1. Non-redirective Crash Cushions
- 9.2.2. Redirective Crash Cushions
- 9.1. Market Analysis, Insights and Forecast - by Application
- 10. Asia Pacific Crash Cushions Analysis, Insights and Forecast, 2020-2032
- 10.1. Market Analysis, Insights and Forecast - by Application
- 10.1.1. Highway
- 10.1.2. Urban Road
- 10.1.3. Others
- 10.2. Market Analysis, Insights and Forecast - by Types
- 10.2.1. Non-redirective Crash Cushions
- 10.2.2. Redirective Crash Cushions
- 10.1. Market Analysis, Insights and Forecast - by Application
- 11. Competitive Analysis
- 11.1. Global Market Share Analysis 2025
- 11.2. Company Profiles
- 11.2.1 Verdegro
- 11.2.1.1. Overview
- 11.2.1.2. Products
- 11.2.1.3. SWOT Analysis
- 11.2.1.4. Recent Developments
- 11.2.1.5. Financials (Based on Availability)
- 11.2.2 Stuer-Egghe
- 11.2.2.1. Overview
- 11.2.2.2. Products
- 11.2.2.3. SWOT Analysis
- 11.2.2.4. Recent Developments
- 11.2.2.5. Financials (Based on Availability)
- 11.2.3 TrafFix Devices
- 11.2.3.1. Overview
- 11.2.3.2. Products
- 11.2.3.3. SWOT Analysis
- 11.2.3.4. Recent Developments
- 11.2.3.5. Financials (Based on Availability)
- 11.2.4 Lindsay Corporation
- 11.2.4.1. Overview
- 11.2.4.2. Products
- 11.2.4.3. SWOT Analysis
- 11.2.4.4. Recent Developments
- 11.2.4.5. Financials (Based on Availability)
- 11.2.5 Trinity Industries
- 11.2.5.1. Overview
- 11.2.5.2. Products
- 11.2.5.3. SWOT Analysis
- 11.2.5.4. Recent Developments
- 11.2.5.5. Financials (Based on Availability)
- 11.2.6 Valmont Industries
- 11.2.6.1. Overview
- 11.2.6.2. Products
- 11.2.6.3. SWOT Analysis
- 11.2.6.4. Recent Developments
- 11.2.6.5. Financials (Based on Availability)
- 11.2.7 OBO Bettermann Group
- 11.2.7.1. Overview
- 11.2.7.2. Products
- 11.2.7.3. SWOT Analysis
- 11.2.7.4. Recent Developments
- 11.2.7.5. Financials (Based on Availability)
- 11.2.8 Shindo Industry
- 11.2.8.1. Overview
- 11.2.8.2. Products
- 11.2.8.3. SWOT Analysis
- 11.2.8.4. Recent Developments
- 11.2.8.5. Financials (Based on Availability)
- 11.2.9 SMA Road Safety
- 11.2.9.1. Overview
- 11.2.9.2. Products
- 11.2.9.3. SWOT Analysis
- 11.2.9.4. Recent Developments
- 11.2.9.5. Financials (Based on Availability)
- 11.2.10 Gregory Industries
- 11.2.10.1. Overview
- 11.2.10.2. Products
- 11.2.10.3. SWOT Analysis
- 11.2.10.4. Recent Developments
- 11.2.10.5. Financials (Based on Availability)
- 11.2.11 Hill & Smith
- 11.2.11.1. Overview
- 11.2.11.2. Products
- 11.2.11.3. SWOT Analysis
- 11.2.11.4. Recent Developments
- 11.2.11.5. Financials (Based on Availability)
- 11.2.12 Smart Air Chamber (SAC)
- 11.2.12.1. Overview
- 11.2.12.2. Products
- 11.2.12.3. SWOT Analysis
- 11.2.12.4. Recent Developments
- 11.2.12.5. Financials (Based on Availability)
- 11.2.1 Verdegro
List of Figures
- Figure 1: Global Crash Cushions Revenue Breakdown (million, %) by Region 2025 & 2033
- Figure 2: Global Crash Cushions Volume Breakdown (K, %) by Region 2025 & 2033
- Figure 3: North America Crash Cushions Revenue (million), by Application 2025 & 2033
- Figure 4: North America Crash Cushions Volume (K), by Application 2025 & 2033
- Figure 5: North America Crash Cushions Revenue Share (%), by Application 2025 & 2033
- Figure 6: North America Crash Cushions Volume Share (%), by Application 2025 & 2033
- Figure 7: North America Crash Cushions Revenue (million), by Types 2025 & 2033
- Figure 8: North America Crash Cushions Volume (K), by Types 2025 & 2033
- Figure 9: North America Crash Cushions Revenue Share (%), by Types 2025 & 2033
- Figure 10: North America Crash Cushions Volume Share (%), by Types 2025 & 2033
- Figure 11: North America Crash Cushions Revenue (million), by Country 2025 & 2033
- Figure 12: North America Crash Cushions Volume (K), by Country 2025 & 2033
- Figure 13: North America Crash Cushions Revenue Share (%), by Country 2025 & 2033
- Figure 14: North America Crash Cushions Volume Share (%), by Country 2025 & 2033
- Figure 15: South America Crash Cushions Revenue (million), by Application 2025 & 2033
- Figure 16: South America Crash Cushions Volume (K), by Application 2025 & 2033
- Figure 17: South America Crash Cushions Revenue Share (%), by Application 2025 & 2033
- Figure 18: South America Crash Cushions Volume Share (%), by Application 2025 & 2033
- Figure 19: South America Crash Cushions Revenue (million), by Types 2025 & 2033
- Figure 20: South America Crash Cushions Volume (K), by Types 2025 & 2033
- Figure 21: South America Crash Cushions Revenue Share (%), by Types 2025 & 2033
- Figure 22: South America Crash Cushions Volume Share (%), by Types 2025 & 2033
- Figure 23: South America Crash Cushions Revenue (million), by Country 2025 & 2033
- Figure 24: South America Crash Cushions Volume (K), by Country 2025 & 2033
- Figure 25: South America Crash Cushions Revenue Share (%), by Country 2025 & 2033
- Figure 26: South America Crash Cushions Volume Share (%), by Country 2025 & 2033
- Figure 27: Europe Crash Cushions Revenue (million), by Application 2025 & 2033
- Figure 28: Europe Crash Cushions Volume (K), by Application 2025 & 2033
- Figure 29: Europe Crash Cushions Revenue Share (%), by Application 2025 & 2033
- Figure 30: Europe Crash Cushions Volume Share (%), by Application 2025 & 2033
- Figure 31: Europe Crash Cushions Revenue (million), by Types 2025 & 2033
- Figure 32: Europe Crash Cushions Volume (K), by Types 2025 & 2033
- Figure 33: Europe Crash Cushions Revenue Share (%), by Types 2025 & 2033
- Figure 34: Europe Crash Cushions Volume Share (%), by Types 2025 & 2033
- Figure 35: Europe Crash Cushions Revenue (million), by Country 2025 & 2033
- Figure 36: Europe Crash Cushions Volume (K), by Country 2025 & 2033
- Figure 37: Europe Crash Cushions Revenue Share (%), by Country 2025 & 2033
- Figure 38: Europe Crash Cushions Volume Share (%), by Country 2025 & 2033
- Figure 39: Middle East & Africa Crash Cushions Revenue (million), by Application 2025 & 2033
- Figure 40: Middle East & Africa Crash Cushions Volume (K), by Application 2025 & 2033
- Figure 41: Middle East & Africa Crash Cushions Revenue Share (%), by Application 2025 & 2033
- Figure 42: Middle East & Africa Crash Cushions Volume Share (%), by Application 2025 & 2033
- Figure 43: Middle East & Africa Crash Cushions Revenue (million), by Types 2025 & 2033
- Figure 44: Middle East & Africa Crash Cushions Volume (K), by Types 2025 & 2033
- Figure 45: Middle East & Africa Crash Cushions Revenue Share (%), by Types 2025 & 2033
- Figure 46: Middle East & Africa Crash Cushions Volume Share (%), by Types 2025 & 2033
- Figure 47: Middle East & Africa Crash Cushions Revenue (million), by Country 2025 & 2033
- Figure 48: Middle East & Africa Crash Cushions Volume (K), by Country 2025 & 2033
- Figure 49: Middle East & Africa Crash Cushions Revenue Share (%), by Country 2025 & 2033
- Figure 50: Middle East & Africa Crash Cushions Volume Share (%), by Country 2025 & 2033
- Figure 51: Asia Pacific Crash Cushions Revenue (million), by Application 2025 & 2033
- Figure 52: Asia Pacific Crash Cushions Volume (K), by Application 2025 & 2033
- Figure 53: Asia Pacific Crash Cushions Revenue Share (%), by Application 2025 & 2033
- Figure 54: Asia Pacific Crash Cushions Volume Share (%), by Application 2025 & 2033
- Figure 55: Asia Pacific Crash Cushions Revenue (million), by Types 2025 & 2033
- Figure 56: Asia Pacific Crash Cushions Volume (K), by Types 2025 & 2033
- Figure 57: Asia Pacific Crash Cushions Revenue Share (%), by Types 2025 & 2033
- Figure 58: Asia Pacific Crash Cushions Volume Share (%), by Types 2025 & 2033
- Figure 59: Asia Pacific Crash Cushions Revenue (million), by Country 2025 & 2033
- Figure 60: Asia Pacific Crash Cushions Volume (K), by Country 2025 & 2033
- Figure 61: Asia Pacific Crash Cushions Revenue Share (%), by Country 2025 & 2033
- Figure 62: Asia Pacific Crash Cushions Volume Share (%), by Country 2025 & 2033
List of Tables
- Table 1: Global Crash Cushions Revenue million Forecast, by Application 2020 & 2033
- Table 2: Global Crash Cushions Volume K Forecast, by Application 2020 & 2033
- Table 3: Global Crash Cushions Revenue million Forecast, by Types 2020 & 2033
- Table 4: Global Crash Cushions Volume K Forecast, by Types 2020 & 2033
- Table 5: Global Crash Cushions Revenue million Forecast, by Region 2020 & 2033
- Table 6: Global Crash Cushions Volume K Forecast, by Region 2020 & 2033
- Table 7: Global Crash Cushions Revenue million Forecast, by Application 2020 & 2033
- Table 8: Global Crash Cushions Volume K Forecast, by Application 2020 & 2033
- Table 9: Global Crash Cushions Revenue million Forecast, by Types 2020 & 2033
- Table 10: Global Crash Cushions Volume K Forecast, by Types 2020 & 2033
- Table 11: Global Crash Cushions Revenue million Forecast, by Country 2020 & 2033
- Table 12: Global Crash Cushions Volume K Forecast, by Country 2020 & 2033
- Table 13: United States Crash Cushions Revenue (million) Forecast, by Application 2020 & 2033
- Table 14: United States Crash Cushions Volume (K) Forecast, by Application 2020 & 2033
- Table 15: Canada Crash Cushions Revenue (million) Forecast, by Application 2020 & 2033
- Table 16: Canada Crash Cushions Volume (K) Forecast, by Application 2020 & 2033
- Table 17: Mexico Crash Cushions Revenue (million) Forecast, by Application 2020 & 2033
- Table 18: Mexico Crash Cushions Volume (K) Forecast, by Application 2020 & 2033
- Table 19: Global Crash Cushions Revenue million Forecast, by Application 2020 & 2033
- Table 20: Global Crash Cushions Volume K Forecast, by Application 2020 & 2033
- Table 21: Global Crash Cushions Revenue million Forecast, by Types 2020 & 2033
- Table 22: Global Crash Cushions Volume K Forecast, by Types 2020 & 2033
- Table 23: Global Crash Cushions Revenue million Forecast, by Country 2020 & 2033
- Table 24: Global Crash Cushions Volume K Forecast, by Country 2020 & 2033
- Table 25: Brazil Crash Cushions Revenue (million) Forecast, by Application 2020 & 2033
- Table 26: Brazil Crash Cushions Volume (K) Forecast, by Application 2020 & 2033
- Table 27: Argentina Crash Cushions Revenue (million) Forecast, by Application 2020 & 2033
- Table 28: Argentina Crash Cushions Volume (K) Forecast, by Application 2020 & 2033
- Table 29: Rest of South America Crash Cushions Revenue (million) Forecast, by Application 2020 & 2033
- Table 30: Rest of South America Crash Cushions Volume (K) Forecast, by Application 2020 & 2033
- Table 31: Global Crash Cushions Revenue million Forecast, by Application 2020 & 2033
- Table 32: Global Crash Cushions Volume K Forecast, by Application 2020 & 2033
- Table 33: Global Crash Cushions Revenue million Forecast, by Types 2020 & 2033
- Table 34: Global Crash Cushions Volume K Forecast, by Types 2020 & 2033
- Table 35: Global Crash Cushions Revenue million Forecast, by Country 2020 & 2033
- Table 36: Global Crash Cushions Volume K Forecast, by Country 2020 & 2033
- Table 37: United Kingdom Crash Cushions Revenue (million) Forecast, by Application 2020 & 2033
- Table 38: United Kingdom Crash Cushions Volume (K) Forecast, by Application 2020 & 2033
- Table 39: Germany Crash Cushions Revenue (million) Forecast, by Application 2020 & 2033
- Table 40: Germany Crash Cushions Volume (K) Forecast, by Application 2020 & 2033
- Table 41: France Crash Cushions Revenue (million) Forecast, by Application 2020 & 2033
- Table 42: France Crash Cushions Volume (K) Forecast, by Application 2020 & 2033
- Table 43: Italy Crash Cushions Revenue (million) Forecast, by Application 2020 & 2033
- Table 44: Italy Crash Cushions Volume (K) Forecast, by Application 2020 & 2033
- Table 45: Spain Crash Cushions Revenue (million) Forecast, by Application 2020 & 2033
- Table 46: Spain Crash Cushions Volume (K) Forecast, by Application 2020 & 2033
- Table 47: Russia Crash Cushions Revenue (million) Forecast, by Application 2020 & 2033
- Table 48: Russia Crash Cushions Volume (K) Forecast, by Application 2020 & 2033
- Table 49: Benelux Crash Cushions Revenue (million) Forecast, by Application 2020 & 2033
- Table 50: Benelux Crash Cushions Volume (K) Forecast, by Application 2020 & 2033
- Table 51: Nordics Crash Cushions Revenue (million) Forecast, by Application 2020 & 2033
- Table 52: Nordics Crash Cushions Volume (K) Forecast, by Application 2020 & 2033
- Table 53: Rest of Europe Crash Cushions Revenue (million) Forecast, by Application 2020 & 2033
- Table 54: Rest of Europe Crash Cushions Volume (K) Forecast, by Application 2020 & 2033
- Table 55: Global Crash Cushions Revenue million Forecast, by Application 2020 & 2033
- Table 56: Global Crash Cushions Volume K Forecast, by Application 2020 & 2033
- Table 57: Global Crash Cushions Revenue million Forecast, by Types 2020 & 2033
- Table 58: Global Crash Cushions Volume K Forecast, by Types 2020 & 2033
- Table 59: Global Crash Cushions Revenue million Forecast, by Country 2020 & 2033
- Table 60: Global Crash Cushions Volume K Forecast, by Country 2020 & 2033
- Table 61: Turkey Crash Cushions Revenue (million) Forecast, by Application 2020 & 2033
- Table 62: Turkey Crash Cushions Volume (K) Forecast, by Application 2020 & 2033
- Table 63: Israel Crash Cushions Revenue (million) Forecast, by Application 2020 & 2033
- Table 64: Israel Crash Cushions Volume (K) Forecast, by Application 2020 & 2033
- Table 65: GCC Crash Cushions Revenue (million) Forecast, by Application 2020 & 2033
- Table 66: GCC Crash Cushions Volume (K) Forecast, by Application 2020 & 2033
- Table 67: North Africa Crash Cushions Revenue (million) Forecast, by Application 2020 & 2033
- Table 68: North Africa Crash Cushions Volume (K) Forecast, by Application 2020 & 2033
- Table 69: South Africa Crash Cushions Revenue (million) Forecast, by Application 2020 & 2033
- Table 70: South Africa Crash Cushions Volume (K) Forecast, by Application 2020 & 2033
- Table 71: Rest of Middle East & Africa Crash Cushions Revenue (million) Forecast, by Application 2020 & 2033
- Table 72: Rest of Middle East & Africa Crash Cushions Volume (K) Forecast, by Application 2020 & 2033
- Table 73: Global Crash Cushions Revenue million Forecast, by Application 2020 & 2033
- Table 74: Global Crash Cushions Volume K Forecast, by Application 2020 & 2033
- Table 75: Global Crash Cushions Revenue million Forecast, by Types 2020 & 2033
- Table 76: Global Crash Cushions Volume K Forecast, by Types 2020 & 2033
- Table 77: Global Crash Cushions Revenue million Forecast, by Country 2020 & 2033
- Table 78: Global Crash Cushions Volume K Forecast, by Country 2020 & 2033
- Table 79: China Crash Cushions Revenue (million) Forecast, by Application 2020 & 2033
- Table 80: China Crash Cushions Volume (K) Forecast, by Application 2020 & 2033
- Table 81: India Crash Cushions Revenue (million) Forecast, by Application 2020 & 2033
- Table 82: India Crash Cushions Volume (K) Forecast, by Application 2020 & 2033
- Table 83: Japan Crash Cushions Revenue (million) Forecast, by Application 2020 & 2033
- Table 84: Japan Crash Cushions Volume (K) Forecast, by Application 2020 & 2033
- Table 85: South Korea Crash Cushions Revenue (million) Forecast, by Application 2020 & 2033
- Table 86: South Korea Crash Cushions Volume (K) Forecast, by Application 2020 & 2033
- Table 87: ASEAN Crash Cushions Revenue (million) Forecast, by Application 2020 & 2033
- Table 88: ASEAN Crash Cushions Volume (K) Forecast, by Application 2020 & 2033
- Table 89: Oceania Crash Cushions Revenue (million) Forecast, by Application 2020 & 2033
- Table 90: Oceania Crash Cushions Volume (K) Forecast, by Application 2020 & 2033
- Table 91: Rest of Asia Pacific Crash Cushions Revenue (million) Forecast, by Application 2020 & 2033
- Table 92: Rest of Asia Pacific Crash Cushions Volume (K) Forecast, by Application 2020 & 2033
Frequently Asked Questions
1. What is the projected Compound Annual Growth Rate (CAGR) of the Crash Cushions?
The projected CAGR is approximately 3.9%.
2. Which companies are prominent players in the Crash Cushions?
Key companies in the market include Verdegro, Stuer-Egghe, TrafFix Devices, Lindsay Corporation, Trinity Industries, Valmont Industries, OBO Bettermann Group, Shindo Industry, SMA Road Safety, Gregory Industries, Hill & Smith, Smart Air Chamber (SAC).
3. What are the main segments of the Crash Cushions?
The market segments include Application, Types.
4. Can you provide details about the market size?
The market size is estimated to be USD 804.7 million as of 2022.
5. What are some drivers contributing to market growth?
N/A
6. What are the notable trends driving market growth?
N/A
7. Are there any restraints impacting market growth?
N/A
8. Can you provide examples of recent developments in the market?
N/A
9. What pricing options are available for accessing the report?
Pricing options include single-user, multi-user, and enterprise licenses priced at USD 3950.00, USD 5925.00, and USD 7900.00 respectively.
10. Is the market size provided in terms of value or volume?
The market size is provided in terms of value, measured in million and volume, measured in K.
11. Are there any specific market keywords associated with the report?
Yes, the market keyword associated with the report is "Crash Cushions," which aids in identifying and referencing the specific market segment covered.
12. How do I determine which pricing option suits my needs best?
The pricing options vary based on user requirements and access needs. Individual users may opt for single-user licenses, while businesses requiring broader access may choose multi-user or enterprise licenses for cost-effective access to the report.
13. Are there any additional resources or data provided in the Crash Cushions report?
While the report offers comprehensive insights, it's advisable to review the specific contents or supplementary materials provided to ascertain if additional resources or data are available.
14. How can I stay updated on further developments or reports in the Crash Cushions?
To stay informed about further developments, trends, and reports in the Crash Cushions, consider subscribing to industry newsletters, following relevant companies and organizations, or regularly checking reputable industry news sources and publications.
Methodology
Step 1 - Identification of Relevant Samples Size from Population Database


Step 2 - Approaches for Defining Global Market Size (Value, Volume* & Price*)

Note*: In applicable scenarios
Step 3 - Data Sources
Primary Research
- Web Analytics
- Survey Reports
- Research Institute
- Latest Research Reports
- Opinion Leaders
Secondary Research
- Annual Reports
- White Paper
- Latest Press Release
- Industry Association
- Paid Database
- Investor Presentations

Step 4 - Data Triangulation
Involves using different sources of information in order to increase the validity of a study
These sources are likely to be stakeholders in a program - participants, other researchers, program staff, other community members, and so on.
Then we put all data in single framework & apply various statistical tools to find out the dynamic on the market.
During the analysis stage, feedback from the stakeholder groups would be compared to determine areas of agreement as well as areas of divergence