

Key Insights
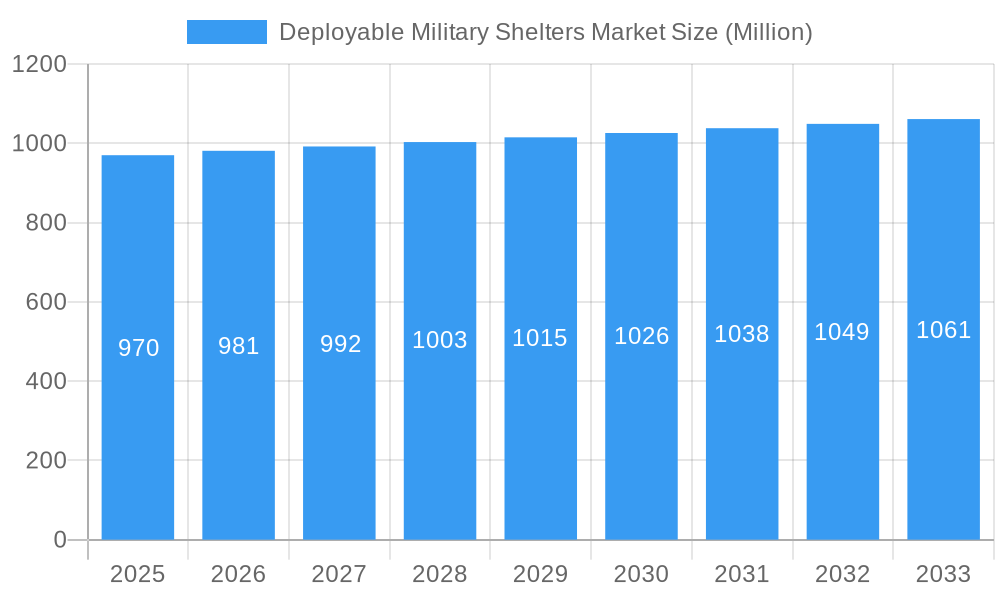
The Deployable Military Shelters market, valued at $0.97 billion in 2025, is projected to experience steady growth, driven by increasing military modernization efforts globally and the rising demand for lightweight, rapidly deployable shelters in diverse operational environments. The market's Compound Annual Growth Rate (CAGR) of 1.14% from 2025 to 2033 indicates a consistent, albeit moderate, expansion. Key drivers include the need for improved soldier comfort and protection in challenging terrains and climates, advancements in shelter materials and technologies leading to enhanced durability and functionality, and the growing adoption of modular and interconnected shelter systems for optimized operational efficiency. Furthermore, increasing involvement in peacekeeping missions and humanitarian aid efforts contributes to the market's expansion, as these operations require temporary, rapidly deployable infrastructure solutions. While factors such as fluctuating defense budgets and the availability of alternative shelter technologies could pose some restraints, the ongoing need for effective and resilient shelter systems across various military operations is expected to outweigh these challenges in the long term. The market segmentation reveals significant regional variations, with North America and Europe expected to dominate due to their high defense spending and established military infrastructure. The Asia-Pacific region is also poised for substantial growth, driven by increasing military expenditures in countries like China and India. The competitive landscape is characterized by a mix of established defense contractors and specialized shelter manufacturers, leading to innovative product development and a focus on meeting the evolving requirements of armed forces worldwide. Demand for technologically advanced features such as improved insulation, enhanced energy efficiency, and integrated communication systems is expected to propel market growth further.
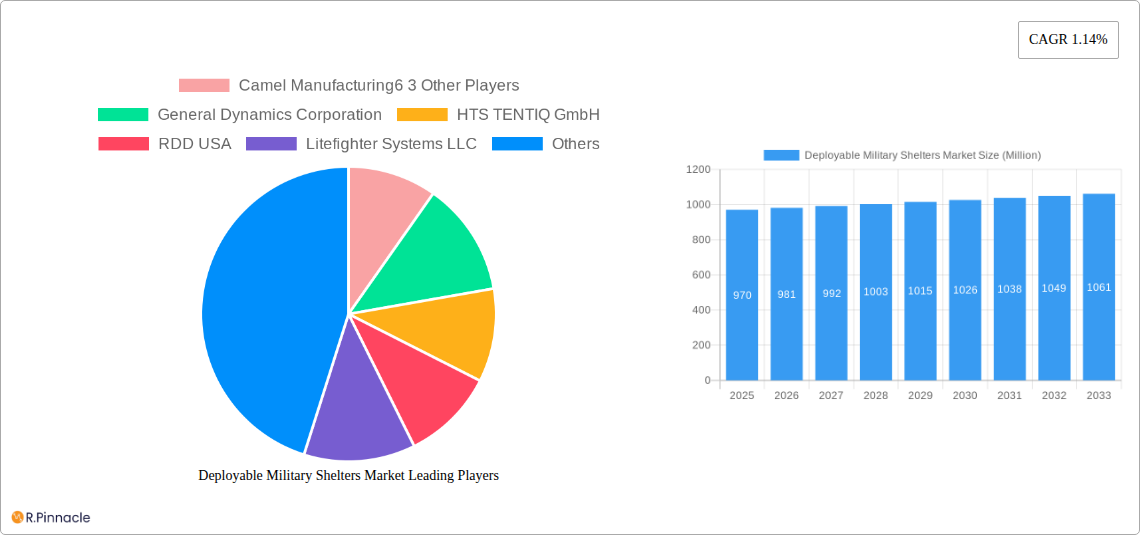
Deployable Military Shelters Market Market Size (In Million)
The competitive landscape is marked by both large multinational corporations such as General Dynamics and Saab AB and smaller specialized companies such as Litefighter Systems LLC and Weatherhaven Global Resources Ltd. This mix contributes to a dynamic environment of innovation and competition. Analysis of the production, consumption, import, and export data, coupled with price trend analysis, provides a comprehensive understanding of market dynamics. The historical period (2019-2024) provides valuable insights into past trends, allowing for more accurate forecasting of future market performance. Detailed regional analysis across North America, Europe, Asia-Pacific, and other regions helps identify key growth opportunities and potential challenges in specific geographic markets. Continued focus on research and development of lightweight, resilient, and technologically advanced shelters will be critical for companies aiming to gain market share and capitalize on the growth potential within this sector.
Deployable Military Shelters Market Company Market Share
Deployable Military Shelters Market: A Comprehensive Report (2019-2033)
This in-depth report provides a comprehensive analysis of the Deployable Military Shelters market, offering invaluable insights for industry professionals, investors, and strategic decision-makers. Covering the period from 2019 to 2033, with a focus on 2025, this report unveils market dynamics, key players, and future growth potential. The study period (2019-2024) provides a historical benchmark, while the forecast period (2025-2033) illuminates future trends.
Deployable Military Shelters Market Market Structure & Innovation Trends
This section analyzes the competitive landscape of the Deployable Military Shelters market, examining market concentration, innovation drivers, regulatory influences, and market dynamics. The market exhibits a moderately concentrated structure, with key players like Camel Manufacturing, General Dynamics Corporation, HTS TENTIQ GmbH, and RDD USA holding significant market share. However, several other players, including Litefighter Systems LLC, Rubb Buildings Ltd, Weatherhaven Global Resources Ltd, and UTS Systems, contribute to the overall market competitiveness. The report estimates that the top 5 players account for approximately xx% of the global market share in 2025. Innovation in materials science, particularly lighter and more durable fabrics, drives market growth. Stringent military specifications and evolving operational needs create a dynamic regulatory framework impacting product development. Substitutes, such as traditional tents or temporary structures, exist, but the unique requirements for durability, deployability, and protection offered by deployable military shelters limit their appeal. M&A activity in this sector has been moderate, with deal values averaging xx Million annually in the past five years. The report further analyzes the impact of end-user demographics (military branches, geographic locations) on market demands.
Deployable Military Shelters Market Market Dynamics & Trends
The global Deployable Military Shelters market is projected to experience a Compound Annual Growth Rate (CAGR) of xx% from 2025 to 2033. This growth is primarily fueled by increasing defense budgets globally, particularly in regions experiencing geopolitical instability. Technological advancements, such as the integration of advanced materials and climate control systems, further enhance shelter functionality, driving demand. Consumer preference for enhanced comfort, durability, and rapid deployability within military operations significantly shapes market trends. Competitive dynamics are shaped by factors such as pricing strategies, technological innovation, and customer relationship management. Market penetration of technologically advanced shelters is gradually increasing as adoption of innovative designs and materials becomes more widespread. The changing geopolitical landscape also influences the market.
Dominant Regions & Segments in Deployable Military Shelters Market
- Production Analysis: North America (particularly the USA) currently holds a dominant position in the production of deployable military shelters, driven by a strong domestic military and robust manufacturing infrastructure.
- Consumption Analysis: The Asia-Pacific region shows the highest consumption, largely due to increasing defense spending and modernization efforts across numerous nations.
- Import Market Analysis (Value & Volume): Europe has high import volumes, reflecting its reliance on specialized shelters from other regions.
- Export Market Analysis (Value & Volume): North America and Europe lead in shelter exports.
- Price Trend Analysis: Prices fluctuate due to raw material costs and technological advancements; however, the overall trend is towards slightly increasing prices due to increased production costs and innovation.
The dominance of these regions is largely attributable to factors such as robust defense budgets, advanced manufacturing capabilities, and strategic geopolitical positions.
Deployable Military Shelters Market Product Innovations
Recent product innovations focus on lighter, more durable materials, enhanced climate control, rapid deployment mechanisms, and improved modularity for customization. These innovations directly address the needs of modern military operations, offering greater flexibility, protection, and operational efficiency. The market favors products that incorporate sustainable and cost-effective materials, along with integrated power and communication systems.
Report Scope & Segmentation Analysis
The report segments the market based on shelter type (e.g., tents, shelters, hardened structures), material (e.g., fabric, metal, composites), end-user (e.g., army, navy, air force), and geographic region. Each segment’s market size and projected growth are detailed in the full report. Growth projections for each segment vary based on factors such as demand from specific military branches and technological advancements influencing that segment's market adoption.
Key Drivers of Deployable Military Shelters Market Growth
Key growth drivers include rising defense spending globally, the demand for lightweight and rapidly deployable shelters for various military missions, and the increasing adoption of advanced materials and technologies that improve shelter functionality and durability. Government initiatives aimed at modernizing military equipment also play a significant role.
Challenges in the Deployable Military Shelters Market Sector
Challenges include fluctuating raw material prices, stringent regulatory standards, the potential for supply chain disruptions, and intense competition among established players. These factors exert pressure on profit margins and necessitate continuous innovation to remain competitive. The impact of these factors on overall market growth is estimated to reduce the projected CAGR by approximately xx%.
Emerging Opportunities in Deployable Military Shelters Market
Emerging opportunities exist in developing innovative shelter designs for specialized environments (extreme weather conditions), incorporating renewable energy sources (solar power), and exploring the use of advanced materials to improve shelter performance and sustainability. The increasing demand for modular and adaptable shelters presents an additional growth opportunity.
Leading Players in the Deployable Military Shelters Market Market
- Camel Manufacturing
- General Dynamics Corporation
- HTS TENTIQ GmbH
- RDD USA
- Litefighter Systems LLC
- Rubb Buildings Ltd
- Weatherhaven Global Resources Ltd
- UTS Systems
- Alaska Structures Inc
- Losberger GmbH
- Federal-Fabrics-Fibers Inc
- Eureka! Expeditionary Systems
- ROF
- NorLense AS
- AAR Corp
- Saab AB
- HDT Global
- 3 Other Players
Key Developments in Deployable Military Shelters Market Industry
- January 2023: General Dynamics announced a new lightweight shelter design incorporating advanced materials.
- June 2022: HTS TENTIQ GmbH launched a new range of climate-controlled shelters.
- November 2021: A strategic partnership between Camel Manufacturing and RDD USA was formed to expand their market reach. (Further developments included as available)
Future Outlook for Deployable Military Shelters Market Market
The future of the Deployable Military Shelters market looks promising, driven by ongoing technological advancements, increased defense spending, and the expanding need for reliable and effective shelters in diverse operational environments. Strategic partnerships, focus on innovation, and the expansion into new markets will be key to success in this dynamic sector. The market is anticipated to reach xx Million by 2033, offering substantial growth opportunities for market participants.
Deployable Military Shelters Market Segmentation
- 1. Production Analysis
- 2. Consumption Analysis
- 3. Import Market Analysis (Value & Volume)
- 4. Export Market Analysis (Value & Volume)
- 5. Price Trend Analysis
Deployable Military Shelters Market Segmentation By Geography
-
1. North America
- 1.1. United States
- 1.2. Canada
- 1.3. Mexico
-
2. South America
- 2.1. Brazil
- 2.2. Argentina
- 2.3. Rest of South America
-
3. Europe
- 3.1. United Kingdom
- 3.2. Germany
- 3.3. France
- 3.4. Italy
- 3.5. Spain
- 3.6. Russia
- 3.7. Benelux
- 3.8. Nordics
- 3.9. Rest of Europe
-
4. Middle East & Africa
- 4.1. Turkey
- 4.2. Israel
- 4.3. GCC
- 4.4. North Africa
- 4.5. South Africa
- 4.6. Rest of Middle East & Africa
-
5. Asia Pacific
- 5.1. China
- 5.2. India
- 5.3. Japan
- 5.4. South Korea
- 5.5. ASEAN
- 5.6. Oceania
- 5.7. Rest of Asia Pacific
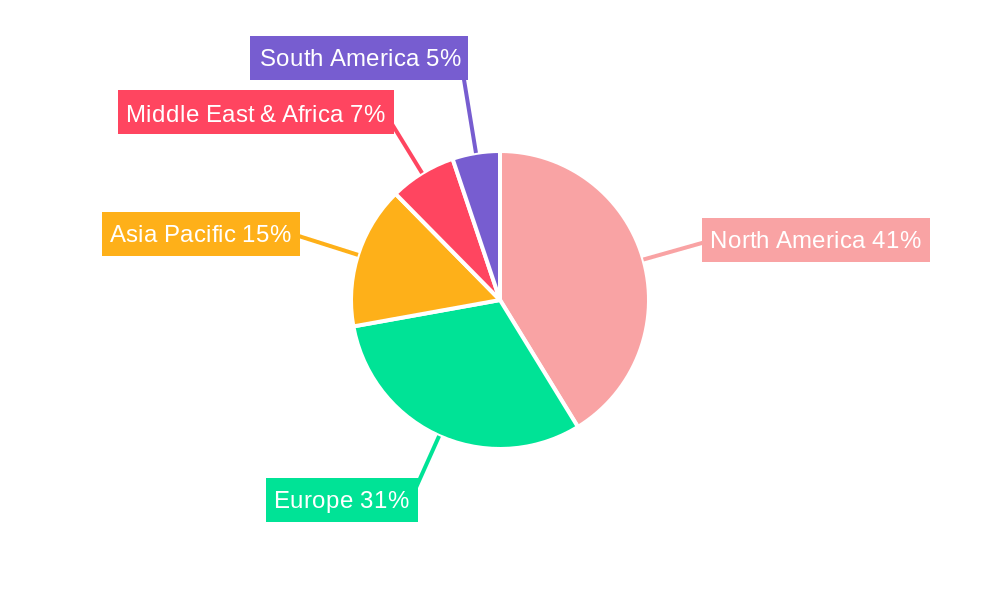
Deployable Military Shelters Market Regional Market Share
Geographic Coverage of Deployable Military Shelters Market
Deployable Military Shelters Market REPORT HIGHLIGHTS
| Aspects | Details |
|---|---|
| Study Period | 2020-2034 |
| Base Year | 2025 |
| Estimated Year | 2026 |
| Forecast Period | 2026-2034 |
| Historical Period | 2020-2025 |
| Growth Rate | CAGR of 1.14% from 2020-2034 |
| Segmentation |
|
Table of Contents
- 1. Introduction
- 1.1. Research Scope
- 1.2. Market Segmentation
- 1.3. Research Objective
- 1.4. Definitions and Assumptions
- 2. Executive Summary
- 2.1. Market Snapshot
- 3. Market Dynamics
- 3.1. Market Drivers
- 3.2. Market Restrains
- 3.3. Market Trends
- 3.4. Market Opportunities
- 4. Market Factor Analysis
- 4.1. Porters Five Forces
- 4.1.1. Bargaining Power of Suppliers
- 4.1.2. Bargaining Power of Buyers
- 4.1.3. Threat of New Entrants
- 4.1.4. Threat of Substitutes
- 4.1.5. Competitive Rivalry
- 4.2. PESTEL analysis
- 4.3. BCG Analysis
- 4.3.1. Stars (High Growth, High Market Share)
- 4.3.2. Cash Cows (Low Growth, High Market Share)
- 4.3.3. Question Mark (High Growth, Low Market Share)
- 4.3.4. Dogs (Low Growth, Low Market Share)
- 4.4. Ansoff Matrix Analysis
- 4.5. Supply Chain Analysis
- 4.6. Regulatory Landscape
- 4.7. Current Market Potential and Opportunity Assessment (TAM–SAM–SOM Framework)
- 4.8. PRI Analyst Note
- 4.1. Porters Five Forces
- 5. Market Analysis, Insights and Forecast 2021-2033
- 5.1. Market Analysis, Insights and Forecast - by Production Analysis
- 5.2. Market Analysis, Insights and Forecast - by Consumption Analysis
- 5.3. Market Analysis, Insights and Forecast - by Import Market Analysis (Value & Volume)
- 5.4. Market Analysis, Insights and Forecast - by Export Market Analysis (Value & Volume)
- 5.5. Market Analysis, Insights and Forecast - by Price Trend Analysis
- 5.6. Market Analysis, Insights and Forecast - by Region
- 5.6.1. North America
- 5.6.2. South America
- 5.6.3. Europe
- 5.6.4. Middle East & Africa
- 5.6.5. Asia Pacific
- 6. Global Deployable Military Shelters Market Analysis, Insights and Forecast, 2021-2033
- 6.1. Market Analysis, Insights and Forecast - by Production Analysis
- 6.2. Market Analysis, Insights and Forecast - by Consumption Analysis
- 6.3. Market Analysis, Insights and Forecast - by Import Market Analysis (Value & Volume)
- 6.4. Market Analysis, Insights and Forecast - by Export Market Analysis (Value & Volume)
- 6.5. Market Analysis, Insights and Forecast - by Price Trend Analysis
- 7. North America Deployable Military Shelters Market Analysis, Insights and Forecast, 2020-2032
- 7.1. Market Analysis, Insights and Forecast - by Production Analysis
- 7.2. Market Analysis, Insights and Forecast - by Consumption Analysis
- 7.3. Market Analysis, Insights and Forecast - by Import Market Analysis (Value & Volume)
- 7.4. Market Analysis, Insights and Forecast - by Export Market Analysis (Value & Volume)
- 7.5. Market Analysis, Insights and Forecast - by Price Trend Analysis
- 8. South America Deployable Military Shelters Market Analysis, Insights and Forecast, 2020-2032
- 8.1. Market Analysis, Insights and Forecast - by Production Analysis
- 8.2. Market Analysis, Insights and Forecast - by Consumption Analysis
- 8.3. Market Analysis, Insights and Forecast - by Import Market Analysis (Value & Volume)
- 8.4. Market Analysis, Insights and Forecast - by Export Market Analysis (Value & Volume)
- 8.5. Market Analysis, Insights and Forecast - by Price Trend Analysis
- 9. Europe Deployable Military Shelters Market Analysis, Insights and Forecast, 2020-2032
- 9.1. Market Analysis, Insights and Forecast - by Production Analysis
- 9.2. Market Analysis, Insights and Forecast - by Consumption Analysis
- 9.3. Market Analysis, Insights and Forecast - by Import Market Analysis (Value & Volume)
- 9.4. Market Analysis, Insights and Forecast - by Export Market Analysis (Value & Volume)
- 9.5. Market Analysis, Insights and Forecast - by Price Trend Analysis
- 10. Middle East & Africa Deployable Military Shelters Market Analysis, Insights and Forecast, 2020-2032
- 10.1. Market Analysis, Insights and Forecast - by Production Analysis
- 10.2. Market Analysis, Insights and Forecast - by Consumption Analysis
- 10.3. Market Analysis, Insights and Forecast - by Import Market Analysis (Value & Volume)
- 10.4. Market Analysis, Insights and Forecast - by Export Market Analysis (Value & Volume)
- 10.5. Market Analysis, Insights and Forecast - by Price Trend Analysis
- 11. Asia Pacific Deployable Military Shelters Market Analysis, Insights and Forecast, 2020-2032
- 11.1. Market Analysis, Insights and Forecast - by Production Analysis
- 11.2. Market Analysis, Insights and Forecast - by Consumption Analysis
- 11.3. Market Analysis, Insights and Forecast - by Import Market Analysis (Value & Volume)
- 11.4. Market Analysis, Insights and Forecast - by Export Market Analysis (Value & Volume)
- 11.5. Market Analysis, Insights and Forecast - by Price Trend Analysis
- 12. Competitive Analysis
- 12.1. Company Profiles
- 12.1.1 Camel Manufacturing6 3 Other Players
- 12.1.1.1. Company Overview
- 12.1.1.2. Products
- 12.1.1.3. Company Financials
- 12.1.1.4. SWOT Analysis
- 12.1.2 General Dynamics Corporation
- 12.1.2.1. Company Overview
- 12.1.2.2. Products
- 12.1.2.3. Company Financials
- 12.1.2.4. SWOT Analysis
- 12.1.3 HTS TENTIQ GmbH
- 12.1.3.1. Company Overview
- 12.1.3.2. Products
- 12.1.3.3. Company Financials
- 12.1.3.4. SWOT Analysis
- 12.1.4 RDD USA
- 12.1.4.1. Company Overview
- 12.1.4.2. Products
- 12.1.4.3. Company Financials
- 12.1.4.4. SWOT Analysis
- 12.1.5 Litefighter Systems LLC
- 12.1.5.1. Company Overview
- 12.1.5.2. Products
- 12.1.5.3. Company Financials
- 12.1.5.4. SWOT Analysis
- 12.1.6 Rubb Buildings Ltd
- 12.1.6.1. Company Overview
- 12.1.6.2. Products
- 12.1.6.3. Company Financials
- 12.1.6.4. SWOT Analysis
- 12.1.7 Weatherhaven Global Resources Ltd
- 12.1.7.1. Company Overview
- 12.1.7.2. Products
- 12.1.7.3. Company Financials
- 12.1.7.4. SWOT Analysis
- 12.1.8 UTS Systems
- 12.1.8.1. Company Overview
- 12.1.8.2. Products
- 12.1.8.3. Company Financials
- 12.1.8.4. SWOT Analysis
- 12.1.9 Alaska Structures Inc
- 12.1.9.1. Company Overview
- 12.1.9.2. Products
- 12.1.9.3. Company Financials
- 12.1.9.4. SWOT Analysis
- 12.1.10 Losberger GmbH
- 12.1.10.1. Company Overview
- 12.1.10.2. Products
- 12.1.10.3. Company Financials
- 12.1.10.4. SWOT Analysis
- 12.1.11 Federal-Fabrics-Fibers Inc
- 12.1.11.1. Company Overview
- 12.1.11.2. Products
- 12.1.11.3. Company Financials
- 12.1.11.4. SWOT Analysis
- 12.1.12 Eureka! Expeditionary Systems
- 12.1.12.1. Company Overview
- 12.1.12.2. Products
- 12.1.12.3. Company Financials
- 12.1.12.4. SWOT Analysis
- 12.1.13 ROF
- 12.1.13.1. Company Overview
- 12.1.13.2. Products
- 12.1.13.3. Company Financials
- 12.1.13.4. SWOT Analysis
- 12.1.14 NorLense AS
- 12.1.14.1. Company Overview
- 12.1.14.2. Products
- 12.1.14.3. Company Financials
- 12.1.14.4. SWOT Analysis
- 12.1.15 AAR Corp
- 12.1.15.1. Company Overview
- 12.1.15.2. Products
- 12.1.15.3. Company Financials
- 12.1.15.4. SWOT Analysis
- 12.1.16 Saab AB
- 12.1.16.1. Company Overview
- 12.1.16.2. Products
- 12.1.16.3. Company Financials
- 12.1.16.4. SWOT Analysis
- 12.1.17 HDT Global
- 12.1.17.1. Company Overview
- 12.1.17.2. Products
- 12.1.17.3. Company Financials
- 12.1.17.4. SWOT Analysis
- 12.1.1 Camel Manufacturing6 3 Other Players
- 12.2. Market Entropy
- 12.2.1 Company's Key Areas Served
- 12.2.2 Recent Developments
- 12.3. Company Market Share Analysis 2025
- 12.3.1 Top 5 Companies Market Share Analysis
- 12.3.2 Top 3 Companies Market Share Analysis
- 12.4. List of Potential Customers
- 13. Research Methodology
List of Figures
- Figure 1: Global Deployable Military Shelters Market Revenue Breakdown (billion, %) by Region 2025 & 2033
- Figure 2: North America Deployable Military Shelters Market Revenue (billion), by Production Analysis 2025 & 2033
- Figure 3: North America Deployable Military Shelters Market Revenue Share (%), by Production Analysis 2025 & 2033
- Figure 4: North America Deployable Military Shelters Market Revenue (billion), by Consumption Analysis 2025 & 2033
- Figure 5: North America Deployable Military Shelters Market Revenue Share (%), by Consumption Analysis 2025 & 2033
- Figure 6: North America Deployable Military Shelters Market Revenue (billion), by Import Market Analysis (Value & Volume) 2025 & 2033
- Figure 7: North America Deployable Military Shelters Market Revenue Share (%), by Import Market Analysis (Value & Volume) 2025 & 2033
- Figure 8: North America Deployable Military Shelters Market Revenue (billion), by Export Market Analysis (Value & Volume) 2025 & 2033
- Figure 9: North America Deployable Military Shelters Market Revenue Share (%), by Export Market Analysis (Value & Volume) 2025 & 2033
- Figure 10: North America Deployable Military Shelters Market Revenue (billion), by Price Trend Analysis 2025 & 2033
- Figure 11: North America Deployable Military Shelters Market Revenue Share (%), by Price Trend Analysis 2025 & 2033
- Figure 12: North America Deployable Military Shelters Market Revenue (billion), by Country 2025 & 2033
- Figure 13: North America Deployable Military Shelters Market Revenue Share (%), by Country 2025 & 2033
- Figure 14: South America Deployable Military Shelters Market Revenue (billion), by Production Analysis 2025 & 2033
- Figure 15: South America Deployable Military Shelters Market Revenue Share (%), by Production Analysis 2025 & 2033
- Figure 16: South America Deployable Military Shelters Market Revenue (billion), by Consumption Analysis 2025 & 2033
- Figure 17: South America Deployable Military Shelters Market Revenue Share (%), by Consumption Analysis 2025 & 2033
- Figure 18: South America Deployable Military Shelters Market Revenue (billion), by Import Market Analysis (Value & Volume) 2025 & 2033
- Figure 19: South America Deployable Military Shelters Market Revenue Share (%), by Import Market Analysis (Value & Volume) 2025 & 2033
- Figure 20: South America Deployable Military Shelters Market Revenue (billion), by Export Market Analysis (Value & Volume) 2025 & 2033
- Figure 21: South America Deployable Military Shelters Market Revenue Share (%), by Export Market Analysis (Value & Volume) 2025 & 2033
- Figure 22: South America Deployable Military Shelters Market Revenue (billion), by Price Trend Analysis 2025 & 2033
- Figure 23: South America Deployable Military Shelters Market Revenue Share (%), by Price Trend Analysis 2025 & 2033
- Figure 24: South America Deployable Military Shelters Market Revenue (billion), by Country 2025 & 2033
- Figure 25: South America Deployable Military Shelters Market Revenue Share (%), by Country 2025 & 2033
- Figure 26: Europe Deployable Military Shelters Market Revenue (billion), by Production Analysis 2025 & 2033
- Figure 27: Europe Deployable Military Shelters Market Revenue Share (%), by Production Analysis 2025 & 2033
- Figure 28: Europe Deployable Military Shelters Market Revenue (billion), by Consumption Analysis 2025 & 2033
- Figure 29: Europe Deployable Military Shelters Market Revenue Share (%), by Consumption Analysis 2025 & 2033
- Figure 30: Europe Deployable Military Shelters Market Revenue (billion), by Import Market Analysis (Value & Volume) 2025 & 2033
- Figure 31: Europe Deployable Military Shelters Market Revenue Share (%), by Import Market Analysis (Value & Volume) 2025 & 2033
- Figure 32: Europe Deployable Military Shelters Market Revenue (billion), by Export Market Analysis (Value & Volume) 2025 & 2033
- Figure 33: Europe Deployable Military Shelters Market Revenue Share (%), by Export Market Analysis (Value & Volume) 2025 & 2033
- Figure 34: Europe Deployable Military Shelters Market Revenue (billion), by Price Trend Analysis 2025 & 2033
- Figure 35: Europe Deployable Military Shelters Market Revenue Share (%), by Price Trend Analysis 2025 & 2033
- Figure 36: Europe Deployable Military Shelters Market Revenue (billion), by Country 2025 & 2033
- Figure 37: Europe Deployable Military Shelters Market Revenue Share (%), by Country 2025 & 2033
- Figure 38: Middle East & Africa Deployable Military Shelters Market Revenue (billion), by Production Analysis 2025 & 2033
- Figure 39: Middle East & Africa Deployable Military Shelters Market Revenue Share (%), by Production Analysis 2025 & 2033
- Figure 40: Middle East & Africa Deployable Military Shelters Market Revenue (billion), by Consumption Analysis 2025 & 2033
- Figure 41: Middle East & Africa Deployable Military Shelters Market Revenue Share (%), by Consumption Analysis 2025 & 2033
- Figure 42: Middle East & Africa Deployable Military Shelters Market Revenue (billion), by Import Market Analysis (Value & Volume) 2025 & 2033
- Figure 43: Middle East & Africa Deployable Military Shelters Market Revenue Share (%), by Import Market Analysis (Value & Volume) 2025 & 2033
- Figure 44: Middle East & Africa Deployable Military Shelters Market Revenue (billion), by Export Market Analysis (Value & Volume) 2025 & 2033
- Figure 45: Middle East & Africa Deployable Military Shelters Market Revenue Share (%), by Export Market Analysis (Value & Volume) 2025 & 2033
- Figure 46: Middle East & Africa Deployable Military Shelters Market Revenue (billion), by Price Trend Analysis 2025 & 2033
- Figure 47: Middle East & Africa Deployable Military Shelters Market Revenue Share (%), by Price Trend Analysis 2025 & 2033
- Figure 48: Middle East & Africa Deployable Military Shelters Market Revenue (billion), by Country 2025 & 2033
- Figure 49: Middle East & Africa Deployable Military Shelters Market Revenue Share (%), by Country 2025 & 2033
- Figure 50: Asia Pacific Deployable Military Shelters Market Revenue (billion), by Production Analysis 2025 & 2033
- Figure 51: Asia Pacific Deployable Military Shelters Market Revenue Share (%), by Production Analysis 2025 & 2033
- Figure 52: Asia Pacific Deployable Military Shelters Market Revenue (billion), by Consumption Analysis 2025 & 2033
- Figure 53: Asia Pacific Deployable Military Shelters Market Revenue Share (%), by Consumption Analysis 2025 & 2033
- Figure 54: Asia Pacific Deployable Military Shelters Market Revenue (billion), by Import Market Analysis (Value & Volume) 2025 & 2033
- Figure 55: Asia Pacific Deployable Military Shelters Market Revenue Share (%), by Import Market Analysis (Value & Volume) 2025 & 2033
- Figure 56: Asia Pacific Deployable Military Shelters Market Revenue (billion), by Export Market Analysis (Value & Volume) 2025 & 2033
- Figure 57: Asia Pacific Deployable Military Shelters Market Revenue Share (%), by Export Market Analysis (Value & Volume) 2025 & 2033
- Figure 58: Asia Pacific Deployable Military Shelters Market Revenue (billion), by Price Trend Analysis 2025 & 2033
- Figure 59: Asia Pacific Deployable Military Shelters Market Revenue Share (%), by Price Trend Analysis 2025 & 2033
- Figure 60: Asia Pacific Deployable Military Shelters Market Revenue (billion), by Country 2025 & 2033
- Figure 61: Asia Pacific Deployable Military Shelters Market Revenue Share (%), by Country 2025 & 2033
List of Tables
- Table 1: Global Deployable Military Shelters Market Revenue billion Forecast, by Production Analysis 2020 & 2033
- Table 2: Global Deployable Military Shelters Market Revenue billion Forecast, by Consumption Analysis 2020 & 2033
- Table 3: Global Deployable Military Shelters Market Revenue billion Forecast, by Import Market Analysis (Value & Volume) 2020 & 2033
- Table 4: Global Deployable Military Shelters Market Revenue billion Forecast, by Export Market Analysis (Value & Volume) 2020 & 2033
- Table 5: Global Deployable Military Shelters Market Revenue billion Forecast, by Price Trend Analysis 2020 & 2033
- Table 6: Global Deployable Military Shelters Market Revenue billion Forecast, by Region 2020 & 2033
- Table 7: Global Deployable Military Shelters Market Revenue billion Forecast, by Production Analysis 2020 & 2033
- Table 8: Global Deployable Military Shelters Market Revenue billion Forecast, by Consumption Analysis 2020 & 2033
- Table 9: Global Deployable Military Shelters Market Revenue billion Forecast, by Import Market Analysis (Value & Volume) 2020 & 2033
- Table 10: Global Deployable Military Shelters Market Revenue billion Forecast, by Export Market Analysis (Value & Volume) 2020 & 2033
- Table 11: Global Deployable Military Shelters Market Revenue billion Forecast, by Price Trend Analysis 2020 & 2033
- Table 12: Global Deployable Military Shelters Market Revenue billion Forecast, by Country 2020 & 2033
- Table 13: United States Deployable Military Shelters Market Revenue (billion) Forecast, by Application 2020 & 2033
- Table 14: Canada Deployable Military Shelters Market Revenue (billion) Forecast, by Application 2020 & 2033
- Table 15: Mexico Deployable Military Shelters Market Revenue (billion) Forecast, by Application 2020 & 2033
- Table 16: Global Deployable Military Shelters Market Revenue billion Forecast, by Production Analysis 2020 & 2033
- Table 17: Global Deployable Military Shelters Market Revenue billion Forecast, by Consumption Analysis 2020 & 2033
- Table 18: Global Deployable Military Shelters Market Revenue billion Forecast, by Import Market Analysis (Value & Volume) 2020 & 2033
- Table 19: Global Deployable Military Shelters Market Revenue billion Forecast, by Export Market Analysis (Value & Volume) 2020 & 2033
- Table 20: Global Deployable Military Shelters Market Revenue billion Forecast, by Price Trend Analysis 2020 & 2033
- Table 21: Global Deployable Military Shelters Market Revenue billion Forecast, by Country 2020 & 2033
- Table 22: Brazil Deployable Military Shelters Market Revenue (billion) Forecast, by Application 2020 & 2033
- Table 23: Argentina Deployable Military Shelters Market Revenue (billion) Forecast, by Application 2020 & 2033
- Table 24: Rest of South America Deployable Military Shelters Market Revenue (billion) Forecast, by Application 2020 & 2033
- Table 25: Global Deployable Military Shelters Market Revenue billion Forecast, by Production Analysis 2020 & 2033
- Table 26: Global Deployable Military Shelters Market Revenue billion Forecast, by Consumption Analysis 2020 & 2033
- Table 27: Global Deployable Military Shelters Market Revenue billion Forecast, by Import Market Analysis (Value & Volume) 2020 & 2033
- Table 28: Global Deployable Military Shelters Market Revenue billion Forecast, by Export Market Analysis (Value & Volume) 2020 & 2033
- Table 29: Global Deployable Military Shelters Market Revenue billion Forecast, by Price Trend Analysis 2020 & 2033
- Table 30: Global Deployable Military Shelters Market Revenue billion Forecast, by Country 2020 & 2033
- Table 31: United Kingdom Deployable Military Shelters Market Revenue (billion) Forecast, by Application 2020 & 2033
- Table 32: Germany Deployable Military Shelters Market Revenue (billion) Forecast, by Application 2020 & 2033
- Table 33: France Deployable Military Shelters Market Revenue (billion) Forecast, by Application 2020 & 2033
- Table 34: Italy Deployable Military Shelters Market Revenue (billion) Forecast, by Application 2020 & 2033
- Table 35: Spain Deployable Military Shelters Market Revenue (billion) Forecast, by Application 2020 & 2033
- Table 36: Russia Deployable Military Shelters Market Revenue (billion) Forecast, by Application 2020 & 2033
- Table 37: Benelux Deployable Military Shelters Market Revenue (billion) Forecast, by Application 2020 & 2033
- Table 38: Nordics Deployable Military Shelters Market Revenue (billion) Forecast, by Application 2020 & 2033
- Table 39: Rest of Europe Deployable Military Shelters Market Revenue (billion) Forecast, by Application 2020 & 2033
- Table 40: Global Deployable Military Shelters Market Revenue billion Forecast, by Production Analysis 2020 & 2033
- Table 41: Global Deployable Military Shelters Market Revenue billion Forecast, by Consumption Analysis 2020 & 2033
- Table 42: Global Deployable Military Shelters Market Revenue billion Forecast, by Import Market Analysis (Value & Volume) 2020 & 2033
- Table 43: Global Deployable Military Shelters Market Revenue billion Forecast, by Export Market Analysis (Value & Volume) 2020 & 2033
- Table 44: Global Deployable Military Shelters Market Revenue billion Forecast, by Price Trend Analysis 2020 & 2033
- Table 45: Global Deployable Military Shelters Market Revenue billion Forecast, by Country 2020 & 2033
- Table 46: Turkey Deployable Military Shelters Market Revenue (billion) Forecast, by Application 2020 & 2033
- Table 47: Israel Deployable Military Shelters Market Revenue (billion) Forecast, by Application 2020 & 2033
- Table 48: GCC Deployable Military Shelters Market Revenue (billion) Forecast, by Application 2020 & 2033
- Table 49: North Africa Deployable Military Shelters Market Revenue (billion) Forecast, by Application 2020 & 2033
- Table 50: South Africa Deployable Military Shelters Market Revenue (billion) Forecast, by Application 2020 & 2033
- Table 51: Rest of Middle East & Africa Deployable Military Shelters Market Revenue (billion) Forecast, by Application 2020 & 2033
- Table 52: Global Deployable Military Shelters Market Revenue billion Forecast, by Production Analysis 2020 & 2033
- Table 53: Global Deployable Military Shelters Market Revenue billion Forecast, by Consumption Analysis 2020 & 2033
- Table 54: Global Deployable Military Shelters Market Revenue billion Forecast, by Import Market Analysis (Value & Volume) 2020 & 2033
- Table 55: Global Deployable Military Shelters Market Revenue billion Forecast, by Export Market Analysis (Value & Volume) 2020 & 2033
- Table 56: Global Deployable Military Shelters Market Revenue billion Forecast, by Price Trend Analysis 2020 & 2033
- Table 57: Global Deployable Military Shelters Market Revenue billion Forecast, by Country 2020 & 2033
- Table 58: China Deployable Military Shelters Market Revenue (billion) Forecast, by Application 2020 & 2033
- Table 59: India Deployable Military Shelters Market Revenue (billion) Forecast, by Application 2020 & 2033
- Table 60: Japan Deployable Military Shelters Market Revenue (billion) Forecast, by Application 2020 & 2033
- Table 61: South Korea Deployable Military Shelters Market Revenue (billion) Forecast, by Application 2020 & 2033
- Table 62: ASEAN Deployable Military Shelters Market Revenue (billion) Forecast, by Application 2020 & 2033
- Table 63: Oceania Deployable Military Shelters Market Revenue (billion) Forecast, by Application 2020 & 2033
- Table 64: Rest of Asia Pacific Deployable Military Shelters Market Revenue (billion) Forecast, by Application 2020 & 2033
Frequently Asked Questions
1. What is the projected Compound Annual Growth Rate (CAGR) of the Deployable Military Shelters Market?
The projected CAGR is approximately 1.14%.
2. Which companies are prominent players in the Deployable Military Shelters Market?
Key companies in the market include Camel Manufacturing6 3 Other Players, General Dynamics Corporation, HTS TENTIQ GmbH, RDD USA, Litefighter Systems LLC, Rubb Buildings Ltd, Weatherhaven Global Resources Ltd, UTS Systems, Alaska Structures Inc, Losberger GmbH, Federal-Fabrics-Fibers Inc, Eureka! Expeditionary Systems, ROF, NorLense AS, AAR Corp, Saab AB, HDT Global.
3. What are the main segments of the Deployable Military Shelters Market?
The market segments include Production Analysis, Consumption Analysis, Import Market Analysis (Value & Volume), Export Market Analysis (Value & Volume), Price Trend Analysis.
4. Can you provide details about the market size?
The market size is estimated to be USD 0.98 billion as of 2022.
5. What are some drivers contributing to market growth?
Increase in Internet of Things (IoT) and Autonomous Systems; Rise in Demand for Military and Defense Satellite Communication Solutions.
6. What are the notable trends driving market growth?
Other Types Segment Accounted for a Major Market Share in 2021.
7. Are there any restraints impacting market growth?
Cybersecurity Threats to Satellite Communication; Interference in Transmission of Data.
8. Can you provide examples of recent developments in the market?
N/A
9. What pricing options are available for accessing the report?
Pricing options include single-user, multi-user, and enterprise licenses priced at USD 4750, USD 5250, and USD 8750 respectively.
10. Is the market size provided in terms of value or volume?
The market size is provided in terms of value, measured in billion.
11. Are there any specific market keywords associated with the report?
Yes, the market keyword associated with the report is "Deployable Military Shelters Market," which aids in identifying and referencing the specific market segment covered.
12. How do I determine which pricing option suits my needs best?
The pricing options vary based on user requirements and access needs. Individual users may opt for single-user licenses, while businesses requiring broader access may choose multi-user or enterprise licenses for cost-effective access to the report.
13. Are there any additional resources or data provided in the Deployable Military Shelters Market report?
While the report offers comprehensive insights, it's advisable to review the specific contents or supplementary materials provided to ascertain if additional resources or data are available.
14. How can I stay updated on further developments or reports in the Deployable Military Shelters Market?
To stay informed about further developments, trends, and reports in the Deployable Military Shelters Market, consider subscribing to industry newsletters, following relevant companies and organizations, or regularly checking reputable industry news sources and publications.
Methodology
Step 1 - Identification of Relevant Samples Size from Population Database


Step 2 - Approaches for Defining Global Market Size (Value, Volume* & Price*)

Note*: In applicable scenarios
Step 3 - Data Sources
Primary Research
- Web Analytics
- Survey Reports
- Research Institute
- Latest Research Reports
- Opinion Leaders
Secondary Research
- Annual Reports
- White Paper
- Latest Press Release
- Industry Association
- Paid Database
- Investor Presentations

Step 4 - Data Triangulation
Involves using different sources of information in order to increase the validity of a study
These sources are likely to be stakeholders in a program - participants, other researchers, program staff, other community members, and so on.
Then we put all data in single framework & apply various statistical tools to find out the dynamic on the market.
During the analysis stage, feedback from the stakeholder groups would be compared to determine areas of agreement as well as areas of divergence