

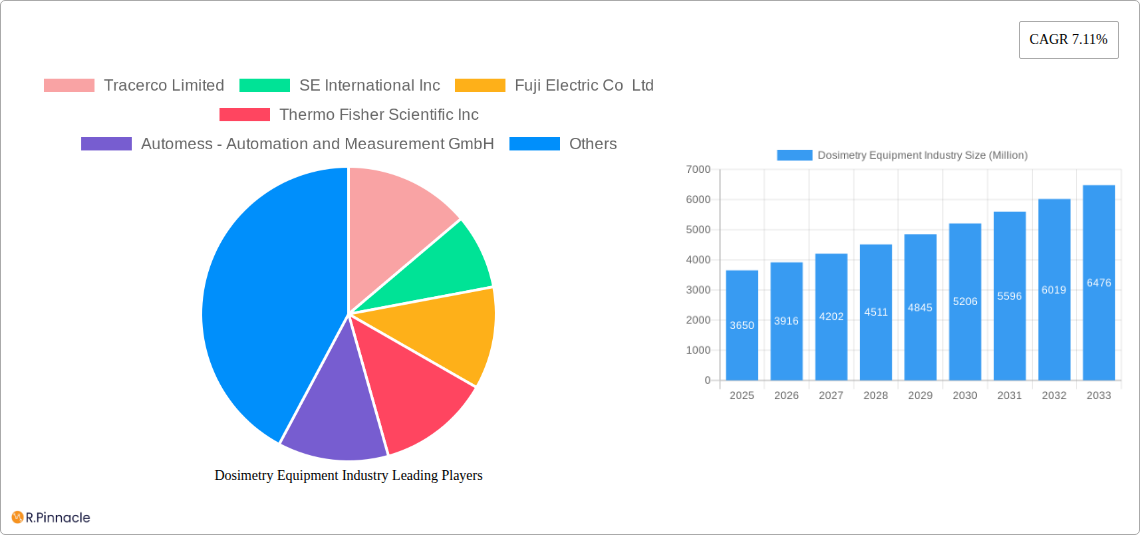
Key Insights
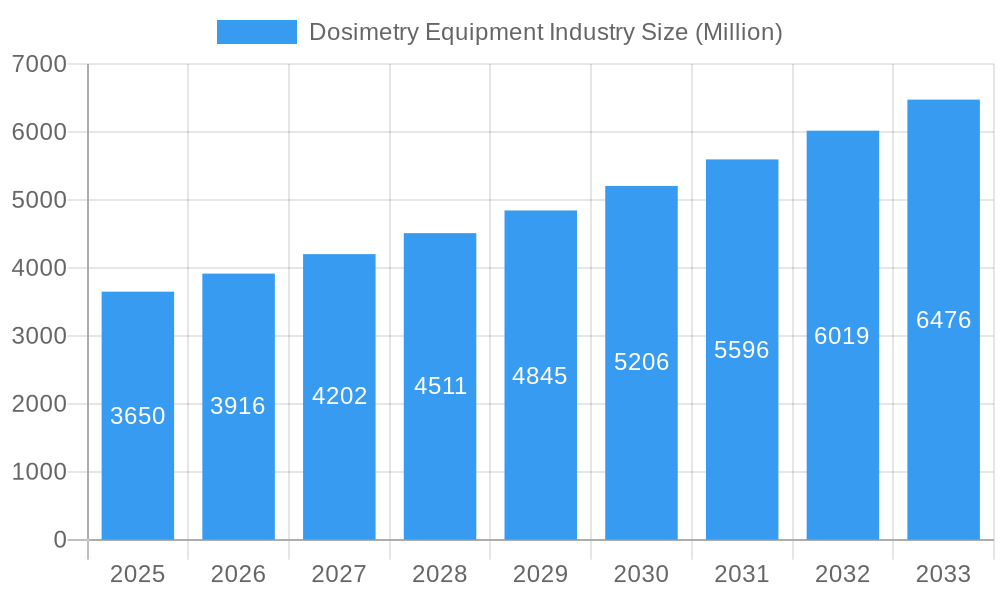
The dosimetry equipment market, valued at $3.65 billion in 2025, is projected to experience robust growth, driven by increasing regulatory mandates for radiation safety across various industries and rising awareness of occupational radiation hazards. The market's Compound Annual Growth Rate (CAGR) of 7.11% from 2025 to 2033 indicates significant expansion opportunities. Key drivers include the growing adoption of advanced dosimetry technologies like Optically Stimulated Luminescence Dosimeters (OSLs) offering higher accuracy and sensitivity compared to traditional methods. Furthermore, the expanding healthcare sector, particularly in diagnostic imaging and radiation therapy, fuels substantial demand for reliable and precise dosimetry equipment. The increasing use of radiation in industrial applications, including oil and gas exploration and manufacturing processes, also contributes to market growth. However, high initial investment costs associated with advanced dosimetry systems and the need for specialized training for operation and maintenance could pose challenges. The market segmentation reveals a significant share held by the healthcare end-user industry, followed by oil and gas, driven by stringent safety regulations in these sectors. Electronic Personal Dosimeters (EPDs) are projected to maintain a dominant market share among different types due to their portability and ease of use.
Dosimetry Equipment Industry Market Size (In Billion)
Technological advancements are transforming the dosimetry landscape, with a focus on miniaturization, improved accuracy, and wireless connectivity features. The integration of sophisticated data analysis tools and software solutions enhances the efficiency of radiation monitoring and dose management. The market is geographically diverse, with North America and Europe holding significant shares owing to established healthcare infrastructure and stringent radiation safety regulations. However, the Asia-Pacific region is anticipated to exhibit rapid growth, fueled by economic expansion and rising industrialization. Competition is intense, with established players and emerging technology providers vying for market share through innovation, strategic partnerships, and acquisitions. The forecast period (2025-2033) presents considerable opportunities for companies offering advanced dosimetry solutions that address the evolving needs of diverse industries and regions.
Dosimetry Equipment Industry Company Market Share
Dosimetry Equipment Industry Market Report: 2019-2033
This comprehensive report provides an in-depth analysis of the Dosimetry Equipment industry, offering invaluable insights for industry professionals, investors, and strategic decision-makers. Covering the period from 2019 to 2033, with a focus on the 2025-2033 forecast, this report unravels market dynamics, technological advancements, and future growth potential. The analysis includes key players such as Tracerco Limited, SE International Inc, Fuji Electric Co Ltd, Thermo Fisher Scientific Inc, Automess - Automation and Measurement GmbH, Fortive Corporation, ATOMTEX, Mirion Technologies Inc, Radiation Detection Company Inc, and Arrow-Tech Inc. Expect detailed segmentation by end-user industry (Healthcare, Oil and Gas, Mining, Nuclear Plants, Industrial, Manufacturing, Other), type (Electronic Personal Dosimeter (EPD), Thermo Luminescent Dosimeter (TLD), Optically Stimulated Luminescence Dosimeters (OSL), Film Badge Dosimeter, Other), and application (Active, Passive).
Dosimetry Equipment Industry Market Structure & Innovation Trends
The Dosimetry Equipment market exhibits a moderately consolidated structure with several key players holding significant market share. While precise market share figures for each company are unavailable (xx%), the industry is characterized by both established players and emerging innovators. Mergers and acquisitions (M&A) activity has been relatively modest in recent years, with deal values totaling approximately $xx Million over the past five years. This suggests a stable yet competitive landscape. Innovation is driven primarily by the need for improved accuracy, reduced size and weight, and enhanced user-friendliness in dosimeters. Regulatory frameworks, particularly those related to radiation safety and worker protection, significantly influence market dynamics and product development. Product substitutes are limited, with the primary alternatives being older, less accurate dosimetry technologies. End-user demographics are diverse, spanning across various industries with varying levels of radiation exposure risk.
Dosimetry Equipment Industry Market Dynamics & Trends
The Dosimetry Equipment market is experiencing steady growth, with a Compound Annual Growth Rate (CAGR) of xx% projected from 2025 to 2033. This growth is primarily fueled by increasing awareness of radiation safety, stringent regulatory requirements across multiple industries, and rising demand from expanding end-user sectors like healthcare and nuclear power. Technological advancements, such as the development of more sensitive and accurate dosimeters using OSL and EPD technologies, are disrupting the market, leading to higher market penetration for newer technologies. Consumer preference is shifting towards smaller, more user-friendly, and more precise dosimeters. Competitive dynamics are characterized by ongoing innovation, strategic partnerships, and a focus on enhancing product features to gain a competitive edge. Market penetration of advanced dosimetry technologies is increasing gradually but steadily, surpassing xx% by 2033.
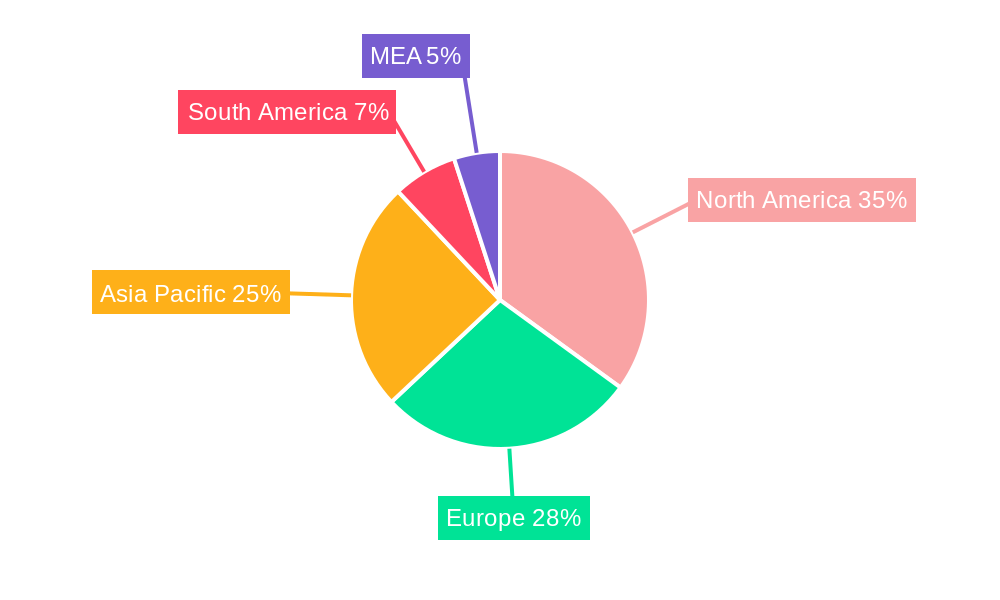
Dominant Regions & Segments in Dosimetry Equipment Industry
The North American region currently holds the largest market share in the Dosimetry Equipment industry, driven by a robust healthcare sector and stringent radiation safety regulations. Within the segments:
- By End-user Industry: The healthcare sector leads due to the widespread use of radiation in medical treatments and diagnostics. The nuclear power industry also holds a significant market share.
- By Type: Electronic Personal Dosimeters (EPDs) are experiencing rapid growth due to their ease of use and real-time data capabilities. OSL dosimeters are also gaining traction due to their high accuracy and reusability.
- By Application: Active dosimeters are preferred in environments with higher radiation levels due to their capability for real-time monitoring.
Key drivers for regional dominance include well-established healthcare infrastructure, robust nuclear power industries, and supportive government policies in these regions. Europe follows closely behind North America.
Dosimetry Equipment Industry Product Innovations
Recent years have witnessed significant advancements in dosimetry technology. Miniaturization of devices, improved accuracy, and the integration of advanced data processing capabilities are key trends. The development of wireless communication features allows for remote monitoring and improved data management. New materials and fabrication techniques are enhancing the durability and longevity of dosimeters. These innovations address growing market needs for precise, reliable, and convenient radiation monitoring solutions.
Report Scope & Segmentation Analysis
This report offers a detailed segmentation analysis of the Dosimetry Equipment market across several parameters.
- By End-user Industry: Each industry segment exhibits unique growth projections driven by specific radiation safety needs and regulatory frameworks. Market sizes vary significantly across these segments, with Healthcare and Nuclear Plants holding the largest shares.
- By Type: Growth projections differ across dosimeter types, reflecting the adoption rate of newer technologies like EPDs and OSLs. Competitive dynamics are shaped by the varying performance characteristics and cost-effectiveness of each technology.
- By Application: Active and Passive dosimeters cater to different monitoring needs, leading to distinct growth trajectories within each application segment.
Key Drivers of Dosimetry Equipment Industry Growth
Several factors contribute to the growth of the dosimetry equipment industry. Stringent government regulations regarding radiation safety across various sectors necessitate the use of dosimeters. The expanding healthcare sector, with its increasing reliance on radiation-based technologies, drives demand for advanced dosimeters. Furthermore, technological advancements leading to improved accuracy, portability, and data management capabilities stimulate market growth.
Challenges in the Dosimetry Equipment Industry Sector
The industry faces challenges such as the high cost of advanced dosimeters, particularly for smaller companies or those in developing countries. Supply chain disruptions can affect the availability of components, impacting production timelines and costs. Intense competition and the need for continuous innovation pose additional hurdles. Regulatory changes and compliance requirements can also significantly impact market dynamics.
Emerging Opportunities in Dosimetry Equipment Industry
Emerging opportunities lie in the development of more sophisticated dosimeters capable of detecting multiple radiation types simultaneously. The growing interest in space exploration creates demand for specialized dosimeters capable of withstanding extreme conditions. Furthermore, the integration of Artificial Intelligence (AI) and machine learning for data analysis and predictive modeling opens up new avenues for growth.
Leading Players in the Dosimetry Equipment Industry Market
- Tracerco Limited
- SE International Inc
- Fuji Electric Co Ltd
- Thermo Fisher Scientific Inc
- Automess - Automation and Measurement GmbH
- Fortive Corporation
- ATOMTEX
- Mirion Technologies Inc
- Radiation Detection Company Inc
- Arrow-Tech Inc
Key Developments in Dosimetry Equipment Industry
- September 2022: Hungary's ELKH Center for Energy Research (CER) Space Research Division developed a new dosimeter for use in lunar colonies and space exploration, impacting the market with new technology focused on extreme environments.
- April 2022: The European Space Agency (ESA) utilized radiation detectors from the DOSIS 3D experiment for long-term radiation measurements on the ISS, showcasing the reliability and importance of long-term radiation monitoring.
Future Outlook for Dosimetry Equipment Industry Market
The future outlook for the Dosimetry Equipment industry is positive, driven by continuous technological advancements, stringent safety regulations, and the expanding applications of radiation across various sectors. The market is poised for significant growth, with substantial opportunities for innovation and market expansion in new applications and regions. Strategic partnerships and investments in research and development will play a crucial role in shaping the future landscape of this industry.
Dosimetry Equipment Industry Segmentation
-
1. Type
- 1.1. Electronic Personal Dosimeter (EPD)
- 1.2. Thermo Luminescent Dosimeter (TLD)
- 1.3. Optically Stimulated Luminescence Dosimeters (OSL)
- 1.4. Film Badge Dosimeter
- 1.5. Other Types
-
2. Application
- 2.1. Active
- 2.2. Passive
-
3. End-user Industry
- 3.1. Healthcare
- 3.2. Oil and Gas
- 3.3. Mining
- 3.4. Nuclear Plants
- 3.5. Industrial
- 3.6. Manufacturing
- 3.7. Other End-user Industries
Dosimetry Equipment Industry Segmentation By Geography
- 1. North America
- 2. Europe
- 3. Asia
- 4. Australia and New Zealand
- 5. Latin America
- 6. Middle East and Africa
Dosimetry Equipment Industry Regional Market Share
Geographic Coverage of Dosimetry Equipment Industry
Dosimetry Equipment Industry REPORT HIGHLIGHTS
| Aspects | Details |
|---|---|
| Study Period | 2020-2034 |
| Base Year | 2025 |
| Estimated Year | 2026 |
| Forecast Period | 2026-2034 |
| Historical Period | 2020-2025 |
| Growth Rate | CAGR of 7.11% from 2020-2034 |
| Segmentation |
|
Table of Contents
- 1. Introduction
- 1.1. Research Scope
- 1.2. Market Segmentation
- 1.3. Research Objective
- 1.4. Definitions and Assumptions
- 2. Executive Summary
- 2.1. Market Snapshot
- 3. Market Dynamics
- 3.1. Market Drivers
- 3.2. Market Restrains
- 3.3. Market Trends
- 3.4. Market Opportunities
- 4. Market Factor Analysis
- 4.1. Porters Five Forces
- 4.1.1. Bargaining Power of Suppliers
- 4.1.2. Bargaining Power of Buyers
- 4.1.3. Threat of New Entrants
- 4.1.4. Threat of Substitutes
- 4.1.5. Competitive Rivalry
- 4.2. PESTEL analysis
- 4.3. BCG Analysis
- 4.3.1. Stars (High Growth, High Market Share)
- 4.3.2. Cash Cows (Low Growth, High Market Share)
- 4.3.3. Question Mark (High Growth, Low Market Share)
- 4.3.4. Dogs (Low Growth, Low Market Share)
- 4.4. Ansoff Matrix Analysis
- 4.5. Supply Chain Analysis
- 4.6. Regulatory Landscape
- 4.7. Current Market Potential and Opportunity Assessment (TAM–SAM–SOM Framework)
- 4.8. PRI Analyst Note
- 4.1. Porters Five Forces
- 5. Market Analysis, Insights and Forecast 2021-2033
- 5.1. Market Analysis, Insights and Forecast - by Type
- 5.1.1. Electronic Personal Dosimeter (EPD)
- 5.1.2. Thermo Luminescent Dosimeter (TLD)
- 5.1.3. Optically Stimulated Luminescence Dosimeters (OSL)
- 5.1.4. Film Badge Dosimeter
- 5.1.5. Other Types
- 5.2. Market Analysis, Insights and Forecast - by Application
- 5.2.1. Active
- 5.2.2. Passive
- 5.3. Market Analysis, Insights and Forecast - by End-user Industry
- 5.3.1. Healthcare
- 5.3.2. Oil and Gas
- 5.3.3. Mining
- 5.3.4. Nuclear Plants
- 5.3.5. Industrial
- 5.3.6. Manufacturing
- 5.3.7. Other End-user Industries
- 5.4. Market Analysis, Insights and Forecast - by Region
- 5.4.1. North America
- 5.4.2. Europe
- 5.4.3. Asia
- 5.4.4. Australia and New Zealand
- 5.4.5. Latin America
- 5.4.6. Middle East and Africa
- 5.1. Market Analysis, Insights and Forecast - by Type
- 6. Global Dosimetry Equipment Industry Analysis, Insights and Forecast, 2021-2033
- 6.1. Market Analysis, Insights and Forecast - by Type
- 6.1.1. Electronic Personal Dosimeter (EPD)
- 6.1.2. Thermo Luminescent Dosimeter (TLD)
- 6.1.3. Optically Stimulated Luminescence Dosimeters (OSL)
- 6.1.4. Film Badge Dosimeter
- 6.1.5. Other Types
- 6.2. Market Analysis, Insights and Forecast - by Application
- 6.2.1. Active
- 6.2.2. Passive
- 6.3. Market Analysis, Insights and Forecast - by End-user Industry
- 6.3.1. Healthcare
- 6.3.2. Oil and Gas
- 6.3.3. Mining
- 6.3.4. Nuclear Plants
- 6.3.5. Industrial
- 6.3.6. Manufacturing
- 6.3.7. Other End-user Industries
- 6.1. Market Analysis, Insights and Forecast - by Type
- 7. North America Dosimetry Equipment Industry Analysis, Insights and Forecast, 2020-2032
- 7.1. Market Analysis, Insights and Forecast - by Type
- 7.1.1. Electronic Personal Dosimeter (EPD)
- 7.1.2. Thermo Luminescent Dosimeter (TLD)
- 7.1.3. Optically Stimulated Luminescence Dosimeters (OSL)
- 7.1.4. Film Badge Dosimeter
- 7.1.5. Other Types
- 7.2. Market Analysis, Insights and Forecast - by Application
- 7.2.1. Active
- 7.2.2. Passive
- 7.3. Market Analysis, Insights and Forecast - by End-user Industry
- 7.3.1. Healthcare
- 7.3.2. Oil and Gas
- 7.3.3. Mining
- 7.3.4. Nuclear Plants
- 7.3.5. Industrial
- 7.3.6. Manufacturing
- 7.3.7. Other End-user Industries
- 7.1. Market Analysis, Insights and Forecast - by Type
- 8. Europe Dosimetry Equipment Industry Analysis, Insights and Forecast, 2020-2032
- 8.1. Market Analysis, Insights and Forecast - by Type
- 8.1.1. Electronic Personal Dosimeter (EPD)
- 8.1.2. Thermo Luminescent Dosimeter (TLD)
- 8.1.3. Optically Stimulated Luminescence Dosimeters (OSL)
- 8.1.4. Film Badge Dosimeter
- 8.1.5. Other Types
- 8.2. Market Analysis, Insights and Forecast - by Application
- 8.2.1. Active
- 8.2.2. Passive
- 8.3. Market Analysis, Insights and Forecast - by End-user Industry
- 8.3.1. Healthcare
- 8.3.2. Oil and Gas
- 8.3.3. Mining
- 8.3.4. Nuclear Plants
- 8.3.5. Industrial
- 8.3.6. Manufacturing
- 8.3.7. Other End-user Industries
- 8.1. Market Analysis, Insights and Forecast - by Type
- 9. Asia Dosimetry Equipment Industry Analysis, Insights and Forecast, 2020-2032
- 9.1. Market Analysis, Insights and Forecast - by Type
- 9.1.1. Electronic Personal Dosimeter (EPD)
- 9.1.2. Thermo Luminescent Dosimeter (TLD)
- 9.1.3. Optically Stimulated Luminescence Dosimeters (OSL)
- 9.1.4. Film Badge Dosimeter
- 9.1.5. Other Types
- 9.2. Market Analysis, Insights and Forecast - by Application
- 9.2.1. Active
- 9.2.2. Passive
- 9.3. Market Analysis, Insights and Forecast - by End-user Industry
- 9.3.1. Healthcare
- 9.3.2. Oil and Gas
- 9.3.3. Mining
- 9.3.4. Nuclear Plants
- 9.3.5. Industrial
- 9.3.6. Manufacturing
- 9.3.7. Other End-user Industries
- 9.1. Market Analysis, Insights and Forecast - by Type
- 10. Australia and New Zealand Dosimetry Equipment Industry Analysis, Insights and Forecast, 2020-2032
- 10.1. Market Analysis, Insights and Forecast - by Type
- 10.1.1. Electronic Personal Dosimeter (EPD)
- 10.1.2. Thermo Luminescent Dosimeter (TLD)
- 10.1.3. Optically Stimulated Luminescence Dosimeters (OSL)
- 10.1.4. Film Badge Dosimeter
- 10.1.5. Other Types
- 10.2. Market Analysis, Insights and Forecast - by Application
- 10.2.1. Active
- 10.2.2. Passive
- 10.3. Market Analysis, Insights and Forecast - by End-user Industry
- 10.3.1. Healthcare
- 10.3.2. Oil and Gas
- 10.3.3. Mining
- 10.3.4. Nuclear Plants
- 10.3.5. Industrial
- 10.3.6. Manufacturing
- 10.3.7. Other End-user Industries
- 10.1. Market Analysis, Insights and Forecast - by Type
- 11. Latin America Dosimetry Equipment Industry Analysis, Insights and Forecast, 2020-2032
- 11.1. Market Analysis, Insights and Forecast - by Type
- 11.1.1. Electronic Personal Dosimeter (EPD)
- 11.1.2. Thermo Luminescent Dosimeter (TLD)
- 11.1.3. Optically Stimulated Luminescence Dosimeters (OSL)
- 11.1.4. Film Badge Dosimeter
- 11.1.5. Other Types
- 11.2. Market Analysis, Insights and Forecast - by Application
- 11.2.1. Active
- 11.2.2. Passive
- 11.3. Market Analysis, Insights and Forecast - by End-user Industry
- 11.3.1. Healthcare
- 11.3.2. Oil and Gas
- 11.3.3. Mining
- 11.3.4. Nuclear Plants
- 11.3.5. Industrial
- 11.3.6. Manufacturing
- 11.3.7. Other End-user Industries
- 11.1. Market Analysis, Insights and Forecast - by Type
- 12. Middle East and Africa Dosimetry Equipment Industry Analysis, Insights and Forecast, 2020-2032
- 12.1. Market Analysis, Insights and Forecast - by Type
- 12.1.1. Electronic Personal Dosimeter (EPD)
- 12.1.2. Thermo Luminescent Dosimeter (TLD)
- 12.1.3. Optically Stimulated Luminescence Dosimeters (OSL)
- 12.1.4. Film Badge Dosimeter
- 12.1.5. Other Types
- 12.2. Market Analysis, Insights and Forecast - by Application
- 12.2.1. Active
- 12.2.2. Passive
- 12.3. Market Analysis, Insights and Forecast - by End-user Industry
- 12.3.1. Healthcare
- 12.3.2. Oil and Gas
- 12.3.3. Mining
- 12.3.4. Nuclear Plants
- 12.3.5. Industrial
- 12.3.6. Manufacturing
- 12.3.7. Other End-user Industries
- 12.1. Market Analysis, Insights and Forecast - by Type
- 13. Competitive Analysis
- 13.1. Company Profiles
- 13.1.1 Tracerco Limited
- 13.1.1.1. Company Overview
- 13.1.1.2. Products
- 13.1.1.3. Company Financials
- 13.1.1.4. SWOT Analysis
- 13.1.2 SE International Inc
- 13.1.2.1. Company Overview
- 13.1.2.2. Products
- 13.1.2.3. Company Financials
- 13.1.2.4. SWOT Analysis
- 13.1.3 Fuji Electric Co Ltd
- 13.1.3.1. Company Overview
- 13.1.3.2. Products
- 13.1.3.3. Company Financials
- 13.1.3.4. SWOT Analysis
- 13.1.4 Thermo Fisher Scientific Inc
- 13.1.4.1. Company Overview
- 13.1.4.2. Products
- 13.1.4.3. Company Financials
- 13.1.4.4. SWOT Analysis
- 13.1.5 Automess - Automation and Measurement GmbH
- 13.1.5.1. Company Overview
- 13.1.5.2. Products
- 13.1.5.3. Company Financials
- 13.1.5.4. SWOT Analysis
- 13.1.6 Fortive Corporation
- 13.1.6.1. Company Overview
- 13.1.6.2. Products
- 13.1.6.3. Company Financials
- 13.1.6.4. SWOT Analysis
- 13.1.7 ATOMTEX
- 13.1.7.1. Company Overview
- 13.1.7.2. Products
- 13.1.7.3. Company Financials
- 13.1.7.4. SWOT Analysis
- 13.1.8 Mirion Technologies Inc
- 13.1.8.1. Company Overview
- 13.1.8.2. Products
- 13.1.8.3. Company Financials
- 13.1.8.4. SWOT Analysis
- 13.1.9 Radiation Detection Company Inc
- 13.1.9.1. Company Overview
- 13.1.9.2. Products
- 13.1.9.3. Company Financials
- 13.1.9.4. SWOT Analysis
- 13.1.10 Arrow-Tech Inc
- 13.1.10.1. Company Overview
- 13.1.10.2. Products
- 13.1.10.3. Company Financials
- 13.1.10.4. SWOT Analysis
- 13.1.1 Tracerco Limited
- 13.2. Market Entropy
- 13.2.1 Company's Key Areas Served
- 13.2.2 Recent Developments
- 13.3. Company Market Share Analysis 2025
- 13.3.1 Top 5 Companies Market Share Analysis
- 13.3.2 Top 3 Companies Market Share Analysis
- 13.4. List of Potential Customers
- 14. Research Methodology
List of Figures
- Figure 1: Global Dosimetry Equipment Industry Revenue Breakdown (Million, %) by Region 2025 & 2033
- Figure 2: Global Dosimetry Equipment Industry Volume Breakdown (K Unit, %) by Region 2025 & 2033
- Figure 3: North America Dosimetry Equipment Industry Revenue (Million), by Type 2025 & 2033
- Figure 4: North America Dosimetry Equipment Industry Volume (K Unit), by Type 2025 & 2033
- Figure 5: North America Dosimetry Equipment Industry Revenue Share (%), by Type 2025 & 2033
- Figure 6: North America Dosimetry Equipment Industry Volume Share (%), by Type 2025 & 2033
- Figure 7: North America Dosimetry Equipment Industry Revenue (Million), by Application 2025 & 2033
- Figure 8: North America Dosimetry Equipment Industry Volume (K Unit), by Application 2025 & 2033
- Figure 9: North America Dosimetry Equipment Industry Revenue Share (%), by Application 2025 & 2033
- Figure 10: North America Dosimetry Equipment Industry Volume Share (%), by Application 2025 & 2033
- Figure 11: North America Dosimetry Equipment Industry Revenue (Million), by End-user Industry 2025 & 2033
- Figure 12: North America Dosimetry Equipment Industry Volume (K Unit), by End-user Industry 2025 & 2033
- Figure 13: North America Dosimetry Equipment Industry Revenue Share (%), by End-user Industry 2025 & 2033
- Figure 14: North America Dosimetry Equipment Industry Volume Share (%), by End-user Industry 2025 & 2033
- Figure 15: North America Dosimetry Equipment Industry Revenue (Million), by Country 2025 & 2033
- Figure 16: North America Dosimetry Equipment Industry Volume (K Unit), by Country 2025 & 2033
- Figure 17: North America Dosimetry Equipment Industry Revenue Share (%), by Country 2025 & 2033
- Figure 18: North America Dosimetry Equipment Industry Volume Share (%), by Country 2025 & 2033
- Figure 19: Europe Dosimetry Equipment Industry Revenue (Million), by Type 2025 & 2033
- Figure 20: Europe Dosimetry Equipment Industry Volume (K Unit), by Type 2025 & 2033
- Figure 21: Europe Dosimetry Equipment Industry Revenue Share (%), by Type 2025 & 2033
- Figure 22: Europe Dosimetry Equipment Industry Volume Share (%), by Type 2025 & 2033
- Figure 23: Europe Dosimetry Equipment Industry Revenue (Million), by Application 2025 & 2033
- Figure 24: Europe Dosimetry Equipment Industry Volume (K Unit), by Application 2025 & 2033
- Figure 25: Europe Dosimetry Equipment Industry Revenue Share (%), by Application 2025 & 2033
- Figure 26: Europe Dosimetry Equipment Industry Volume Share (%), by Application 2025 & 2033
- Figure 27: Europe Dosimetry Equipment Industry Revenue (Million), by End-user Industry 2025 & 2033
- Figure 28: Europe Dosimetry Equipment Industry Volume (K Unit), by End-user Industry 2025 & 2033
- Figure 29: Europe Dosimetry Equipment Industry Revenue Share (%), by End-user Industry 2025 & 2033
- Figure 30: Europe Dosimetry Equipment Industry Volume Share (%), by End-user Industry 2025 & 2033
- Figure 31: Europe Dosimetry Equipment Industry Revenue (Million), by Country 2025 & 2033
- Figure 32: Europe Dosimetry Equipment Industry Volume (K Unit), by Country 2025 & 2033
- Figure 33: Europe Dosimetry Equipment Industry Revenue Share (%), by Country 2025 & 2033
- Figure 34: Europe Dosimetry Equipment Industry Volume Share (%), by Country 2025 & 2033
- Figure 35: Asia Dosimetry Equipment Industry Revenue (Million), by Type 2025 & 2033
- Figure 36: Asia Dosimetry Equipment Industry Volume (K Unit), by Type 2025 & 2033
- Figure 37: Asia Dosimetry Equipment Industry Revenue Share (%), by Type 2025 & 2033
- Figure 38: Asia Dosimetry Equipment Industry Volume Share (%), by Type 2025 & 2033
- Figure 39: Asia Dosimetry Equipment Industry Revenue (Million), by Application 2025 & 2033
- Figure 40: Asia Dosimetry Equipment Industry Volume (K Unit), by Application 2025 & 2033
- Figure 41: Asia Dosimetry Equipment Industry Revenue Share (%), by Application 2025 & 2033
- Figure 42: Asia Dosimetry Equipment Industry Volume Share (%), by Application 2025 & 2033
- Figure 43: Asia Dosimetry Equipment Industry Revenue (Million), by End-user Industry 2025 & 2033
- Figure 44: Asia Dosimetry Equipment Industry Volume (K Unit), by End-user Industry 2025 & 2033
- Figure 45: Asia Dosimetry Equipment Industry Revenue Share (%), by End-user Industry 2025 & 2033
- Figure 46: Asia Dosimetry Equipment Industry Volume Share (%), by End-user Industry 2025 & 2033
- Figure 47: Asia Dosimetry Equipment Industry Revenue (Million), by Country 2025 & 2033
- Figure 48: Asia Dosimetry Equipment Industry Volume (K Unit), by Country 2025 & 2033
- Figure 49: Asia Dosimetry Equipment Industry Revenue Share (%), by Country 2025 & 2033
- Figure 50: Asia Dosimetry Equipment Industry Volume Share (%), by Country 2025 & 2033
- Figure 51: Australia and New Zealand Dosimetry Equipment Industry Revenue (Million), by Type 2025 & 2033
- Figure 52: Australia and New Zealand Dosimetry Equipment Industry Volume (K Unit), by Type 2025 & 2033
- Figure 53: Australia and New Zealand Dosimetry Equipment Industry Revenue Share (%), by Type 2025 & 2033
- Figure 54: Australia and New Zealand Dosimetry Equipment Industry Volume Share (%), by Type 2025 & 2033
- Figure 55: Australia and New Zealand Dosimetry Equipment Industry Revenue (Million), by Application 2025 & 2033
- Figure 56: Australia and New Zealand Dosimetry Equipment Industry Volume (K Unit), by Application 2025 & 2033
- Figure 57: Australia and New Zealand Dosimetry Equipment Industry Revenue Share (%), by Application 2025 & 2033
- Figure 58: Australia and New Zealand Dosimetry Equipment Industry Volume Share (%), by Application 2025 & 2033
- Figure 59: Australia and New Zealand Dosimetry Equipment Industry Revenue (Million), by End-user Industry 2025 & 2033
- Figure 60: Australia and New Zealand Dosimetry Equipment Industry Volume (K Unit), by End-user Industry 2025 & 2033
- Figure 61: Australia and New Zealand Dosimetry Equipment Industry Revenue Share (%), by End-user Industry 2025 & 2033
- Figure 62: Australia and New Zealand Dosimetry Equipment Industry Volume Share (%), by End-user Industry 2025 & 2033
- Figure 63: Australia and New Zealand Dosimetry Equipment Industry Revenue (Million), by Country 2025 & 2033
- Figure 64: Australia and New Zealand Dosimetry Equipment Industry Volume (K Unit), by Country 2025 & 2033
- Figure 65: Australia and New Zealand Dosimetry Equipment Industry Revenue Share (%), by Country 2025 & 2033
- Figure 66: Australia and New Zealand Dosimetry Equipment Industry Volume Share (%), by Country 2025 & 2033
- Figure 67: Latin America Dosimetry Equipment Industry Revenue (Million), by Type 2025 & 2033
- Figure 68: Latin America Dosimetry Equipment Industry Volume (K Unit), by Type 2025 & 2033
- Figure 69: Latin America Dosimetry Equipment Industry Revenue Share (%), by Type 2025 & 2033
- Figure 70: Latin America Dosimetry Equipment Industry Volume Share (%), by Type 2025 & 2033
- Figure 71: Latin America Dosimetry Equipment Industry Revenue (Million), by Application 2025 & 2033
- Figure 72: Latin America Dosimetry Equipment Industry Volume (K Unit), by Application 2025 & 2033
- Figure 73: Latin America Dosimetry Equipment Industry Revenue Share (%), by Application 2025 & 2033
- Figure 74: Latin America Dosimetry Equipment Industry Volume Share (%), by Application 2025 & 2033
- Figure 75: Latin America Dosimetry Equipment Industry Revenue (Million), by End-user Industry 2025 & 2033
- Figure 76: Latin America Dosimetry Equipment Industry Volume (K Unit), by End-user Industry 2025 & 2033
- Figure 77: Latin America Dosimetry Equipment Industry Revenue Share (%), by End-user Industry 2025 & 2033
- Figure 78: Latin America Dosimetry Equipment Industry Volume Share (%), by End-user Industry 2025 & 2033
- Figure 79: Latin America Dosimetry Equipment Industry Revenue (Million), by Country 2025 & 2033
- Figure 80: Latin America Dosimetry Equipment Industry Volume (K Unit), by Country 2025 & 2033
- Figure 81: Latin America Dosimetry Equipment Industry Revenue Share (%), by Country 2025 & 2033
- Figure 82: Latin America Dosimetry Equipment Industry Volume Share (%), by Country 2025 & 2033
- Figure 83: Middle East and Africa Dosimetry Equipment Industry Revenue (Million), by Type 2025 & 2033
- Figure 84: Middle East and Africa Dosimetry Equipment Industry Volume (K Unit), by Type 2025 & 2033
- Figure 85: Middle East and Africa Dosimetry Equipment Industry Revenue Share (%), by Type 2025 & 2033
- Figure 86: Middle East and Africa Dosimetry Equipment Industry Volume Share (%), by Type 2025 & 2033
- Figure 87: Middle East and Africa Dosimetry Equipment Industry Revenue (Million), by Application 2025 & 2033
- Figure 88: Middle East and Africa Dosimetry Equipment Industry Volume (K Unit), by Application 2025 & 2033
- Figure 89: Middle East and Africa Dosimetry Equipment Industry Revenue Share (%), by Application 2025 & 2033
- Figure 90: Middle East and Africa Dosimetry Equipment Industry Volume Share (%), by Application 2025 & 2033
- Figure 91: Middle East and Africa Dosimetry Equipment Industry Revenue (Million), by End-user Industry 2025 & 2033
- Figure 92: Middle East and Africa Dosimetry Equipment Industry Volume (K Unit), by End-user Industry 2025 & 2033
- Figure 93: Middle East and Africa Dosimetry Equipment Industry Revenue Share (%), by End-user Industry 2025 & 2033
- Figure 94: Middle East and Africa Dosimetry Equipment Industry Volume Share (%), by End-user Industry 2025 & 2033
- Figure 95: Middle East and Africa Dosimetry Equipment Industry Revenue (Million), by Country 2025 & 2033
- Figure 96: Middle East and Africa Dosimetry Equipment Industry Volume (K Unit), by Country 2025 & 2033
- Figure 97: Middle East and Africa Dosimetry Equipment Industry Revenue Share (%), by Country 2025 & 2033
- Figure 98: Middle East and Africa Dosimetry Equipment Industry Volume Share (%), by Country 2025 & 2033
List of Tables
- Table 1: Global Dosimetry Equipment Industry Revenue Million Forecast, by Type 2020 & 2033
- Table 2: Global Dosimetry Equipment Industry Volume K Unit Forecast, by Type 2020 & 2033
- Table 3: Global Dosimetry Equipment Industry Revenue Million Forecast, by Application 2020 & 2033
- Table 4: Global Dosimetry Equipment Industry Volume K Unit Forecast, by Application 2020 & 2033
- Table 5: Global Dosimetry Equipment Industry Revenue Million Forecast, by End-user Industry 2020 & 2033
- Table 6: Global Dosimetry Equipment Industry Volume K Unit Forecast, by End-user Industry 2020 & 2033
- Table 7: Global Dosimetry Equipment Industry Revenue Million Forecast, by Region 2020 & 2033
- Table 8: Global Dosimetry Equipment Industry Volume K Unit Forecast, by Region 2020 & 2033
- Table 9: Global Dosimetry Equipment Industry Revenue Million Forecast, by Type 2020 & 2033
- Table 10: Global Dosimetry Equipment Industry Volume K Unit Forecast, by Type 2020 & 2033
- Table 11: Global Dosimetry Equipment Industry Revenue Million Forecast, by Application 2020 & 2033
- Table 12: Global Dosimetry Equipment Industry Volume K Unit Forecast, by Application 2020 & 2033
- Table 13: Global Dosimetry Equipment Industry Revenue Million Forecast, by End-user Industry 2020 & 2033
- Table 14: Global Dosimetry Equipment Industry Volume K Unit Forecast, by End-user Industry 2020 & 2033
- Table 15: Global Dosimetry Equipment Industry Revenue Million Forecast, by Country 2020 & 2033
- Table 16: Global Dosimetry Equipment Industry Volume K Unit Forecast, by Country 2020 & 2033
- Table 17: Global Dosimetry Equipment Industry Revenue Million Forecast, by Type 2020 & 2033
- Table 18: Global Dosimetry Equipment Industry Volume K Unit Forecast, by Type 2020 & 2033
- Table 19: Global Dosimetry Equipment Industry Revenue Million Forecast, by Application 2020 & 2033
- Table 20: Global Dosimetry Equipment Industry Volume K Unit Forecast, by Application 2020 & 2033
- Table 21: Global Dosimetry Equipment Industry Revenue Million Forecast, by End-user Industry 2020 & 2033
- Table 22: Global Dosimetry Equipment Industry Volume K Unit Forecast, by End-user Industry 2020 & 2033
- Table 23: Global Dosimetry Equipment Industry Revenue Million Forecast, by Country 2020 & 2033
- Table 24: Global Dosimetry Equipment Industry Volume K Unit Forecast, by Country 2020 & 2033
- Table 25: Global Dosimetry Equipment Industry Revenue Million Forecast, by Type 2020 & 2033
- Table 26: Global Dosimetry Equipment Industry Volume K Unit Forecast, by Type 2020 & 2033
- Table 27: Global Dosimetry Equipment Industry Revenue Million Forecast, by Application 2020 & 2033
- Table 28: Global Dosimetry Equipment Industry Volume K Unit Forecast, by Application 2020 & 2033
- Table 29: Global Dosimetry Equipment Industry Revenue Million Forecast, by End-user Industry 2020 & 2033
- Table 30: Global Dosimetry Equipment Industry Volume K Unit Forecast, by End-user Industry 2020 & 2033
- Table 31: Global Dosimetry Equipment Industry Revenue Million Forecast, by Country 2020 & 2033
- Table 32: Global Dosimetry Equipment Industry Volume K Unit Forecast, by Country 2020 & 2033
- Table 33: Global Dosimetry Equipment Industry Revenue Million Forecast, by Type 2020 & 2033
- Table 34: Global Dosimetry Equipment Industry Volume K Unit Forecast, by Type 2020 & 2033
- Table 35: Global Dosimetry Equipment Industry Revenue Million Forecast, by Application 2020 & 2033
- Table 36: Global Dosimetry Equipment Industry Volume K Unit Forecast, by Application 2020 & 2033
- Table 37: Global Dosimetry Equipment Industry Revenue Million Forecast, by End-user Industry 2020 & 2033
- Table 38: Global Dosimetry Equipment Industry Volume K Unit Forecast, by End-user Industry 2020 & 2033
- Table 39: Global Dosimetry Equipment Industry Revenue Million Forecast, by Country 2020 & 2033
- Table 40: Global Dosimetry Equipment Industry Volume K Unit Forecast, by Country 2020 & 2033
- Table 41: Global Dosimetry Equipment Industry Revenue Million Forecast, by Type 2020 & 2033
- Table 42: Global Dosimetry Equipment Industry Volume K Unit Forecast, by Type 2020 & 2033
- Table 43: Global Dosimetry Equipment Industry Revenue Million Forecast, by Application 2020 & 2033
- Table 44: Global Dosimetry Equipment Industry Volume K Unit Forecast, by Application 2020 & 2033
- Table 45: Global Dosimetry Equipment Industry Revenue Million Forecast, by End-user Industry 2020 & 2033
- Table 46: Global Dosimetry Equipment Industry Volume K Unit Forecast, by End-user Industry 2020 & 2033
- Table 47: Global Dosimetry Equipment Industry Revenue Million Forecast, by Country 2020 & 2033
- Table 48: Global Dosimetry Equipment Industry Volume K Unit Forecast, by Country 2020 & 2033
- Table 49: Global Dosimetry Equipment Industry Revenue Million Forecast, by Type 2020 & 2033
- Table 50: Global Dosimetry Equipment Industry Volume K Unit Forecast, by Type 2020 & 2033
- Table 51: Global Dosimetry Equipment Industry Revenue Million Forecast, by Application 2020 & 2033
- Table 52: Global Dosimetry Equipment Industry Volume K Unit Forecast, by Application 2020 & 2033
- Table 53: Global Dosimetry Equipment Industry Revenue Million Forecast, by End-user Industry 2020 & 2033
- Table 54: Global Dosimetry Equipment Industry Volume K Unit Forecast, by End-user Industry 2020 & 2033
- Table 55: Global Dosimetry Equipment Industry Revenue Million Forecast, by Country 2020 & 2033
- Table 56: Global Dosimetry Equipment Industry Volume K Unit Forecast, by Country 2020 & 2033
Frequently Asked Questions
1. What is the projected Compound Annual Growth Rate (CAGR) of the Dosimetry Equipment Industry?
The projected CAGR is approximately 7.11%.
2. Which companies are prominent players in the Dosimetry Equipment Industry?
Key companies in the market include Tracerco Limited, SE International Inc, Fuji Electric Co Ltd, Thermo Fisher Scientific Inc, Automess - Automation and Measurement GmbH, Fortive Corporation, ATOMTEX, Mirion Technologies Inc, Radiation Detection Company Inc , Arrow-Tech Inc.
3. What are the main segments of the Dosimetry Equipment Industry?
The market segments include Type, Application, End-user Industry.
4. Can you provide details about the market size?
The market size is estimated to be USD 3.65 Million as of 2022.
5. What are some drivers contributing to market growth?
Growing Demand for Radiation and Monitoring Devices Across the Medical Sector; Rising Application of Radioactive Substances Across the Industrial Sector.
6. What are the notable trends driving market growth?
Rising Application of Radioactive Substances Across the Industrial Sector Drives the Market.
7. Are there any restraints impacting market growth?
Product Accuracy. Stringent Government Regulations. and High Costs.
8. Can you provide examples of recent developments in the market?
September 2022: Hungary's ELKH Center for Energy Research (CER) Space Research Division developed a dosimeter to assist in the construction of the initial US lunar colony. This dosimeter can also be utilized to investigate the initial flight of NASA's Artemis program. The project aims to provide crucial information on the cosmic radiation field for the development of human spacecraft, lunar orbiting satellite stations, and lunar outposts in the future.
9. What pricing options are available for accessing the report?
Pricing options include single-user, multi-user, and enterprise licenses priced at USD 4750, USD 5250, and USD 8750 respectively.
10. Is the market size provided in terms of value or volume?
The market size is provided in terms of value, measured in Million and volume, measured in K Unit.
11. Are there any specific market keywords associated with the report?
Yes, the market keyword associated with the report is "Dosimetry Equipment Industry," which aids in identifying and referencing the specific market segment covered.
12. How do I determine which pricing option suits my needs best?
The pricing options vary based on user requirements and access needs. Individual users may opt for single-user licenses, while businesses requiring broader access may choose multi-user or enterprise licenses for cost-effective access to the report.
13. Are there any additional resources or data provided in the Dosimetry Equipment Industry report?
While the report offers comprehensive insights, it's advisable to review the specific contents or supplementary materials provided to ascertain if additional resources or data are available.
14. How can I stay updated on further developments or reports in the Dosimetry Equipment Industry?
To stay informed about further developments, trends, and reports in the Dosimetry Equipment Industry, consider subscribing to industry newsletters, following relevant companies and organizations, or regularly checking reputable industry news sources and publications.
Methodology
Step 1 - Identification of Relevant Samples Size from Population Database


Step 2 - Approaches for Defining Global Market Size (Value, Volume* & Price*)

Note*: In applicable scenarios
Step 3 - Data Sources
Primary Research
- Web Analytics
- Survey Reports
- Research Institute
- Latest Research Reports
- Opinion Leaders
Secondary Research
- Annual Reports
- White Paper
- Latest Press Release
- Industry Association
- Paid Database
- Investor Presentations

Step 4 - Data Triangulation
Involves using different sources of information in order to increase the validity of a study
These sources are likely to be stakeholders in a program - participants, other researchers, program staff, other community members, and so on.
Then we put all data in single framework & apply various statistical tools to find out the dynamic on the market.
During the analysis stage, feedback from the stakeholder groups would be compared to determine areas of agreement as well as areas of divergence