Dosing System Industry XX CAGR Growth Analysis 2025-2033

Dosing System Industry by Type (Diaphragm Pump, Piston Pump, Other Types), by Application (Oil and Gas, Water and Sewage Treatment, Chemicals, Other Applications), by North America (United States, Canada, Rest of North America), by Europe (Germany, United Kingdom, France, Spain, Italy, Rest of Europe), by Asia Pacific (China, India, Japan, South Korea, Rest of Asia Pacific), by South America (Brazil, Argentina, Rest of South America), by Middle East and Africa (Saudi Arabia, United Arab Emirates, South Africa, Rest of Middle East and Africa) Forecast 2025-2033

Jul 25 2025
Base Year: 2024

180 Pages
Main Logo

Dosing System Industry XX CAGR Growth Analysis 2025-2033


Home
Industries
Energy & Power
sponsor image
sponsor image
sponsor image
sponsor image
sponsor image

Tailored for you

  • In-depth Analysis Tailored to Specified Regions or Segments
  • Company Profiles Customized to User Preferences
  • Comprehensive Insights Focused on Specific Segments or Regions
  • Customized Evaluation of Competitive Landscape to Meet Your Needs
  • Tailored Customization to Address Other Specific Requirements
Ask for customization


Key Insights

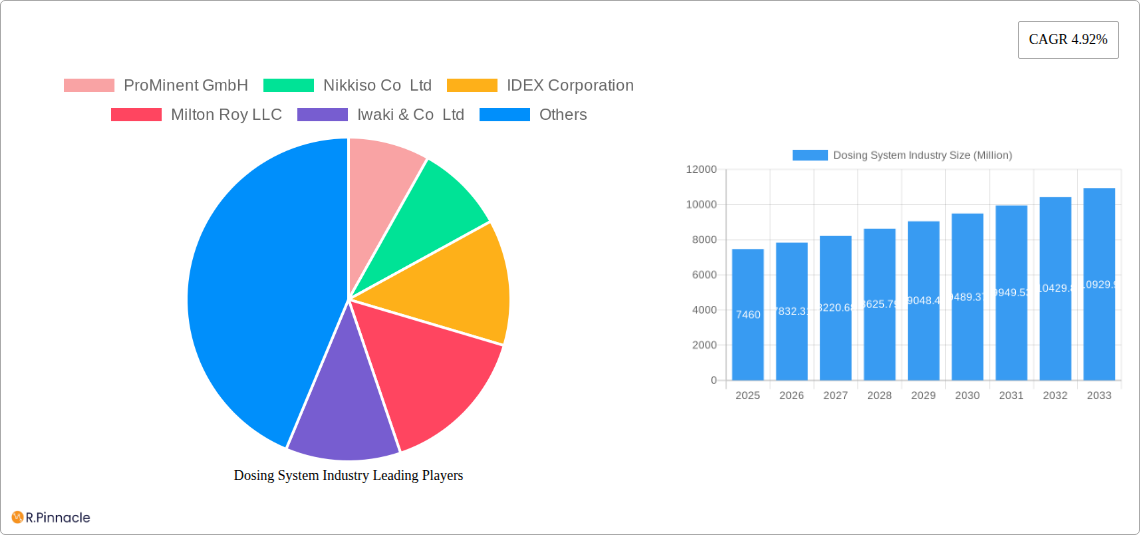
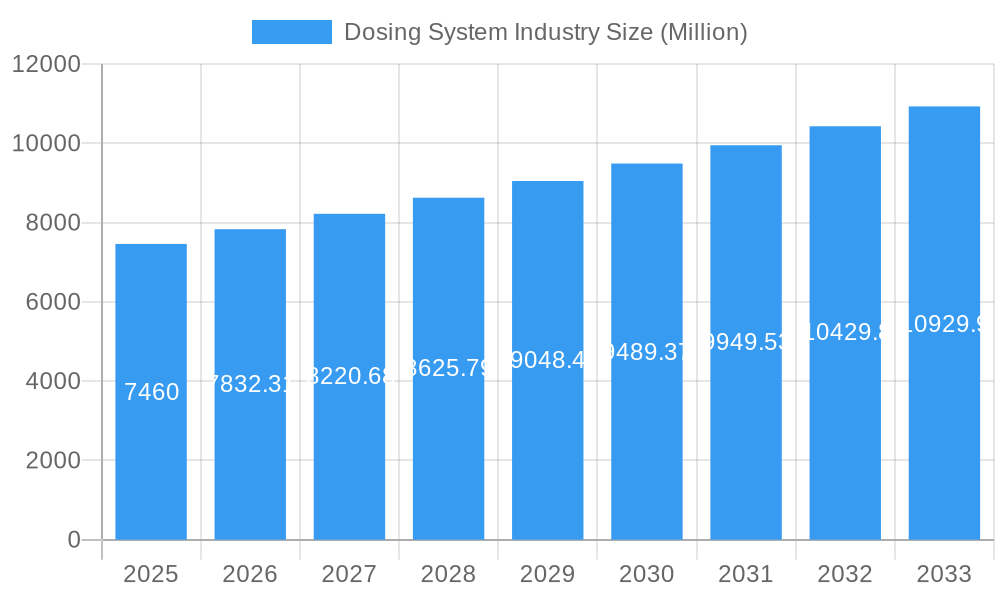
The global dosing system market, valued at $7.46 billion in 2025, is projected to experience robust growth, driven by increasing demand across various sectors. The Compound Annual Growth Rate (CAGR) of 4.92% from 2025 to 2033 indicates a significant expansion, primarily fueled by the rising adoption of automated and precise chemical dosing in industries like water and wastewater treatment, oil and gas extraction, and chemical processing. Stringent environmental regulations concerning effluent discharge and the growing need for efficient resource management are key catalysts for market growth. Furthermore, technological advancements leading to the development of more efficient and reliable dosing pumps (diaphragm, piston, and other types) are driving adoption. The market is segmented by pump type and application, with the oil and gas, and water and wastewater treatment sectors dominating current market share. However, emerging applications in other industries are expected to significantly contribute to future market expansion. Key players like ProMinent, Nikkiso, IDEX, and others are continually innovating and expanding their product portfolios to cater to the increasing demand and diverse application needs. Competitive strategies focused on product differentiation, technological advancements, and strategic partnerships will likely shape the industry landscape in the coming years.

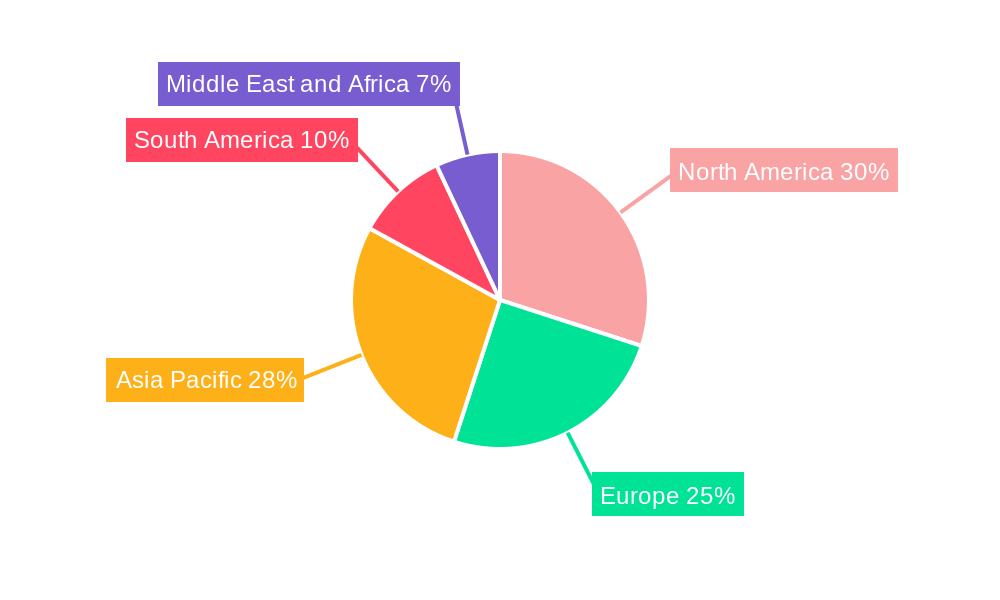
The regional distribution of the market reveals a strong presence across North America and Europe, reflecting the established infrastructure and stringent regulations in these regions. However, the Asia-Pacific region is expected to show the highest growth rate due to rapid industrialization and increasing infrastructure development. The Middle East and Africa region also presents a considerable opportunity, fueled by large-scale projects in oil and gas and water management. Future market dynamics will be influenced by factors such as raw material prices, technological breakthroughs in pump design and control systems, and global economic conditions. The continuous development of smart and connected dosing systems, integrating advanced monitoring and control capabilities, is expected to significantly influence the growth trajectory of this industry over the forecast period.

Dosing System Industry Research Report - Market Size, Growth & Forecast

Dosing System Industry Market Report: 2019-2033

This comprehensive report provides an in-depth analysis of the global dosing system industry, offering valuable insights for industry professionals, investors, and strategic decision-makers. The report covers the period 2019-2033, with a focus on the 2025-2033 forecast period. The market is valued at xx Million in 2025 and is projected to experience significant growth over the forecast period.

Dosing System Industry Market Structure & Innovation Trends

The global dosing system market is moderately concentrated, with key players such as ProMinent GmbH, Nikkiso Co Ltd, IDEX Corporation, Milton Roy LLC, Iwaki & Co Ltd, Grundfos Holding AS, Dover Corporation, SPX Flow Inc, Verder Ltd, and Watson-Marlow Fluid Technology Group holding significant market share. However, the market also accommodates several smaller, specialized players. Market share estimations suggest that the top 5 players collectively control approximately xx% of the market, while the remaining share is distributed across numerous competitors. Innovation in the sector is driven by increasing demand for precise and automated dosing solutions across diverse applications.

Regulatory frameworks, particularly those concerning environmental protection and safety standards for handling chemicals, significantly impact market dynamics. The industry is witnessing a rise in the adoption of smart technologies, including IoT-enabled monitoring and control systems. Product substitutes are limited, but advances in alternative technologies for fluid handling could pose a future challenge. Recent M&A activities, valued at approximately xx Million in the last 5 years, indicate a trend of consolidation within the industry. End-user demographics are diverse, spanning various industries with significant demand from water and wastewater treatment, oil and gas, and chemical processing sectors.

  • Key Market Metrics:
    • Top 5 players market share: xx%
    • Total M&A deal value (2019-2024): xx Million
Dosing System Industry Growth

Dosing System Industry Market Dynamics & Trends

The dosing system market is witnessing robust growth, driven by increasing industrial automation, stringent environmental regulations, and the growing need for precise chemical handling across various sectors. The market's compound annual growth rate (CAGR) during the historical period (2019-2024) was approximately xx%, and is projected to be xx% during the forecast period (2025-2033). This growth is primarily fuelled by the expanding chemical and pharmaceutical industries, coupled with rising investments in water and wastewater treatment infrastructure globally. Technological advancements, such as the incorporation of advanced sensors, smart controllers, and cloud-based monitoring systems, are reshaping the market landscape, enhancing efficiency, and improving operational reliability. Consumer preference is shifting towards sophisticated, automated systems that optimize dosing accuracy and reduce operational costs. The competitive dynamics are marked by both intense competition among established players and the emergence of innovative startups offering specialized solutions. Market penetration of smart dosing systems is currently at xx% and is expected to rise to xx% by 2033.

Dosing System Industry Growth

Dominant Regions & Segments in Dosing System Industry

The North American and European regions currently dominate the dosing system market, driven by robust industrial development and stringent environmental regulations. However, Asia-Pacific is expected to witness significant growth in the coming years, driven by expanding industrialization and rising investments in infrastructure projects.

  • Dominant Segments:

    • By Type: Diaphragm pumps currently hold the largest market share, followed by piston pumps and other types. Diaphragm pumps' dominance is attributed to their versatility and suitability for handling various fluids.
    • By Application: The water and sewage treatment segment is the most significant application area, followed by the chemical industry and oil and gas. This is driven by stringent environmental regulations and the rising demand for efficient water treatment solutions globally.
  • Key Drivers for Regional Dominance:

    • North America & Europe: Stringent environmental regulations, well-established industrial infrastructure, and high adoption of advanced technologies.
    • Asia-Pacific: Rapid industrialization, increasing investments in infrastructure development, and a growing demand for efficient chemical handling solutions.

Dosing System Industry Product Innovations

Recent years have witnessed significant product innovations in the dosing system industry, characterized by a strong focus on improving precision, automation, and ease of use. Manufacturers are increasingly integrating advanced technologies such as IoT connectivity, cloud-based data analytics, and predictive maintenance capabilities into their products. These innovations enhance system efficiency, reduce operational costs, and improve overall performance. The market is witnessing a shift toward modular and customizable dosing systems that cater to specific application needs and optimize overall system performance. This focus on customization allows manufacturers to address the diverse requirements of various industries, enhancing market fit and competitive advantage.

Report Scope & Segmentation Analysis

This report provides a comprehensive analysis of the dosing system market, segmented by type (Diaphragm Pump, Piston Pump, Other Types) and application (Oil and Gas, Water and Sewage Treatment, Chemicals, Other Applications). Each segment is analyzed in detail, considering market size, growth projections, and competitive dynamics. For instance, the diaphragm pump segment is projected to grow at a CAGR of xx% during the forecast period, driven by its versatility and wide range of applications. Similarly, the water and sewage treatment application segment is expected to witness substantial growth due to increasing investments in water infrastructure and stringent environmental regulations. The competitive landscape within each segment is characterized by both intense competition among established players and the emergence of niche players offering specialized solutions.

Key Drivers of Dosing System Industry Growth

Several factors are driving the growth of the dosing system industry. Technological advancements, such as the development of smart, connected dosing systems, are improving efficiency and accuracy. Stringent environmental regulations are pushing industries to adopt more precise chemical handling solutions to minimize waste and environmental impact. Furthermore, increasing industrial automation across various sectors is creating a high demand for reliable and efficient dosing systems to manage and control chemical processes. The rising investments in water treatment infrastructure globally and growing demand in emerging economies also significantly contribute to market expansion.

Challenges in the Dosing System Industry Sector

The dosing system industry faces challenges such as fluctuating raw material prices impacting manufacturing costs, and potential supply chain disruptions. Furthermore, stringent regulatory compliance requirements in various regions add complexity to manufacturing and distribution processes, increasing operational costs. Intense competition among established players and the emergence of new entrants put pressure on pricing and profitability. The industry also needs to address the challenges of cybersecurity and data privacy concerning connected dosing systems. These challenges represent approximately xx% of the total industry concerns, hindering industry growth.

Emerging Opportunities in Dosing System Industry

The dosing system industry is witnessing several emerging opportunities. The rising adoption of smart and connected systems is opening new avenues for data-driven optimization and predictive maintenance. Expanding industrial automation across various sectors creates strong demand for sophisticated dosing solutions. Growing investments in water and wastewater treatment infrastructure in developing countries present significant expansion potential. Moreover, the development of eco-friendly and sustainable dosing systems aligns with growing environmental concerns and offers lucrative growth prospects.

Leading Players in the Dosing System Industry Market

  • ProMinent GmbH
  • Nikkiso Co Ltd
  • IDEX Corporation
  • Milton Roy LLC
  • Iwaki & Co Ltd
  • Grundfos Holding AS
  • Dover Corporation
  • SPX Flow Inc
  • Verder Ltd
  • Watson-Marlow Fluid Technology Group

Key Developments in Dosing System Industry Industry

  • Apr 2022: SEKO upgraded its WareDose warewash dosing pump systems with an integrated Wi-Fi hub, enabling 24/7 smartphone connectivity. This improved remote monitoring and control capabilities, enhancing system efficiency and reducing downtime.
  • Sept 2022: Verder Liquids launched the Verderflex Ds500 metering and dosing pump, designed to improve chemical dosing in municipal and industrial applications. This new product challenged traditional solutions, offering enhanced performance and reliability.

Future Outlook for Dosing System Industry Market

The future of the dosing system industry looks promising, driven by ongoing technological advancements, increasing automation across various sectors, and stringent environmental regulations. The rising demand for precise chemical handling and efficient water treatment solutions will continue to fuel market growth. The adoption of smart and connected systems will further enhance operational efficiency and create new opportunities for data-driven optimization. Strategic partnerships and collaborations between manufacturers and technology providers are expected to accelerate innovation and drive market expansion in the coming years. The market is poised for continued growth, with significant opportunities for companies that can offer innovative, efficient, and sustainable solutions.

Dosing System Industry Segmentation

  • 1. Type
    • 1.1. Diaphragm Pump
    • 1.2. Piston Pump
    • 1.3. Other Types
  • 2. Application
    • 2.1. Oil and Gas
    • 2.2. Water and Sewage Treatment
    • 2.3. Chemicals
    • 2.4. Other Applications

Dosing System Industry Segmentation By Geography

  • 1. North America
    • 1.1. United States
    • 1.2. Canada
    • 1.3. Rest of North America
  • 2. Europe
    • 2.1. Germany
    • 2.2. United Kingdom
    • 2.3. France
    • 2.4. Spain
    • 2.5. Italy
    • 2.6. Rest of Europe
  • 3. Asia Pacific
    • 3.1. China
    • 3.2. India
    • 3.3. Japan
    • 3.4. South Korea
    • 3.5. Rest of Asia Pacific
  • 4. South America
    • 4.1. Brazil
    • 4.2. Argentina
    • 4.3. Rest of South America
  • 5. Middle East and Africa
    • 5.1. Saudi Arabia
    • 5.2. United Arab Emirates
    • 5.3. South Africa
    • 5.4. Rest of Middle East and Africa
Dosing System Industry Regional Share


Dosing System Industry REPORT HIGHLIGHTS

AspectsDetails
Study Period 2019-2033
Base Year 2024
Estimated Year 2025
Forecast Period2025-2033
Historical Period2019-2024
Growth RateCAGR of 4.92% from 2019-2033
Segmentation
    • By Type
      • Diaphragm Pump
      • Piston Pump
      • Other Types
    • By Application
      • Oil and Gas
      • Water and Sewage Treatment
      • Chemicals
      • Other Applications
  • By Geography
    • North America
      • United States
      • Canada
      • Rest of North America
    • Europe
      • Germany
      • United Kingdom
      • France
      • Spain
      • Italy
      • Rest of Europe
    • Asia Pacific
      • China
      • India
      • Japan
      • South Korea
      • Rest of Asia Pacific
    • South America
      • Brazil
      • Argentina
      • Rest of South America
    • Middle East and Africa
      • Saudi Arabia
      • United Arab Emirates
      • South Africa
      • Rest of Middle East and Africa


Table of Contents

  1. 1. Introduction
    • 1.1. Research Scope
    • 1.2. Market Segmentation
    • 1.3. Research Methodology
    • 1.4. Definitions and Assumptions
  2. 2. Executive Summary
    • 2.1. Introduction
  3. 3. Market Dynamics
    • 3.1. Introduction
      • 3.2. Market Drivers
        • 3.2.1. 4.; Increasing Investments in Water Treatment by Developing Countries4.; Growing Demand for the Various End-Use Sectors
      • 3.3. Market Restrains
        • 3.3.1. 4.; Availability of Cheap and Alternative Pumps
      • 3.4. Market Trends
        • 3.4.1. Water and Sewage Treatment Sector to Dominate the Market
  4. 4. Market Factor Analysis
    • 4.1. Porters Five Forces
    • 4.2. Supply/Value Chain
    • 4.3. PESTEL analysis
    • 4.4. Market Entropy
    • 4.5. Patent/Trademark Analysis
  5. 5. Global Dosing System Industry Analysis, Insights and Forecast, 2019-2031
    • 5.1. Market Analysis, Insights and Forecast - by Type
      • 5.1.1. Diaphragm Pump
      • 5.1.2. Piston Pump
      • 5.1.3. Other Types
    • 5.2. Market Analysis, Insights and Forecast - by Application
      • 5.2.1. Oil and Gas
      • 5.2.2. Water and Sewage Treatment
      • 5.2.3. Chemicals
      • 5.2.4. Other Applications
    • 5.3. Market Analysis, Insights and Forecast - by Region
      • 5.3.1. North America
      • 5.3.2. Europe
      • 5.3.3. Asia Pacific
      • 5.3.4. South America
      • 5.3.5. Middle East and Africa
  6. 6. North America Dosing System Industry Analysis, Insights and Forecast, 2019-2031
    • 6.1. Market Analysis, Insights and Forecast - by Type
      • 6.1.1. Diaphragm Pump
      • 6.1.2. Piston Pump
      • 6.1.3. Other Types
    • 6.2. Market Analysis, Insights and Forecast - by Application
      • 6.2.1. Oil and Gas
      • 6.2.2. Water and Sewage Treatment
      • 6.2.3. Chemicals
      • 6.2.4. Other Applications
  7. 7. Europe Dosing System Industry Analysis, Insights and Forecast, 2019-2031
    • 7.1. Market Analysis, Insights and Forecast - by Type
      • 7.1.1. Diaphragm Pump
      • 7.1.2. Piston Pump
      • 7.1.3. Other Types
    • 7.2. Market Analysis, Insights and Forecast - by Application
      • 7.2.1. Oil and Gas
      • 7.2.2. Water and Sewage Treatment
      • 7.2.3. Chemicals
      • 7.2.4. Other Applications
  8. 8. Asia Pacific Dosing System Industry Analysis, Insights and Forecast, 2019-2031
    • 8.1. Market Analysis, Insights and Forecast - by Type
      • 8.1.1. Diaphragm Pump
      • 8.1.2. Piston Pump
      • 8.1.3. Other Types
    • 8.2. Market Analysis, Insights and Forecast - by Application
      • 8.2.1. Oil and Gas
      • 8.2.2. Water and Sewage Treatment
      • 8.2.3. Chemicals
      • 8.2.4. Other Applications
  9. 9. South America Dosing System Industry Analysis, Insights and Forecast, 2019-2031
    • 9.1. Market Analysis, Insights and Forecast - by Type
      • 9.1.1. Diaphragm Pump
      • 9.1.2. Piston Pump
      • 9.1.3. Other Types
    • 9.2. Market Analysis, Insights and Forecast - by Application
      • 9.2.1. Oil and Gas
      • 9.2.2. Water and Sewage Treatment
      • 9.2.3. Chemicals
      • 9.2.4. Other Applications
  10. 10. Middle East and Africa Dosing System Industry Analysis, Insights and Forecast, 2019-2031
    • 10.1. Market Analysis, Insights and Forecast - by Type
      • 10.1.1. Diaphragm Pump
      • 10.1.2. Piston Pump
      • 10.1.3. Other Types
    • 10.2. Market Analysis, Insights and Forecast - by Application
      • 10.2.1. Oil and Gas
      • 10.2.2. Water and Sewage Treatment
      • 10.2.3. Chemicals
      • 10.2.4. Other Applications
  11. 11. North America Dosing System Industry Analysis, Insights and Forecast, 2019-2031
      • 11.1. Market Analysis, Insights and Forecast - By Country/Sub-region
        • 11.1.1 United States
        • 11.1.2 Canada
        • 11.1.3 Rest of North America
  12. 12. Europe Dosing System Industry Analysis, Insights and Forecast, 2019-2031
      • 12.1. Market Analysis, Insights and Forecast - By Country/Sub-region
        • 12.1.1 Germany
        • 12.1.2 United Kingdom
        • 12.1.3 France
        • 12.1.4 Spain
        • 12.1.5 Italy
        • 12.1.6 Rest of Europe
  13. 13. Asia Pacific Dosing System Industry Analysis, Insights and Forecast, 2019-2031
      • 13.1. Market Analysis, Insights and Forecast - By Country/Sub-region
        • 13.1.1 China
        • 13.1.2 India
        • 13.1.3 Japan
        • 13.1.4 South Korea
        • 13.1.5 Rest of Asia Pacific
  14. 14. South America Dosing System Industry Analysis, Insights and Forecast, 2019-2031
      • 14.1. Market Analysis, Insights and Forecast - By Country/Sub-region
        • 14.1.1 Brazil
        • 14.1.2 Argentina
        • 14.1.3 Rest of South America
  15. 15. Middle East and Africa Dosing System Industry Analysis, Insights and Forecast, 2019-2031
      • 15.1. Market Analysis, Insights and Forecast - By Country/Sub-region
        • 15.1.1 Saudi Arabia
        • 15.1.2 United Arab Emirates
        • 15.1.3 South Africa
        • 15.1.4 Rest of Middle East and Africa
  16. 16. Competitive Analysis
    • 16.1. Global Market Share Analysis 2024
      • 16.2. Company Profiles
        • 16.2.1 ProMinent GmbH
          • 16.2.1.1. Overview
          • 16.2.1.2. Products
          • 16.2.1.3. SWOT Analysis
          • 16.2.1.4. Recent Developments
          • 16.2.1.5. Financials (Based on Availability)
        • 16.2.2 Nikkiso Co Ltd
          • 16.2.2.1. Overview
          • 16.2.2.2. Products
          • 16.2.2.3. SWOT Analysis
          • 16.2.2.4. Recent Developments
          • 16.2.2.5. Financials (Based on Availability)
        • 16.2.3 IDEX Corporation
          • 16.2.3.1. Overview
          • 16.2.3.2. Products
          • 16.2.3.3. SWOT Analysis
          • 16.2.3.4. Recent Developments
          • 16.2.3.5. Financials (Based on Availability)
        • 16.2.4 Milton Roy LLC
          • 16.2.4.1. Overview
          • 16.2.4.2. Products
          • 16.2.4.3. SWOT Analysis
          • 16.2.4.4. Recent Developments
          • 16.2.4.5. Financials (Based on Availability)
        • 16.2.5 Iwaki & Co Ltd
          • 16.2.5.1. Overview
          • 16.2.5.2. Products
          • 16.2.5.3. SWOT Analysis
          • 16.2.5.4. Recent Developments
          • 16.2.5.5. Financials (Based on Availability)
        • 16.2.6 Grundfos Holding AS
          • 16.2.6.1. Overview
          • 16.2.6.2. Products
          • 16.2.6.3. SWOT Analysis
          • 16.2.6.4. Recent Developments
          • 16.2.6.5. Financials (Based on Availability)
        • 16.2.7 Dover Corporation
          • 16.2.7.1. Overview
          • 16.2.7.2. Products
          • 16.2.7.3. SWOT Analysis
          • 16.2.7.4. Recent Developments
          • 16.2.7.5. Financials (Based on Availability)
        • 16.2.8 SPX Flow Inc
          • 16.2.8.1. Overview
          • 16.2.8.2. Products
          • 16.2.8.3. SWOT Analysis
          • 16.2.8.4. Recent Developments
          • 16.2.8.5. Financials (Based on Availability)
        • 16.2.9 Verder Ltd*List Not Exhaustive
          • 16.2.9.1. Overview
          • 16.2.9.2. Products
          • 16.2.9.3. SWOT Analysis
          • 16.2.9.4. Recent Developments
          • 16.2.9.5. Financials (Based on Availability)
        • 16.2.10 Watson-Marlow Fluid Technology Group
          • 16.2.10.1. Overview
          • 16.2.10.2. Products
          • 16.2.10.3. SWOT Analysis
          • 16.2.10.4. Recent Developments
          • 16.2.10.5. Financials (Based on Availability)

List of Figures

  1. Figure 1: Global Dosing System Industry Revenue Breakdown (Million, %) by Region 2024 & 2032
  2. Figure 2: Global Dosing System Industry Volume Breakdown (K Tons, %) by Region 2024 & 2032
  3. Figure 3: North America Dosing System Industry Revenue (Million), by Country 2024 & 2032
  4. Figure 4: North America Dosing System Industry Volume (K Tons), by Country 2024 & 2032
  5. Figure 5: North America Dosing System Industry Revenue Share (%), by Country 2024 & 2032
  6. Figure 6: North America Dosing System Industry Volume Share (%), by Country 2024 & 2032
  7. Figure 7: Europe Dosing System Industry Revenue (Million), by Country 2024 & 2032
  8. Figure 8: Europe Dosing System Industry Volume (K Tons), by Country 2024 & 2032
  9. Figure 9: Europe Dosing System Industry Revenue Share (%), by Country 2024 & 2032
  10. Figure 10: Europe Dosing System Industry Volume Share (%), by Country 2024 & 2032
  11. Figure 11: Asia Pacific Dosing System Industry Revenue (Million), by Country 2024 & 2032
  12. Figure 12: Asia Pacific Dosing System Industry Volume (K Tons), by Country 2024 & 2032
  13. Figure 13: Asia Pacific Dosing System Industry Revenue Share (%), by Country 2024 & 2032
  14. Figure 14: Asia Pacific Dosing System Industry Volume Share (%), by Country 2024 & 2032
  15. Figure 15: South America Dosing System Industry Revenue (Million), by Country 2024 & 2032
  16. Figure 16: South America Dosing System Industry Volume (K Tons), by Country 2024 & 2032
  17. Figure 17: South America Dosing System Industry Revenue Share (%), by Country 2024 & 2032
  18. Figure 18: South America Dosing System Industry Volume Share (%), by Country 2024 & 2032
  19. Figure 19: Middle East and Africa Dosing System Industry Revenue (Million), by Country 2024 & 2032
  20. Figure 20: Middle East and Africa Dosing System Industry Volume (K Tons), by Country 2024 & 2032
  21. Figure 21: Middle East and Africa Dosing System Industry Revenue Share (%), by Country 2024 & 2032
  22. Figure 22: Middle East and Africa Dosing System Industry Volume Share (%), by Country 2024 & 2032
  23. Figure 23: North America Dosing System Industry Revenue (Million), by Type 2024 & 2032
  24. Figure 24: North America Dosing System Industry Volume (K Tons), by Type 2024 & 2032
  25. Figure 25: North America Dosing System Industry Revenue Share (%), by Type 2024 & 2032
  26. Figure 26: North America Dosing System Industry Volume Share (%), by Type 2024 & 2032
  27. Figure 27: North America Dosing System Industry Revenue (Million), by Application 2024 & 2032
  28. Figure 28: North America Dosing System Industry Volume (K Tons), by Application 2024 & 2032
  29. Figure 29: North America Dosing System Industry Revenue Share (%), by Application 2024 & 2032
  30. Figure 30: North America Dosing System Industry Volume Share (%), by Application 2024 & 2032
  31. Figure 31: North America Dosing System Industry Revenue (Million), by Country 2024 & 2032
  32. Figure 32: North America Dosing System Industry Volume (K Tons), by Country 2024 & 2032
  33. Figure 33: North America Dosing System Industry Revenue Share (%), by Country 2024 & 2032
  34. Figure 34: North America Dosing System Industry Volume Share (%), by Country 2024 & 2032
  35. Figure 35: Europe Dosing System Industry Revenue (Million), by Type 2024 & 2032
  36. Figure 36: Europe Dosing System Industry Volume (K Tons), by Type 2024 & 2032
  37. Figure 37: Europe Dosing System Industry Revenue Share (%), by Type 2024 & 2032
  38. Figure 38: Europe Dosing System Industry Volume Share (%), by Type 2024 & 2032
  39. Figure 39: Europe Dosing System Industry Revenue (Million), by Application 2024 & 2032
  40. Figure 40: Europe Dosing System Industry Volume (K Tons), by Application 2024 & 2032
  41. Figure 41: Europe Dosing System Industry Revenue Share (%), by Application 2024 & 2032
  42. Figure 42: Europe Dosing System Industry Volume Share (%), by Application 2024 & 2032
  43. Figure 43: Europe Dosing System Industry Revenue (Million), by Country 2024 & 2032
  44. Figure 44: Europe Dosing System Industry Volume (K Tons), by Country 2024 & 2032
  45. Figure 45: Europe Dosing System Industry Revenue Share (%), by Country 2024 & 2032
  46. Figure 46: Europe Dosing System Industry Volume Share (%), by Country 2024 & 2032
  47. Figure 47: Asia Pacific Dosing System Industry Revenue (Million), by Type 2024 & 2032
  48. Figure 48: Asia Pacific Dosing System Industry Volume (K Tons), by Type 2024 & 2032
  49. Figure 49: Asia Pacific Dosing System Industry Revenue Share (%), by Type 2024 & 2032
  50. Figure 50: Asia Pacific Dosing System Industry Volume Share (%), by Type 2024 & 2032
  51. Figure 51: Asia Pacific Dosing System Industry Revenue (Million), by Application 2024 & 2032
  52. Figure 52: Asia Pacific Dosing System Industry Volume (K Tons), by Application 2024 & 2032
  53. Figure 53: Asia Pacific Dosing System Industry Revenue Share (%), by Application 2024 & 2032
  54. Figure 54: Asia Pacific Dosing System Industry Volume Share (%), by Application 2024 & 2032
  55. Figure 55: Asia Pacific Dosing System Industry Revenue (Million), by Country 2024 & 2032
  56. Figure 56: Asia Pacific Dosing System Industry Volume (K Tons), by Country 2024 & 2032
  57. Figure 57: Asia Pacific Dosing System Industry Revenue Share (%), by Country 2024 & 2032
  58. Figure 58: Asia Pacific Dosing System Industry Volume Share (%), by Country 2024 & 2032
  59. Figure 59: South America Dosing System Industry Revenue (Million), by Type 2024 & 2032
  60. Figure 60: South America Dosing System Industry Volume (K Tons), by Type 2024 & 2032
  61. Figure 61: South America Dosing System Industry Revenue Share (%), by Type 2024 & 2032
  62. Figure 62: South America Dosing System Industry Volume Share (%), by Type 2024 & 2032
  63. Figure 63: South America Dosing System Industry Revenue (Million), by Application 2024 & 2032
  64. Figure 64: South America Dosing System Industry Volume (K Tons), by Application 2024 & 2032
  65. Figure 65: South America Dosing System Industry Revenue Share (%), by Application 2024 & 2032
  66. Figure 66: South America Dosing System Industry Volume Share (%), by Application 2024 & 2032
  67. Figure 67: South America Dosing System Industry Revenue (Million), by Country 2024 & 2032
  68. Figure 68: South America Dosing System Industry Volume (K Tons), by Country 2024 & 2032
  69. Figure 69: South America Dosing System Industry Revenue Share (%), by Country 2024 & 2032
  70. Figure 70: South America Dosing System Industry Volume Share (%), by Country 2024 & 2032
  71. Figure 71: Middle East and Africa Dosing System Industry Revenue (Million), by Type 2024 & 2032
  72. Figure 72: Middle East and Africa Dosing System Industry Volume (K Tons), by Type 2024 & 2032
  73. Figure 73: Middle East and Africa Dosing System Industry Revenue Share (%), by Type 2024 & 2032
  74. Figure 74: Middle East and Africa Dosing System Industry Volume Share (%), by Type 2024 & 2032
  75. Figure 75: Middle East and Africa Dosing System Industry Revenue (Million), by Application 2024 & 2032
  76. Figure 76: Middle East and Africa Dosing System Industry Volume (K Tons), by Application 2024 & 2032
  77. Figure 77: Middle East and Africa Dosing System Industry Revenue Share (%), by Application 2024 & 2032
  78. Figure 78: Middle East and Africa Dosing System Industry Volume Share (%), by Application 2024 & 2032
  79. Figure 79: Middle East and Africa Dosing System Industry Revenue (Million), by Country 2024 & 2032
  80. Figure 80: Middle East and Africa Dosing System Industry Volume (K Tons), by Country 2024 & 2032
  81. Figure 81: Middle East and Africa Dosing System Industry Revenue Share (%), by Country 2024 & 2032
  82. Figure 82: Middle East and Africa Dosing System Industry Volume Share (%), by Country 2024 & 2032

List of Tables

  1. Table 1: Global Dosing System Industry Revenue Million Forecast, by Region 2019 & 2032
  2. Table 2: Global Dosing System Industry Volume K Tons Forecast, by Region 2019 & 2032
  3. Table 3: Global Dosing System Industry Revenue Million Forecast, by Type 2019 & 2032
  4. Table 4: Global Dosing System Industry Volume K Tons Forecast, by Type 2019 & 2032
  5. Table 5: Global Dosing System Industry Revenue Million Forecast, by Application 2019 & 2032
  6. Table 6: Global Dosing System Industry Volume K Tons Forecast, by Application 2019 & 2032
  7. Table 7: Global Dosing System Industry Revenue Million Forecast, by Region 2019 & 2032
  8. Table 8: Global Dosing System Industry Volume K Tons Forecast, by Region 2019 & 2032
  9. Table 9: Global Dosing System Industry Revenue Million Forecast, by Country 2019 & 2032
  10. Table 10: Global Dosing System Industry Volume K Tons Forecast, by Country 2019 & 2032
  11. Table 11: United States Dosing System Industry Revenue (Million) Forecast, by Application 2019 & 2032
  12. Table 12: United States Dosing System Industry Volume (K Tons) Forecast, by Application 2019 & 2032
  13. Table 13: Canada Dosing System Industry Revenue (Million) Forecast, by Application 2019 & 2032
  14. Table 14: Canada Dosing System Industry Volume (K Tons) Forecast, by Application 2019 & 2032
  15. Table 15: Rest of North America Dosing System Industry Revenue (Million) Forecast, by Application 2019 & 2032
  16. Table 16: Rest of North America Dosing System Industry Volume (K Tons) Forecast, by Application 2019 & 2032
  17. Table 17: Global Dosing System Industry Revenue Million Forecast, by Country 2019 & 2032
  18. Table 18: Global Dosing System Industry Volume K Tons Forecast, by Country 2019 & 2032
  19. Table 19: Germany Dosing System Industry Revenue (Million) Forecast, by Application 2019 & 2032
  20. Table 20: Germany Dosing System Industry Volume (K Tons) Forecast, by Application 2019 & 2032
  21. Table 21: United Kingdom Dosing System Industry Revenue (Million) Forecast, by Application 2019 & 2032
  22. Table 22: United Kingdom Dosing System Industry Volume (K Tons) Forecast, by Application 2019 & 2032
  23. Table 23: France Dosing System Industry Revenue (Million) Forecast, by Application 2019 & 2032
  24. Table 24: France Dosing System Industry Volume (K Tons) Forecast, by Application 2019 & 2032
  25. Table 25: Spain Dosing System Industry Revenue (Million) Forecast, by Application 2019 & 2032
  26. Table 26: Spain Dosing System Industry Volume (K Tons) Forecast, by Application 2019 & 2032
  27. Table 27: Italy Dosing System Industry Revenue (Million) Forecast, by Application 2019 & 2032
  28. Table 28: Italy Dosing System Industry Volume (K Tons) Forecast, by Application 2019 & 2032
  29. Table 29: Rest of Europe Dosing System Industry Revenue (Million) Forecast, by Application 2019 & 2032
  30. Table 30: Rest of Europe Dosing System Industry Volume (K Tons) Forecast, by Application 2019 & 2032
  31. Table 31: Global Dosing System Industry Revenue Million Forecast, by Country 2019 & 2032
  32. Table 32: Global Dosing System Industry Volume K Tons Forecast, by Country 2019 & 2032
  33. Table 33: China Dosing System Industry Revenue (Million) Forecast, by Application 2019 & 2032
  34. Table 34: China Dosing System Industry Volume (K Tons) Forecast, by Application 2019 & 2032
  35. Table 35: India Dosing System Industry Revenue (Million) Forecast, by Application 2019 & 2032
  36. Table 36: India Dosing System Industry Volume (K Tons) Forecast, by Application 2019 & 2032
  37. Table 37: Japan Dosing System Industry Revenue (Million) Forecast, by Application 2019 & 2032
  38. Table 38: Japan Dosing System Industry Volume (K Tons) Forecast, by Application 2019 & 2032
  39. Table 39: South Korea Dosing System Industry Revenue (Million) Forecast, by Application 2019 & 2032
  40. Table 40: South Korea Dosing System Industry Volume (K Tons) Forecast, by Application 2019 & 2032
  41. Table 41: Rest of Asia Pacific Dosing System Industry Revenue (Million) Forecast, by Application 2019 & 2032
  42. Table 42: Rest of Asia Pacific Dosing System Industry Volume (K Tons) Forecast, by Application 2019 & 2032
  43. Table 43: Global Dosing System Industry Revenue Million Forecast, by Country 2019 & 2032
  44. Table 44: Global Dosing System Industry Volume K Tons Forecast, by Country 2019 & 2032
  45. Table 45: Brazil Dosing System Industry Revenue (Million) Forecast, by Application 2019 & 2032
  46. Table 46: Brazil Dosing System Industry Volume (K Tons) Forecast, by Application 2019 & 2032
  47. Table 47: Argentina Dosing System Industry Revenue (Million) Forecast, by Application 2019 & 2032
  48. Table 48: Argentina Dosing System Industry Volume (K Tons) Forecast, by Application 2019 & 2032
  49. Table 49: Rest of South America Dosing System Industry Revenue (Million) Forecast, by Application 2019 & 2032
  50. Table 50: Rest of South America Dosing System Industry Volume (K Tons) Forecast, by Application 2019 & 2032
  51. Table 51: Global Dosing System Industry Revenue Million Forecast, by Country 2019 & 2032
  52. Table 52: Global Dosing System Industry Volume K Tons Forecast, by Country 2019 & 2032
  53. Table 53: Saudi Arabia Dosing System Industry Revenue (Million) Forecast, by Application 2019 & 2032
  54. Table 54: Saudi Arabia Dosing System Industry Volume (K Tons) Forecast, by Application 2019 & 2032
  55. Table 55: United Arab Emirates Dosing System Industry Revenue (Million) Forecast, by Application 2019 & 2032
  56. Table 56: United Arab Emirates Dosing System Industry Volume (K Tons) Forecast, by Application 2019 & 2032
  57. Table 57: South Africa Dosing System Industry Revenue (Million) Forecast, by Application 2019 & 2032
  58. Table 58: South Africa Dosing System Industry Volume (K Tons) Forecast, by Application 2019 & 2032
  59. Table 59: Rest of Middle East and Africa Dosing System Industry Revenue (Million) Forecast, by Application 2019 & 2032
  60. Table 60: Rest of Middle East and Africa Dosing System Industry Volume (K Tons) Forecast, by Application 2019 & 2032
  61. Table 61: Global Dosing System Industry Revenue Million Forecast, by Type 2019 & 2032
  62. Table 62: Global Dosing System Industry Volume K Tons Forecast, by Type 2019 & 2032
  63. Table 63: Global Dosing System Industry Revenue Million Forecast, by Application 2019 & 2032
  64. Table 64: Global Dosing System Industry Volume K Tons Forecast, by Application 2019 & 2032
  65. Table 65: Global Dosing System Industry Revenue Million Forecast, by Country 2019 & 2032
  66. Table 66: Global Dosing System Industry Volume K Tons Forecast, by Country 2019 & 2032
  67. Table 67: United States Dosing System Industry Revenue (Million) Forecast, by Application 2019 & 2032
  68. Table 68: United States Dosing System Industry Volume (K Tons) Forecast, by Application 2019 & 2032
  69. Table 69: Canada Dosing System Industry Revenue (Million) Forecast, by Application 2019 & 2032
  70. Table 70: Canada Dosing System Industry Volume (K Tons) Forecast, by Application 2019 & 2032
  71. Table 71: Rest of North America Dosing System Industry Revenue (Million) Forecast, by Application 2019 & 2032
  72. Table 72: Rest of North America Dosing System Industry Volume (K Tons) Forecast, by Application 2019 & 2032
  73. Table 73: Global Dosing System Industry Revenue Million Forecast, by Type 2019 & 2032
  74. Table 74: Global Dosing System Industry Volume K Tons Forecast, by Type 2019 & 2032
  75. Table 75: Global Dosing System Industry Revenue Million Forecast, by Application 2019 & 2032
  76. Table 76: Global Dosing System Industry Volume K Tons Forecast, by Application 2019 & 2032
  77. Table 77: Global Dosing System Industry Revenue Million Forecast, by Country 2019 & 2032
  78. Table 78: Global Dosing System Industry Volume K Tons Forecast, by Country 2019 & 2032
  79. Table 79: Germany Dosing System Industry Revenue (Million) Forecast, by Application 2019 & 2032
  80. Table 80: Germany Dosing System Industry Volume (K Tons) Forecast, by Application 2019 & 2032
  81. Table 81: United Kingdom Dosing System Industry Revenue (Million) Forecast, by Application 2019 & 2032
  82. Table 82: United Kingdom Dosing System Industry Volume (K Tons) Forecast, by Application 2019 & 2032
  83. Table 83: France Dosing System Industry Revenue (Million) Forecast, by Application 2019 & 2032
  84. Table 84: France Dosing System Industry Volume (K Tons) Forecast, by Application 2019 & 2032
  85. Table 85: Spain Dosing System Industry Revenue (Million) Forecast, by Application 2019 & 2032
  86. Table 86: Spain Dosing System Industry Volume (K Tons) Forecast, by Application 2019 & 2032
  87. Table 87: Italy Dosing System Industry Revenue (Million) Forecast, by Application 2019 & 2032
  88. Table 88: Italy Dosing System Industry Volume (K Tons) Forecast, by Application 2019 & 2032
  89. Table 89: Rest of Europe Dosing System Industry Revenue (Million) Forecast, by Application 2019 & 2032
  90. Table 90: Rest of Europe Dosing System Industry Volume (K Tons) Forecast, by Application 2019 & 2032
  91. Table 91: Global Dosing System Industry Revenue Million Forecast, by Type 2019 & 2032
  92. Table 92: Global Dosing System Industry Volume K Tons Forecast, by Type 2019 & 2032
  93. Table 93: Global Dosing System Industry Revenue Million Forecast, by Application 2019 & 2032
  94. Table 94: Global Dosing System Industry Volume K Tons Forecast, by Application 2019 & 2032
  95. Table 95: Global Dosing System Industry Revenue Million Forecast, by Country 2019 & 2032
  96. Table 96: Global Dosing System Industry Volume K Tons Forecast, by Country 2019 & 2032
  97. Table 97: China Dosing System Industry Revenue (Million) Forecast, by Application 2019 & 2032
  98. Table 98: China Dosing System Industry Volume (K Tons) Forecast, by Application 2019 & 2032
  99. Table 99: India Dosing System Industry Revenue (Million) Forecast, by Application 2019 & 2032
  100. Table 100: India Dosing System Industry Volume (K Tons) Forecast, by Application 2019 & 2032
  101. Table 101: Japan Dosing System Industry Revenue (Million) Forecast, by Application 2019 & 2032
  102. Table 102: Japan Dosing System Industry Volume (K Tons) Forecast, by Application 2019 & 2032
  103. Table 103: South Korea Dosing System Industry Revenue (Million) Forecast, by Application 2019 & 2032
  104. Table 104: South Korea Dosing System Industry Volume (K Tons) Forecast, by Application 2019 & 2032
  105. Table 105: Rest of Asia Pacific Dosing System Industry Revenue (Million) Forecast, by Application 2019 & 2032
  106. Table 106: Rest of Asia Pacific Dosing System Industry Volume (K Tons) Forecast, by Application 2019 & 2032
  107. Table 107: Global Dosing System Industry Revenue Million Forecast, by Type 2019 & 2032
  108. Table 108: Global Dosing System Industry Volume K Tons Forecast, by Type 2019 & 2032
  109. Table 109: Global Dosing System Industry Revenue Million Forecast, by Application 2019 & 2032
  110. Table 110: Global Dosing System Industry Volume K Tons Forecast, by Application 2019 & 2032
  111. Table 111: Global Dosing System Industry Revenue Million Forecast, by Country 2019 & 2032
  112. Table 112: Global Dosing System Industry Volume K Tons Forecast, by Country 2019 & 2032
  113. Table 113: Brazil Dosing System Industry Revenue (Million) Forecast, by Application 2019 & 2032
  114. Table 114: Brazil Dosing System Industry Volume (K Tons) Forecast, by Application 2019 & 2032
  115. Table 115: Argentina Dosing System Industry Revenue (Million) Forecast, by Application 2019 & 2032
  116. Table 116: Argentina Dosing System Industry Volume (K Tons) Forecast, by Application 2019 & 2032
  117. Table 117: Rest of South America Dosing System Industry Revenue (Million) Forecast, by Application 2019 & 2032
  118. Table 118: Rest of South America Dosing System Industry Volume (K Tons) Forecast, by Application 2019 & 2032
  119. Table 119: Global Dosing System Industry Revenue Million Forecast, by Type 2019 & 2032
  120. Table 120: Global Dosing System Industry Volume K Tons Forecast, by Type 2019 & 2032
  121. Table 121: Global Dosing System Industry Revenue Million Forecast, by Application 2019 & 2032
  122. Table 122: Global Dosing System Industry Volume K Tons Forecast, by Application 2019 & 2032
  123. Table 123: Global Dosing System Industry Revenue Million Forecast, by Country 2019 & 2032
  124. Table 124: Global Dosing System Industry Volume K Tons Forecast, by Country 2019 & 2032
  125. Table 125: Saudi Arabia Dosing System Industry Revenue (Million) Forecast, by Application 2019 & 2032
  126. Table 126: Saudi Arabia Dosing System Industry Volume (K Tons) Forecast, by Application 2019 & 2032
  127. Table 127: United Arab Emirates Dosing System Industry Revenue (Million) Forecast, by Application 2019 & 2032
  128. Table 128: United Arab Emirates Dosing System Industry Volume (K Tons) Forecast, by Application 2019 & 2032
  129. Table 129: South Africa Dosing System Industry Revenue (Million) Forecast, by Application 2019 & 2032
  130. Table 130: South Africa Dosing System Industry Volume (K Tons) Forecast, by Application 2019 & 2032
  131. Table 131: Rest of Middle East and Africa Dosing System Industry Revenue (Million) Forecast, by Application 2019 & 2032
  132. Table 132: Rest of Middle East and Africa Dosing System Industry Volume (K Tons) Forecast, by Application 2019 & 2032


Frequently Asked Questions

1. What is the projected Compound Annual Growth Rate (CAGR) of the Dosing System Industry?

The projected CAGR is approximately 4.92%.

2. Which companies are prominent players in the Dosing System Industry?

Key companies in the market include ProMinent GmbH, Nikkiso Co Ltd, IDEX Corporation, Milton Roy LLC, Iwaki & Co Ltd, Grundfos Holding AS, Dover Corporation, SPX Flow Inc, Verder Ltd*List Not Exhaustive, Watson-Marlow Fluid Technology Group.

3. What are the main segments of the Dosing System Industry?

The market segments include Type, Application.

4. Can you provide details about the market size?

The market size is estimated to be USD 7460 Million as of 2022.

5. What are some drivers contributing to market growth?

4.; Increasing Investments in Water Treatment by Developing Countries4.; Growing Demand for the Various End-Use Sectors.

6. What are the notable trends driving market growth?

Water and Sewage Treatment Sector to Dominate the Market.

7. Are there any restraints impacting market growth?

4.; Availability of Cheap and Alternative Pumps.

8. Can you provide examples of recent developments in the market?

Apr 2022: SEKO, manufacturer of chemical dosing pumps and metering, announced the upgradation of its WareDose warewash dosing pump systems to include an integrated Wi-Fi hub, enabling operators to connect to their systems 24/7 via smartphone.

9. What pricing options are available for accessing the report?

Pricing options include single-user, multi-user, and enterprise licenses priced at USD 4750, USD 5250, and USD 8750 respectively.

10. Is the market size provided in terms of value or volume?

The market size is provided in terms of value, measured in Million and volume, measured in K Tons.

11. Are there any specific market keywords associated with the report?

Yes, the market keyword associated with the report is "Dosing System Industry," which aids in identifying and referencing the specific market segment covered.

12. How do I determine which pricing option suits my needs best?

The pricing options vary based on user requirements and access needs. Individual users may opt for single-user licenses, while businesses requiring broader access may choose multi-user or enterprise licenses for cost-effective access to the report.

13. Are there any additional resources or data provided in the Dosing System Industry report?

While the report offers comprehensive insights, it's advisable to review the specific contents or supplementary materials provided to ascertain if additional resources or data are available.

14. How can I stay updated on further developments or reports in the Dosing System Industry?

To stay informed about further developments, trends, and reports in the Dosing System Industry, consider subscribing to industry newsletters, following relevant companies and organizations, or regularly checking reputable industry news sources and publications.


Methodology

Step 1 - Identification of Relevant Samples Size from Population Database

Step Chart
Bar Chart
Method Chart

Step 2 - Approaches for Defining Global Market Size (Value, Volume* & Price*)

Approach Chart
Top-down and bottom-up approaches are used to validate the global market size and estimate the market size for manufactures, regional segments, product, and application.

Note*: In applicable scenarios

Step 3 - Data Sources

Primary Research

  • Web Analytics
  • Survey Reports
  • Research Institute
  • Latest Research Reports
  • Opinion Leaders

Secondary Research

  • Annual Reports
  • White Paper
  • Latest Press Release
  • Industry Association
  • Paid Database
  • Investor Presentations
Analyst Chart

Step 4 - Data Triangulation

Involves using different sources of information in order to increase the validity of a study

These sources are likely to be stakeholders in a program - participants, other researchers, program staff, other community members, and so on.

Then we put all data in single framework & apply various statistical tools to find out the dynamic on the market.

During the analysis stage, feedback from the stakeholder groups would be compared to determine areas of agreement as well as areas of divergence

Additionally, after gathering mixed and scattered data from a wide range of sources, data is triangulated and correlated to come up with estimated figures which are further validated through primary mediums or industry experts, opinion leaders.

About Report Pinnacle

Report Pinnacle provides top-tier market research, industry intelligence, and actionable insights for finance, technology, healthcare, and consumer sectors. Our reports empower you to make informed decisions and achieve business success.

Our expert team combines primary research, data analytics, and industry knowledge to deliver insights you can trust. We offer syndicated reports, custom research, and consulting services tailored to your unique business needs.

At Report Pinnacle, we are committed to quality, transparency, and client satisfaction. Every report is rigorously validated to ensure accuracy and relevance. Our global perspective and local expertise help you understand both broad trends and detailed market shifts.

Stay ahead with Report Pinnacle. Subscribe to our newsletter for the latest insights and research highlights, and follow us on social media for real-time updates.

Report Pinnacle – Your Partner for Reaching the Top in Market Intelligence.

artwork spiralartwork spiralRelated Reports
artwork underline

Growth Trajectories in Hydraulic Dosing Pump Market: Industry Outlook to 2033

Discover the latest insights on the booming hydraulic dosing pump market. This comprehensive analysis reveals a $5.58B market in 2025, projected to grow steadily through 2033, driven by oil & gas, water treatment, and chemical industries. Explore regional trends, key players like Grundfos and ProMinent, and understand future market potential.

September 2025
Base Year: 2024
No Of Pages: 180
Price: $4750

Middle-East and Africa Liner Hanger System Market 2025-2033 Trends and Competitor Dynamics: Unlocking Growth Opportunities

The Middle East & Africa Liner Hanger System market is booming, with a CAGR exceeding 4.30% to 2033. Driven by oil & gas exploration and production, this report analyzes market size, trends, key players (Baker Hughes, Schlumberger, etc.), and regional segmentation (Saudi Arabia, UAE, Nigeria). Discover growth opportunities in this dynamic sector.

September 2025
Base Year: 2024
No Of Pages: 234
Price: $4750

South Africa Diesel Generator Market Market Growth Fueled by CAGR to XXX Million by 2033

Discover the booming South African diesel generator market! This comprehensive analysis reveals key trends, drivers, and restraints, projecting robust growth through 2033. Learn about major players, regional insights, and investment opportunities in this crucial sector. Explore market size, CAGR, and segmentation data.

September 2025
Base Year: 2024
No Of Pages: 197
Price: $3800

Analyzing Consumer Behavior in Generator Sets Market Market

The global generator sets market is booming, with a CAGR exceeding 6.50% driven by rising electricity demand and unreliable grids. Explore market trends, segmentation (capacity, fuel, end-user), key players (Cummins, Generac, Caterpillar), and regional growth projections (Asia-Pacific leading) in our comprehensive market analysis.

September 2025
Base Year: 2024
No Of Pages: 234
Price: $4750

Strategic Analysis of Africa Diesel Generator Market Industry Opportunities

The booming Africa diesel generator market is projected to reach \$2.542 billion by 2033, driven by unreliable power grids and industrial growth. Explore market trends, key players (Cummins, Caterpillar, etc.), and regional breakdowns (Nigeria, South Africa) in this comprehensive analysis.

September 2025
Base Year: 2024
No Of Pages: 234
Price: $4750

Wind Power Gearbox Market Market’s Evolutionary Trends 2025-2033

The wind power gearbox market is booming, projected to reach over $40 billion by 2033, driven by renewable energy expansion and technological advancements. Explore market size, CAGR, key players, and regional trends in this comprehensive analysis.

September 2025
Base Year: 2024
No Of Pages: 234
Price: $4750

Key Drivers for India Lithium-ion Battery Market Market Growth: Projections 2025-2033

Discover the booming India lithium-ion battery market! This in-depth analysis reveals a $4.71B market in 2025, projected to grow at a 22.72% CAGR through 2033, driven by EVs and portable electronics. Learn about key players, trends, and future outlook.

September 2025
Base Year: 2024
No Of Pages: 197
Price: $3800

North Sea Region Oil & Gas Industry Unlocking Growth Potential: Analysis and Forecasts 2025-2033

Discover the latest trends and analysis of the North Sea oil and gas industry. This report forecasts robust growth through 2033, detailing market segmentation, key players (Equinor, Shell, BP), and regional breakdowns. Learn about the challenges and opportunities amidst the energy transition.

September 2025
Base Year: 2024
No Of Pages: 234
Price: $4750

Ecuador Wireline Logging Services Market Market Trends and Strategic Roadmap

Discover the growth potential of the Ecuador Wireline Logging Services Market, projected to reach $61.44 million by 2033 with a CAGR exceeding 2.62%. This detailed analysis covers market drivers, trends, restraints, and key players like Baker Hughes and Schlumberger. Learn about market segmentation by deployment type and explore future opportunities in this dynamic sector.

September 2025
Base Year: 2024
No Of Pages: 197
Price: $3800

Slovakia Solar Energy Industry Growth Forecast and Consumer Insights

Discover the booming Slovakian solar energy market! This in-depth analysis reveals key trends, drivers, and challenges for 2025-2033, including market size projections, major players, and segment breakdowns. Learn about the significant growth potential and investment opportunities in this dynamic sector.

September 2025
Base Year: 2024
No Of Pages: 197
Price: $3800

Asia-Pacific Centrifugal Compressor Market 2025-2033 Overview: Trends, Dynamics, and Growth Opportunities

The Asia-Pacific centrifugal compressor market is booming, with a CAGR exceeding 4.50% driven by energy demand and industrial growth in China, India, and other key nations. Explore market size, key players, trends, and future projections in this in-depth analysis.

September 2025
Base Year: 2024
No Of Pages: 234
Price: $4750

Consumer-Driven Trends in Peru Oil & Gas Downstream Industry Market

Discover the dynamic Peruvian oil & gas downstream market. This in-depth analysis reveals market size, CAGR, key drivers, restraints, and future projections (2025-2033) for refineries and petrochemical plants. Explore investment opportunities and market trends in Peru's evolving energy sector.

September 2025
Base Year: 2024
No Of Pages: 197
Price: $3800

Unlocking Insights for South America Hydropower Industry Growth Strategies

Discover the booming South American hydropower market! Our analysis reveals a CAGR exceeding 3.80%, driven by renewable energy initiatives and technological advancements. Learn about key players, market segmentation, and growth projections for Brazil, Argentina, Chile, and beyond. Invest in the future of clean energy.

September 2025
Base Year: 2024
No Of Pages: 234
Price: $4750

Growth Trajectories in Chile Solar Photovoltaic (PV) Market: Industry Outlook to 2033

Discover the booming Chilean solar PV market! This in-depth analysis reveals a market size of $800M in 2025, projected to grow at a CAGR exceeding 5% until 2033. Learn about key drivers, trends, restraints, and leading companies shaping this dynamic sector.

September 2025
Base Year: 2024
No Of Pages: 197
Price: $3800

Innovations Driving South Africa Rooftop Solar Industry Market 2025-2033

Discover the booming South African rooftop solar market! Learn about its impressive 8.04% CAGR, key drivers, restraints, and leading companies like Sunworx Solar and Solareff. Explore the market segmentation and forecast (2025-2033) for residential, commercial, and industrial applications. Invest in the future of clean energy in South Africa.

September 2025
Base Year: 2024
No Of Pages: 197
Price: $3800

Liner Hanger Industry Competitive Advantage: Trends and Opportunities to 2033

The global liner hanger market is booming, projected to exceed $3.8 billion by 2033, driven by rising oil & gas demand and technological advancements. Explore market trends, key players (Drill Quip, National Oilwell Varco, etc.), and regional insights in this comprehensive analysis.

September 2025
Base Year: 2024
No Of Pages: 234
Price: $4750

South Europe Battery Market Strategic Insights: Analysis 2025 and Forecasts 2033

Discover the booming South European battery market! This analysis reveals key trends, drivers, and restraints impacting growth through 2033, including detailed insights into lithium-ion, lead-acid, and flow battery segments across Italy, Greece, Portugal, and Spain. Explore market size projections, CAGR, and leading companies shaping this dynamic sector.

September 2025
Base Year: 2024
No Of Pages: 234
Price: $4750

Opportunities in Emerging Australia Battery Industry Industry Markets

Discover the booming Australian battery industry, projected to reach \$2.56 billion by 2033 with an 8.41% CAGR. This in-depth analysis covers market size, key drivers (EVs, renewables), leading companies, and future trends. Explore the segments of Li-ion, lead-acid, and applications across automotive, energy storage, and consumer electronics.

September 2025
Base Year: 2024
No Of Pages: 197
Price: $3800

Lead Acid Battery Scrap Market 2025 Market Trends and 2033 Forecasts: Exploring Growth Potential

Discover the booming Lead Acid Battery Scrap market! Explore its $18.4B valuation, 4.65% CAGR, key drivers, regional trends, and top players like Gravita and Exide. Learn about the future of lead-acid battery recycling and its impact on the EV and renewable energy sectors.

September 2025
Base Year: 2024
No Of Pages: 234
Price: $4750

South America Commercial Aircraft Aviation Fuel Market Competitive Strategies: Trends and Forecasts 2025-2033

Soaring demand! Discover the explosive growth of South America's commercial aircraft aviation fuel market, projected to exceed a 12% CAGR through 2033. Analyze market drivers, trends, and key players shaping this lucrative sector, including Brazil, Argentina, and Colombia. Explore the rise of sustainable aviation fuel and its impact.

September 2025
Base Year: 2024
No Of Pages: 234
Price: $4750

Asia-Pacific Coal Market Strategic Dynamics: Competitor Analysis 2025-2033

Discover the latest insights on the booming Asia-Pacific coal market. This comprehensive analysis reveals a CAGR exceeding 3%, driven by energy demand in China and India, yet facing constraints from environmental regulations. Explore market segmentation, key players, and future growth projections until 2033.

September 2025
Base Year: 2024
No Of Pages: 234
Price: $4750

Consumer Trends in Power Market in Japan Market 2025-2033

Discover the dynamic Japanese power market forecast to 2033, analyzing its 1.27% CAGR, key players (Tokyo Electric Power, Kansai Electric Power, etc.), growth drivers, and regional trends. Explore the shift towards renewables and the challenges impacting this vital sector.

September 2025
Base Year: 2024
No Of Pages: 197
Price: $3800

Air Quality Monitoring Device Market Strategic Insights: Analysis 2025 and Forecasts 2033

The Air Quality Monitoring Device market is booming, projected to reach \$5.08 billion by 2025, with a 5.79% CAGR. Driven by stricter regulations, technological advancements, and growing environmental concerns, this market offers lucrative opportunities across residential, commercial, and industrial sectors. Explore key trends, market segments, and leading companies shaping this dynamic landscape.

September 2025
Base Year: 2024
No Of Pages: 234
Price: $4750

PDC Drill Bits Industry Navigating Dynamics Comprehensive Analysis and Forecasts 2025-2033

The global PDC drill bit market is booming, with a CAGR exceeding 4% and a projected value exceeding $7 billion by 2033. Driven by oil & gas exploration, technological advancements, and unconventional resource development, this market analysis explores key trends, segments (matrix body, steel body, onshore/offshore), and leading companies like Schlumberger and Halliburton.

August 2025
Base Year: 2024
No Of Pages: 234
Price: $4750

South America Pumped Hydro Storage Market Growth Projections: Trends to Watch

Discover the booming South American Pumped Hydro Storage market! This comprehensive analysis reveals a CAGR of 5.40% through 2033, driven by renewable energy growth and government initiatives. Explore market size, segmentation, key players, and challenges in Brazil, Argentina, Colombia, and beyond.

August 2025
Base Year: 2024
No Of Pages: 234
Price: $4750

India Micro Batteries Market 2025 Trends and Forecasts 2033: Analyzing Growth Opportunities

Discover the booming India micro batteries market! Projected to reach $80.64 million by 2033 with a 17.09% CAGR, this report analyzes key drivers, trends, restraints, and leading companies across segments like lithium-ion and automotive applications. Get insights into regional market share and future growth potential.

August 2025
Base Year: 2024
No Of Pages: 180
Price: $3800

South Korea Smart Grid Technology Market Market’s Evolution: Key Growth Drivers 2025-2033

Discover the booming South Korea smart grid technology market! This comprehensive analysis reveals market size, CAGR, key drivers, trends, and restraints, along with insights into leading companies and regional growth projections through 2033. Explore the impact of smart meters, smart grid software, and renewable energy integration on the future of energy in South Korea.

August 2025
Base Year: 2024
No Of Pages: 197
Price: $3800

Middle-East Enhanced Oil Recovery Market Trends and Forecasts: Comprehensive Insights

Discover the booming Middle East Enhanced Oil Recovery (EOR) market! This report analyzes market size, growth (CAGR >6%), key drivers, trends, and regional breakdowns (Saudi Arabia, UAE, etc.), featuring leading companies and innovative techniques like thermal, gas, and chemical injection. Explore the opportunities and challenges in this lucrative sector projected to reach [estimated 2033 market size] by 2033.

August 2025
Base Year: 2024
No Of Pages: 234
Price: $4750

Nuclear Power Reactor Decommissioning Market Growth Forecast and Consumer Insights

The global Nuclear Power Reactor Decommissioning market is booming, with a 13.80% CAGR. Explore market trends, key players (Aecom, Orano, Westinghouse), regional insights, and future projections for this rapidly expanding sector. Learn about the challenges and opportunities in nuclear plant dismantling and waste management.

August 2025
Base Year: 2024
No Of Pages: 234
Price: $4750

Middle East and Africa Compressor Industry Strategic Market Opportunities: Trends 2025-2033

The Middle East & Africa compressor market is booming, projected to surpass $5.25 billion by 2033, driven by oil & gas, manufacturing, and power sectors. Discover key trends, regional insights, and leading companies shaping this dynamic industry.

August 2025
Base Year: 2024
No Of Pages: 234
Price: $4750

Japan Combined Heat and Power Market in Emerging Markets: Analysis and Projections 2025-2033

Discover the booming Japan Combined Heat and Power (CHP) market. This in-depth analysis reveals a CAGR exceeding 3.77%, driven by energy efficiency goals and government initiatives. Explore market size, key players (ABB, Mitsubishi, Siemens), regional trends (Kanto, Kansai), and future projections through 2033.

August 2025
Base Year: 2024
No Of Pages: 197
Price: $3800

UAE Oil and Gas Upstream Market Analysis Report 2025: Market to Grow by a CAGR of XX to 2033, Driven by Government Incentives, Popularity of Virtual Assistants, and Strategic Partnerships

The UAE Oil & Gas Upstream Market is booming, projected to reach $14.26 billion by 2033 with a 5.20% CAGR. This in-depth analysis covers market size, key players (ADNOC, ExxonMobil, Schlumberger), growth drivers, and future trends in onshore and offshore projects. Discover investment opportunities and market insights now.

August 2025
Base Year: 2024
No Of Pages: 197
Price: $3800

Seismic Survey Equipment Market Trends and Forecast 2025-2033

Discover the future of the seismic survey equipment market. This comprehensive analysis reveals a $XX million market poised for 2.80% CAGR growth through 2033, driven by energy exploration, mining, and technological advancements. Explore key trends, regional insights, and leading companies shaping this dynamic industry.

August 2025
Base Year: 2024
No Of Pages: 234
Price: $4750

Navigating Gas Generator Industry Market Trends: Competitor Analysis and Growth 2025-2033

Discover the booming gas generator market forecast to 2033! This comprehensive analysis reveals key drivers, trends, restraints, and regional market shares, including insights into major players like Cummins, Caterpillar, and Generac. Explore the growth opportunities in industrial, commercial, and residential sectors.

August 2025
Base Year: 2024
No Of Pages: 234
Price: $4750

Russia Hydro Power Plants Market Size, Share, and Growth Report: In-Depth Analysis and Forecast to 2033

Discover the booming Russia Hydro Power Plants market, projected to reach $16.25 billion by 2033. Analyze market drivers, trends, and restraints impacting growth, along with key players and regional insights. Explore the potential of hydroelectric power in Russia and its implications for renewable energy.

August 2025
Base Year: 2024
No Of Pages: 197
Price: $3800

Drivers of Change in Indonesia Oil and Gas Midstream Market Market 2025-2033

Discover the booming Indonesia Oil & Gas Midstream Market! Explore market size, growth projections (2025-2033), regional insights, and key drivers fueling this dynamic sector. Learn about investment opportunities and challenges in this crucial energy market.

August 2025
Base Year: 2024
No Of Pages: 197
Price: $3800

Market Projections for Excitation Systems Industry Industry 2025-2033

Discover the booming excitation systems market! Learn about its 4.35%+ CAGR, key drivers (renewable energy, grid modernization), regional trends (North America, Europe, Asia-Pacific), leading companies (ABB, Siemens, GE), and future growth projections to 2033. Explore market segmentation and investment opportunities in this vital sector of the power generation industry.

August 2025
Base Year: 2024
No Of Pages: 234
Price: $4750

Opportunities in Emerging Commercial Aircraft Aviation Fuel Market Industry Markets

The Commercial Aircraft Aviation Fuel market is booming, projected to reach \$220.1 billion by 2025 with a CAGR exceeding 20.86%. Discover key trends driving growth, including the rise of sustainable aviation fuels (SAFs) and the leading players shaping this dynamic industry. Explore regional market shares and future projections for this rapidly expanding sector.

August 2025
Base Year: 2024
No Of Pages: 180
Price: $4750

Strategic Growth Drivers for Myanmar Battery Industry Market

Discover the booming Myanmar battery market! This comprehensive analysis reveals a $50M (2025) industry with a CAGR >1.5%, driven by automotive, industrial, and consumer electronics growth. Explore market trends, key players, and future forecasts for lead-acid and lithium-ion batteries in Myanmar (2019-2033).

August 2025
Base Year: 2024
No Of Pages: 197
Price: $3800

Spain Solar Rooftop Industry Growth Opportunities and Market Forecast 2025-2033: A Strategic Analysis

Discover the booming Spain solar rooftop industry! This in-depth analysis reveals a €37.27B market in 2025, growing at a CAGR exceeding 9.50% through 2033. Learn about key drivers, trends, and leading companies shaping this dynamic sector.

August 2025
Base Year: 2024
No Of Pages: 180
Price: $3800

Technological Advances in Equatorial Guinea Power EPC Market Market: Trends and Opportunities 2025-2033

Discover the booming Equatorial Guinea power EPC market! Projected to reach $71.26 million by 2033 with a CAGR exceeding 4.5%, this report analyzes market drivers, trends, and key players like Wärtsilä and Power Construction Corporation of China. Learn about investment opportunities in this rapidly expanding African energy sector.

August 2025
Base Year: 2024
No Of Pages: 197
Price: $3800

Strategic Growth Drivers for India Transformer Market Market

Discover the booming India Transformer Market! This in-depth analysis reveals a $4.26 billion market in 2025, projected to exceed $6 billion by 2033, driven by infrastructure development and renewable energy adoption. Explore market segments, key players (ABB, CG Power, Siemens), and regional growth trends.

August 2025
Base Year: 2024
No Of Pages: 197
Price: $3800

Future-Ready Strategies for Pumped Hydro Storage Industry Market Growth

The Pumped Hydro Storage (PHS) market is booming, projected to reach $XX million by 2033, driven by renewable energy integration and grid stability needs. Learn about market trends, key players (Siemens, GE, EDF), and regional growth in this comprehensive analysis.

August 2025
Base Year: 2024
No Of Pages: 234
Price: $4750

Brazil Biofuel Market Insightful Analysis: Trends, Competitor Dynamics, and Opportunities 2025-2033

Discover the booming Brazil biofuel market! Our comprehensive analysis reveals a steady CAGR of 3.49% through 2033, driven by government initiatives and growing environmental awareness. Explore key players, market segments (biodiesel, ethanol, feedstocks), and future growth projections for this dynamic sector.

August 2025
Base Year: 2024
No Of Pages: 197
Price: $3800

Japan Uninterrupted Power Supply (UPS) Market Strategic Insights for 2025 and Forecasts to 2033: Market Trends

Discover the booming Japan Uninterrupted Power Supply (UPS) market. This in-depth analysis reveals key growth drivers, market segmentation, leading companies, and regional trends from 2019-2033. Learn about the CAGR, market size, and future projections for this essential technology sector in Japan.

August 2025
Base Year: 2024
No Of Pages: 197
Price: $3800

Exploring Growth Avenues in Denmark Geothermal Energy Market Market

Discover the booming Denmark geothermal energy market forecast to 2033! Explore market size, CAGR, key drivers, restraints, and leading companies. Learn about lithium-ion, flow, and other battery technologies driving growth in EV, energy storage, and consumer electronics sectors.

August 2025
Base Year: 2024
No Of Pages: 197
Price: $3800

Exploring Opportunities in Middle East And Africa Internal Combustion Engines Market Sector

The Middle East & Africa Internal Combustion Engine (ICE) market is booming, projected to reach $76.6 million by 2033 with a 16.30% CAGR. Discover key drivers, trends, and restraints shaping this dynamic market, including regional breakdowns and leading companies. Learn more about ICE engine capacity segments, fuel types (gasoline, diesel), and future projections.

August 2025
Base Year: 2024
No Of Pages: 234
Price: $4750

Europe Turbo Generator Market: Disruptive Technologies Driving Market Growth 2025-2033

The European turbo generator market is booming, with a CAGR exceeding 3.5% through 2033. Driven by rising electricity demand and power infrastructure upgrades, this market is segmented by end-user and type (steam & gas). Key players like Siemens and GE are navigating challenges like environmental regulations to capitalize on this growth. Explore market trends, forecasts, and key players in this detailed analysis.

August 2025
Base Year: 2024
No Of Pages: 234
Price: $4750

Emerging Natural Gas Distribution Market Trends and Opportunities

The global natural gas distribution market is booming, with a CAGR exceeding 3.20% and projected growth to $XXX million by 2033. Driven by rising energy demand and the shift to cleaner fuels, this market analysis explores key trends, challenges, and regional variations, highlighting major players like TC Energy and National Grid. Discover insights on CNG, PNG, and future growth projections.

August 2025
Base Year: 2024
No Of Pages: 234
Price: $4750

Asia-Pacific Steam Turbine Market Market Dynamics and Growth Analysis

The Asia-Pacific steam turbine market is booming, projected to reach $11 billion by 2033, driven by rising energy demands and industrialization. Explore market trends, key players (GE, Siemens, Mitsubishi), and regional breakdowns in this comprehensive analysis. Discover growth opportunities in this dynamic sector.

August 2025
Base Year: 2024
No Of Pages: 234
Price: $4750
  • Home
  • About Us
  • Industries
    • Aerospace & Defense
    • Agriculture
    • Animal Nutrition & Wellness
    • Automotive
    • Chemicals & Materials
    • Consumer Goods and Services
    • Energy & Power
    • Financial Services and Investment Intelligence
    • Food & Beverage
    • Home and Property Improvement
    • Hospitality and Tourism
    • Logistics
    • Manufacturing Products and Services
    • Packaging
    • Professional and Commercial Services
    • Real Estate and Construction
    • Retail
    • Technology, Media and Telecom
    • Healthcare
  • Services
  • Contact
Main Logo
  • Home
  • About Us
  • Industries
    • Aerospace & Defense
    • Agriculture
    • Animal Nutrition & Wellness
    • Automotive
    • Chemicals & Materials
    • Consumer Goods and Services
    • Energy & Power
    • Financial Services and Investment Intelligence
    • Food & Beverage
    • Home and Property Improvement
    • Hospitality and Tourism
    • Logistics
    • Manufacturing Products and Services
    • Packaging
    • Professional and Commercial Services
    • Real Estate and Construction
    • Retail
    • Technology, Media and Telecom
    • Healthcare
  • Services
  • Contact
+17162654855
[email protected]

+17162654855

[email protected]

Business Address

Head Office

Ansec House 3 rd floor Tank Road, Yerwada, Pune, Maharashtra 411014

Contact Information

Craig Francis

Business Development Head

+17162654855

[email protected]

Secure Payment Partners

payment image
RetailLogisticsPackagingAutomotiveHealthcareAgricultureEnergy & PowerFood & BeverageAerospace & DefenseChemicals & MaterialsHospitality and TourismAnimal Nutrition & WellnessConsumer Goods and ServicesReal Estate and ConstructionHome and Property ImprovementTechnology, Media and TelecomManufacturing Products and ServicesFinancial Services and Investment Intelligence

© 2025 PRDUA Research & Media Private Limited, All rights reserved

Privacy Policy
Terms and Conditions
FAQ