

Key Insights
The global dry mix mortar market is forecast to reach $8.89 billion by 2033, expanding at a compound annual growth rate (CAGR) of 4.7% from its base year of 2024. This growth is primarily driven by the booming global construction industry, especially in emerging economies undertaking significant infrastructure development. The increasing adoption of pre-mixed mortars, valued for their convenience, consistent quality, and reduced labor requirements, is a key growth catalyst. Specific application areas, including concrete protection, renovation, and tile adhesives, are exhibiting strong performance due to rising urbanization and the demand for durable, high-quality building materials. Challenges include volatile raw material costs, such as cement and aggregates, and potential supply chain disruptions. Stringent environmental regulations also necessitate sustainable manufacturing practices, presenting both opportunities and challenges. The competitive environment features major multinational corporations and regional players, actively engaged in product innovation and market share expansion. Asia-Pacific and other developing regions are anticipated to lead growth, fueled by rapid construction and infrastructure development.
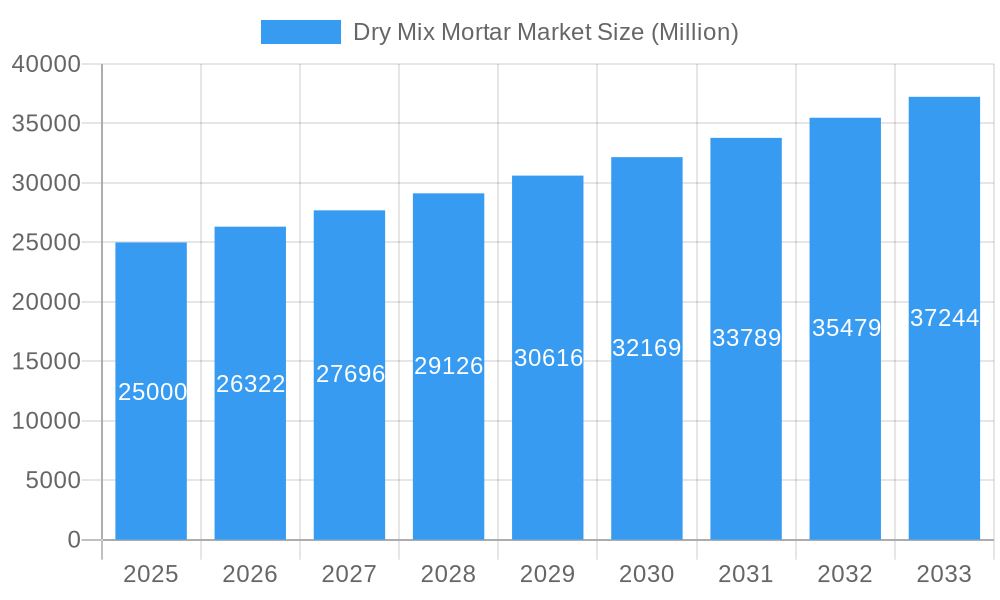
Dry Mix Mortar Market Market Size (In Billion)
The competitive landscape is highly fragmented, with global leaders such as Holcim, Saint-Gobain, and Sika, alongside numerous regional players, actively competing for market share. Key competitive strategies involve strategic partnerships, mergers and acquisitions, and continuous product innovation. A significant emerging trend is the development of eco-friendly and sustainable dry mix mortars, driven by heightened environmental awareness and stricter regulations. Manufacturers are prioritizing products with a reduced carbon footprint and incorporating recycled materials to meet the growing demand for sustainable construction solutions. Future market expansion will be contingent upon sustained growth in the construction sector, the effective implementation of sustainable practices, and the agility of companies to adapt to evolving market demands and technological advancements.
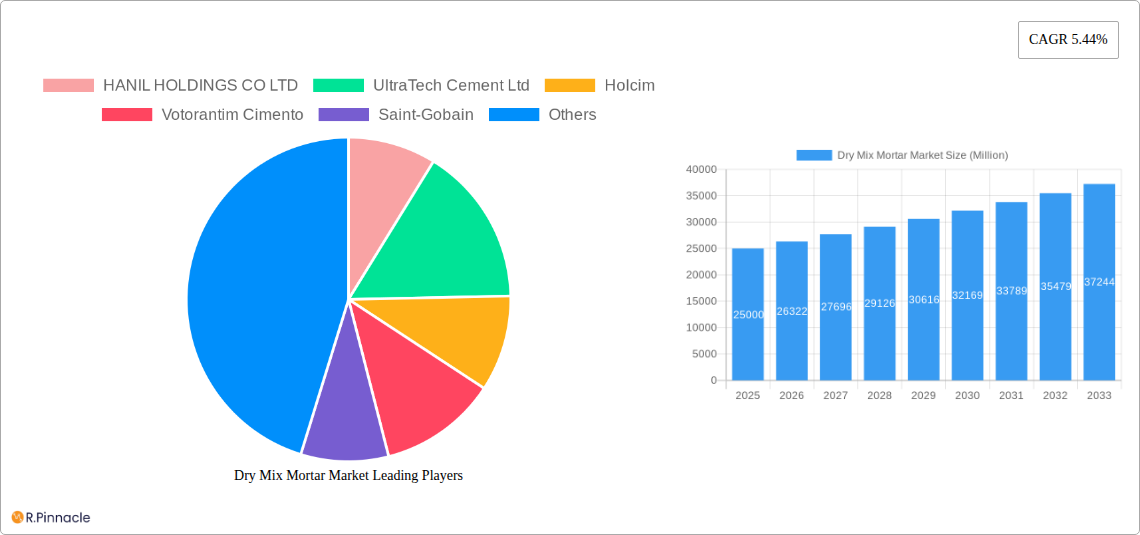
Dry Mix Mortar Market Company Market Share
Dry Mix Mortar Market Report: 2019-2033 Forecast
This comprehensive report provides a detailed analysis of the global Dry Mix Mortar market, offering invaluable insights for industry professionals, investors, and strategic decision-makers. Covering the period from 2019 to 2033 (Study Period), with a focus on 2025 (Base Year and Estimated Year) and forecasting to 2033 (Forecast Period), this report leverages historical data from 2019-2024 (Historical Period) to provide a robust and accurate market assessment.
Dry Mix Mortar Market Structure & Innovation Trends
The Dry Mix Mortar market exhibits a moderately consolidated structure, with several major players holding significant market share. HANIL HOLDINGS CO LTD, UltraTech Cement Ltd, Holcim, Votorantim Cimento, Saint-Gobain, MBCC Group, LATICRETE International Inc, CEMEX S A B de C V, Ardex Group, MAPEI S p A, Sika AG, SCG, SAMPYO GROUP, SIG, and Grupo Puma are key players shaping market dynamics. Market share analysis reveals that the top five players collectively hold approximately xx% of the global market, indicating significant competition and opportunities for growth. The market is characterized by continuous innovation driven by factors such as stringent building codes, demand for high-performance materials, and increasing adoption of sustainable construction practices. Regulatory frameworks concerning environmental impact and material safety play a crucial role. Product substitutes, such as specialized concrete mixes, are impacting market growth, albeit at a slower rate, due to the unique properties and advantages of dry mix mortars in specific applications. The market has witnessed significant M&A activity in recent years, with deal values exceeding xx Million in the past five years. These mergers and acquisitions are primarily driven by strategic expansion, technology acquisition, and enhanced market penetration.
- Market Concentration: Moderately consolidated, with top 5 players holding approximately xx% market share.
- Innovation Drivers: Stringent building codes, demand for high-performance materials, sustainability concerns.
- Regulatory Frameworks: Environmental impact regulations and material safety standards.
- Product Substitutes: Specialized concrete mixes, impacting market growth incrementally.
- M&A Activity: Significant activity in recent years, with deal values exceeding xx Million.
Dry Mix Mortar Market Dynamics & Trends
The global Dry Mix Mortar market is experiencing robust growth, driven by factors such as expanding construction activities globally, particularly in developing economies. Rising urbanization, infrastructure development projects, and increasing residential construction contribute significantly to market expansion. Technological advancements in material science and manufacturing processes lead to the development of improved performance characteristics (e.g., higher strength, faster setting times, improved workability) leading to increased adoption rates. Consumer preferences are shifting towards sustainable and environmentally friendly building materials. The market is characterized by intense competition among established players and new entrants. The market is expected to grow at a Compound Annual Growth Rate (CAGR) of xx% during the forecast period (2025-2033), with market penetration increasing to approximately xx% by 2033. This growth is influenced by technological advancements and shifts in consumer preferences towards greener, higher-performance solutions.
Dominant Regions & Segments in Dry Mix Mortar Market
The Asia-Pacific region dominates the Dry Mix Mortar market, driven by rapid urbanization and extensive infrastructure development projects. Significant growth is also observed in North America and Europe due to renovation and rebuilding activities.
- Key Drivers in Asia-Pacific: Rapid urbanization, robust infrastructure investments, rising disposable incomes.
- Key Drivers in North America: Renovation projects, stringent building codes, adoption of advanced technologies.
- Key Drivers in Europe: Rebuilding initiatives, focus on sustainable construction, stringent environmental regulations.
Dominant Segments:
- End-Use Sector: Infrastructure projects significantly drive demand, followed by Residential and Commercial/Industrial segments.
- Application: Tile Adhesive dominates due to its widespread use in various construction types, followed by Concrete Protection and Renovation.
Dry Mix Mortar Market Product Innovations
Recent years have witnessed significant product innovations in the Dry Mix Mortar market. Manufacturers are focusing on developing high-performance, sustainable, and easy-to-use products. Key innovations include lightweight mortars for enhanced efficiency, self-leveling compounds for improved application, and mortars with enhanced durability and weather resistance. These innovations meet the growing demands of the construction industry for efficient, high-quality, and sustainable materials. The market is witnessing a gradual shift towards pre-mixed and ready-to-use mortars, simplifying application and improving consistency.
Report Scope & Segmentation Analysis
This report comprehensively segments the Dry Mix Mortar market based on end-use sector (Commercial, Industrial and Institutional, Infrastructure, Residential) and application (Concrete Protection and Renovation, Grouts, Insulation and Finishing Systems, Plaster, Render, Tile Adhesive, Water Proofing Slurries, Other Applications). Each segment's growth projection, market size, and competitive landscape are thoroughly analyzed, providing a holistic view of market dynamics. For instance, the Infrastructure segment is projected to witness significant growth driven by substantial government spending on infrastructure development worldwide. Similarly, the Tile Adhesive application segment is expected to experience substantial growth owing to its extensive use in residential and commercial constructions.
Key Drivers of Dry Mix Mortar Market Growth
The Dry Mix Mortar market is propelled by several key factors:
- Rising Construction Activity: Global growth in construction spending is a major driver.
- Urbanization and Infrastructure Development: Expansion of cities and infrastructure projects fuels demand.
- Technological Advancements: Innovations in materials and manufacturing processes enhance performance.
- Government Initiatives: Policies supporting sustainable building practices stimulate growth.
Challenges in the Dry Mix Mortar Market Sector
The Dry Mix Mortar market faces certain challenges:
- Fluctuating Raw Material Prices: Volatility in raw material costs impacts production costs and profitability.
- Stringent Environmental Regulations: Compliance with environmental standards adds to production costs.
- Intense Competition: The market is characterized by substantial competition among existing players.
Emerging Opportunities in Dry Mix Mortar Market
Several opportunities exist in the Dry Mix Mortar market:
- Green Building Materials: Growing demand for sustainable and eco-friendly products.
- Technological Advancements: Development of innovative, high-performance mortars presents a growth opportunity.
- Emerging Markets: Expanding construction activity in developing economies provides a promising market entry point.
Leading Players in the Dry Mix Mortar Market Market
- HANIL HOLDINGS CO LTD
- UltraTech Cement Ltd
- Holcim
- Votorantim Cimento
- Saint-Gobain
- MBCC Group
- LATICRETE International Inc
- CEMEX S A B de C V
- Ardex Group
- MAPEI S p A
- Sika AG
- SCG
- SAMPYO GROUP
- SIG
- Grupo Puma
Key Developments in Dry Mix Mortar Market Industry
- May 2023: MBCC group divested its construction systems business to Sika AG. This significantly altered market dynamics, potentially impacting competition and innovation.
- May 2023: PCI (MBCC Group) launched PCI Novoment Flow, a ready-mixed flowable screed mortar, enhancing product offerings in the market.
- August 2023: LATICRETE International, Inc. launched 254 Platinum Plus, a high-performance, lightweight thin-set mortar for tile adhesives. This new product enhances LATICRETE’s position in the tile adhesive market segment.
Future Outlook for Dry Mix Mortar Market Market
The Dry Mix Mortar market is poised for continued growth, driven by ongoing urbanization, infrastructure development, and the increasing adoption of sustainable construction practices. Strategic partnerships, technological innovations, and expansion into emerging markets will be crucial for players to capitalize on the market's future potential. The focus on sustainable and high-performance materials will continue to shape market trends, presenting both challenges and exciting opportunities for growth and innovation in the coming years.
Dry Mix Mortar Market Segmentation
-
1. End Use Sector
- 1.1. Commercial
- 1.2. Industrial and Institutional
- 1.3. Infrastructure
- 1.4. Residential
-
2. Application
- 2.1. Concrete Protection and Renovation
- 2.2. Grouts
- 2.3. Insulation and Finishing Systems
- 2.4. Plaster
- 2.5. Render
- 2.6. Tile Adhesive
- 2.7. Water Proofing Slurries
- 2.8. Other Applications
Dry Mix Mortar Market Segmentation By Geography
-
1. North America
- 1.1. United States
- 1.2. Canada
- 1.3. Mexico
-
2. South America
- 2.1. Brazil
- 2.2. Argentina
- 2.3. Rest of South America
-
3. Europe
- 3.1. United Kingdom
- 3.2. Germany
- 3.3. France
- 3.4. Italy
- 3.5. Spain
- 3.6. Russia
- 3.7. Benelux
- 3.8. Nordics
- 3.9. Rest of Europe
-
4. Middle East & Africa
- 4.1. Turkey
- 4.2. Israel
- 4.3. GCC
- 4.4. North Africa
- 4.5. South Africa
- 4.6. Rest of Middle East & Africa
-
5. Asia Pacific
- 5.1. China
- 5.2. India
- 5.3. Japan
- 5.4. South Korea
- 5.5. ASEAN
- 5.6. Oceania
- 5.7. Rest of Asia Pacific
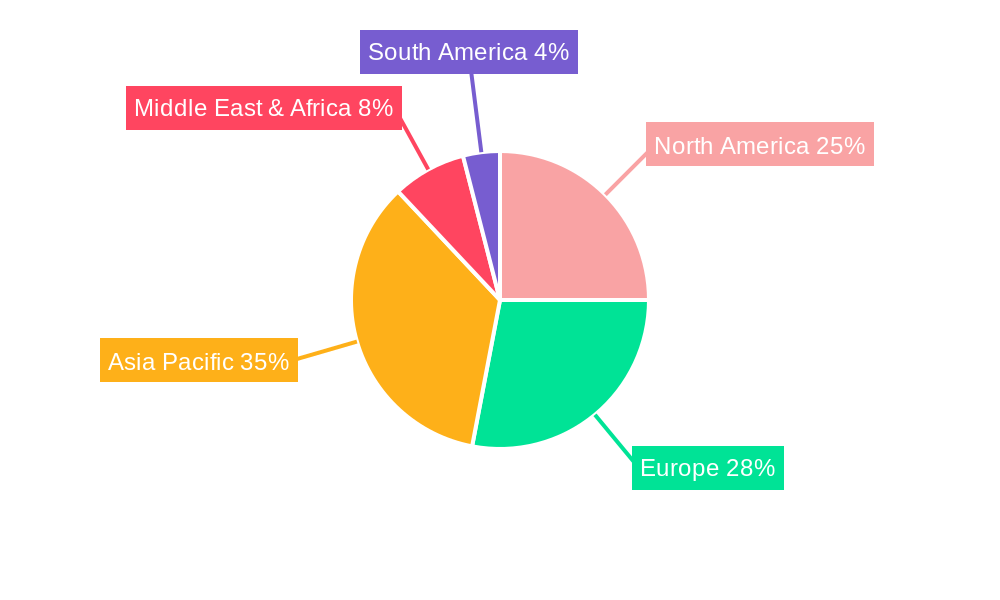
Dry Mix Mortar Market Regional Market Share
Geographic Coverage of Dry Mix Mortar Market
Dry Mix Mortar Market REPORT HIGHLIGHTS
| Aspects | Details |
|---|---|
| Study Period | 2020-2034 |
| Base Year | 2025 |
| Estimated Year | 2026 |
| Forecast Period | 2026-2034 |
| Historical Period | 2020-2025 |
| Growth Rate | CAGR of 4.7% from 2020-2034 |
| Segmentation |
|
Table of Contents
- 1. Introduction
- 1.1. Research Scope
- 1.2. Market Segmentation
- 1.3. Research Objective
- 1.4. Definitions and Assumptions
- 2. Executive Summary
- 2.1. Market Snapshot
- 3. Market Dynamics
- 3.1. Market Drivers
- 3.2. Market Restrains
- 3.3. Market Trends
- 3.4. Market Opportunities
- 4. Market Factor Analysis
- 4.1. Porters Five Forces
- 4.1.1. Bargaining Power of Suppliers
- 4.1.2. Bargaining Power of Buyers
- 4.1.3. Threat of New Entrants
- 4.1.4. Threat of Substitutes
- 4.1.5. Competitive Rivalry
- 4.2. PESTEL analysis
- 4.3. BCG Analysis
- 4.3.1. Stars (High Growth, High Market Share)
- 4.3.2. Cash Cows (Low Growth, High Market Share)
- 4.3.3. Question Mark (High Growth, Low Market Share)
- 4.3.4. Dogs (Low Growth, Low Market Share)
- 4.4. Ansoff Matrix Analysis
- 4.5. Supply Chain Analysis
- 4.6. Regulatory Landscape
- 4.7. Current Market Potential and Opportunity Assessment (TAM–SAM–SOM Framework)
- 4.8. PRI Analyst Note
- 4.1. Porters Five Forces
- 5. Market Analysis, Insights and Forecast 2021-2033
- 5.1. Market Analysis, Insights and Forecast - by End Use Sector
- 5.1.1. Commercial
- 5.1.2. Industrial and Institutional
- 5.1.3. Infrastructure
- 5.1.4. Residential
- 5.2. Market Analysis, Insights and Forecast - by Application
- 5.2.1. Concrete Protection and Renovation
- 5.2.2. Grouts
- 5.2.3. Insulation and Finishing Systems
- 5.2.4. Plaster
- 5.2.5. Render
- 5.2.6. Tile Adhesive
- 5.2.7. Water Proofing Slurries
- 5.2.8. Other Applications
- 5.3. Market Analysis, Insights and Forecast - by Region
- 5.3.1. North America
- 5.3.2. South America
- 5.3.3. Europe
- 5.3.4. Middle East & Africa
- 5.3.5. Asia Pacific
- 5.1. Market Analysis, Insights and Forecast - by End Use Sector
- 6. Global Dry Mix Mortar Market Analysis, Insights and Forecast, 2021-2033
- 6.1. Market Analysis, Insights and Forecast - by End Use Sector
- 6.1.1. Commercial
- 6.1.2. Industrial and Institutional
- 6.1.3. Infrastructure
- 6.1.4. Residential
- 6.2. Market Analysis, Insights and Forecast - by Application
- 6.2.1. Concrete Protection and Renovation
- 6.2.2. Grouts
- 6.2.3. Insulation and Finishing Systems
- 6.2.4. Plaster
- 6.2.5. Render
- 6.2.6. Tile Adhesive
- 6.2.7. Water Proofing Slurries
- 6.2.8. Other Applications
- 6.1. Market Analysis, Insights and Forecast - by End Use Sector
- 7. North America Dry Mix Mortar Market Analysis, Insights and Forecast, 2020-2032
- 7.1. Market Analysis, Insights and Forecast - by End Use Sector
- 7.1.1. Commercial
- 7.1.2. Industrial and Institutional
- 7.1.3. Infrastructure
- 7.1.4. Residential
- 7.2. Market Analysis, Insights and Forecast - by Application
- 7.2.1. Concrete Protection and Renovation
- 7.2.2. Grouts
- 7.2.3. Insulation and Finishing Systems
- 7.2.4. Plaster
- 7.2.5. Render
- 7.2.6. Tile Adhesive
- 7.2.7. Water Proofing Slurries
- 7.2.8. Other Applications
- 7.1. Market Analysis, Insights and Forecast - by End Use Sector
- 8. South America Dry Mix Mortar Market Analysis, Insights and Forecast, 2020-2032
- 8.1. Market Analysis, Insights and Forecast - by End Use Sector
- 8.1.1. Commercial
- 8.1.2. Industrial and Institutional
- 8.1.3. Infrastructure
- 8.1.4. Residential
- 8.2. Market Analysis, Insights and Forecast - by Application
- 8.2.1. Concrete Protection and Renovation
- 8.2.2. Grouts
- 8.2.3. Insulation and Finishing Systems
- 8.2.4. Plaster
- 8.2.5. Render
- 8.2.6. Tile Adhesive
- 8.2.7. Water Proofing Slurries
- 8.2.8. Other Applications
- 8.1. Market Analysis, Insights and Forecast - by End Use Sector
- 9. Europe Dry Mix Mortar Market Analysis, Insights and Forecast, 2020-2032
- 9.1. Market Analysis, Insights and Forecast - by End Use Sector
- 9.1.1. Commercial
- 9.1.2. Industrial and Institutional
- 9.1.3. Infrastructure
- 9.1.4. Residential
- 9.2. Market Analysis, Insights and Forecast - by Application
- 9.2.1. Concrete Protection and Renovation
- 9.2.2. Grouts
- 9.2.3. Insulation and Finishing Systems
- 9.2.4. Plaster
- 9.2.5. Render
- 9.2.6. Tile Adhesive
- 9.2.7. Water Proofing Slurries
- 9.2.8. Other Applications
- 9.1. Market Analysis, Insights and Forecast - by End Use Sector
- 10. Middle East & Africa Dry Mix Mortar Market Analysis, Insights and Forecast, 2020-2032
- 10.1. Market Analysis, Insights and Forecast - by End Use Sector
- 10.1.1. Commercial
- 10.1.2. Industrial and Institutional
- 10.1.3. Infrastructure
- 10.1.4. Residential
- 10.2. Market Analysis, Insights and Forecast - by Application
- 10.2.1. Concrete Protection and Renovation
- 10.2.2. Grouts
- 10.2.3. Insulation and Finishing Systems
- 10.2.4. Plaster
- 10.2.5. Render
- 10.2.6. Tile Adhesive
- 10.2.7. Water Proofing Slurries
- 10.2.8. Other Applications
- 10.1. Market Analysis, Insights and Forecast - by End Use Sector
- 11. Asia Pacific Dry Mix Mortar Market Analysis, Insights and Forecast, 2020-2032
- 11.1. Market Analysis, Insights and Forecast - by End Use Sector
- 11.1.1. Commercial
- 11.1.2. Industrial and Institutional
- 11.1.3. Infrastructure
- 11.1.4. Residential
- 11.2. Market Analysis, Insights and Forecast - by Application
- 11.2.1. Concrete Protection and Renovation
- 11.2.2. Grouts
- 11.2.3. Insulation and Finishing Systems
- 11.2.4. Plaster
- 11.2.5. Render
- 11.2.6. Tile Adhesive
- 11.2.7. Water Proofing Slurries
- 11.2.8. Other Applications
- 11.1. Market Analysis, Insights and Forecast - by End Use Sector
- 12. Competitive Analysis
- 12.1. Company Profiles
- 12.1.1 HANIL HOLDINGS CO LTD
- 12.1.1.1. Company Overview
- 12.1.1.2. Products
- 12.1.1.3. Company Financials
- 12.1.1.4. SWOT Analysis
- 12.1.2 UltraTech Cement Ltd
- 12.1.2.1. Company Overview
- 12.1.2.2. Products
- 12.1.2.3. Company Financials
- 12.1.2.4. SWOT Analysis
- 12.1.3 Holcim
- 12.1.3.1. Company Overview
- 12.1.3.2. Products
- 12.1.3.3. Company Financials
- 12.1.3.4. SWOT Analysis
- 12.1.4 Votorantim Cimento
- 12.1.4.1. Company Overview
- 12.1.4.2. Products
- 12.1.4.3. Company Financials
- 12.1.4.4. SWOT Analysis
- 12.1.5 Saint-Gobain
- 12.1.5.1. Company Overview
- 12.1.5.2. Products
- 12.1.5.3. Company Financials
- 12.1.5.4. SWOT Analysis
- 12.1.6 MBCC Group
- 12.1.6.1. Company Overview
- 12.1.6.2. Products
- 12.1.6.3. Company Financials
- 12.1.6.4. SWOT Analysis
- 12.1.7 LATICRETE International Inc
- 12.1.7.1. Company Overview
- 12.1.7.2. Products
- 12.1.7.3. Company Financials
- 12.1.7.4. SWOT Analysis
- 12.1.8 CEMEX S A B de C V
- 12.1.8.1. Company Overview
- 12.1.8.2. Products
- 12.1.8.3. Company Financials
- 12.1.8.4. SWOT Analysis
- 12.1.9 Ardex Group
- 12.1.9.1. Company Overview
- 12.1.9.2. Products
- 12.1.9.3. Company Financials
- 12.1.9.4. SWOT Analysis
- 12.1.10 MAPEI S p A
- 12.1.10.1. Company Overview
- 12.1.10.2. Products
- 12.1.10.3. Company Financials
- 12.1.10.4. SWOT Analysis
- 12.1.11 Sika AG
- 12.1.11.1. Company Overview
- 12.1.11.2. Products
- 12.1.11.3. Company Financials
- 12.1.11.4. SWOT Analysis
- 12.1.12 SCG
- 12.1.12.1. Company Overview
- 12.1.12.2. Products
- 12.1.12.3. Company Financials
- 12.1.12.4. SWOT Analysis
- 12.1.13 SAMPYO GROUP
- 12.1.13.1. Company Overview
- 12.1.13.2. Products
- 12.1.13.3. Company Financials
- 12.1.13.4. SWOT Analysis
- 12.1.14 SIG
- 12.1.14.1. Company Overview
- 12.1.14.2. Products
- 12.1.14.3. Company Financials
- 12.1.14.4. SWOT Analysis
- 12.1.15 Grupo Puma
- 12.1.15.1. Company Overview
- 12.1.15.2. Products
- 12.1.15.3. Company Financials
- 12.1.15.4. SWOT Analysis
- 12.1.1 HANIL HOLDINGS CO LTD
- 12.2. Market Entropy
- 12.2.1 Company's Key Areas Served
- 12.2.2 Recent Developments
- 12.3. Company Market Share Analysis 2025
- 12.3.1 Top 5 Companies Market Share Analysis
- 12.3.2 Top 3 Companies Market Share Analysis
- 12.4. List of Potential Customers
- 13. Research Methodology
List of Figures
- Figure 1: Global Dry Mix Mortar Market Revenue Breakdown (billion, %) by Region 2025 & 2033
- Figure 2: Global Dry Mix Mortar Market Volume Breakdown (K Tons, %) by Region 2025 & 2033
- Figure 3: North America Dry Mix Mortar Market Revenue (billion), by End Use Sector 2025 & 2033
- Figure 4: North America Dry Mix Mortar Market Volume (K Tons), by End Use Sector 2025 & 2033
- Figure 5: North America Dry Mix Mortar Market Revenue Share (%), by End Use Sector 2025 & 2033
- Figure 6: North America Dry Mix Mortar Market Volume Share (%), by End Use Sector 2025 & 2033
- Figure 7: North America Dry Mix Mortar Market Revenue (billion), by Application 2025 & 2033
- Figure 8: North America Dry Mix Mortar Market Volume (K Tons), by Application 2025 & 2033
- Figure 9: North America Dry Mix Mortar Market Revenue Share (%), by Application 2025 & 2033
- Figure 10: North America Dry Mix Mortar Market Volume Share (%), by Application 2025 & 2033
- Figure 11: North America Dry Mix Mortar Market Revenue (billion), by Country 2025 & 2033
- Figure 12: North America Dry Mix Mortar Market Volume (K Tons), by Country 2025 & 2033
- Figure 13: North America Dry Mix Mortar Market Revenue Share (%), by Country 2025 & 2033
- Figure 14: North America Dry Mix Mortar Market Volume Share (%), by Country 2025 & 2033
- Figure 15: South America Dry Mix Mortar Market Revenue (billion), by End Use Sector 2025 & 2033
- Figure 16: South America Dry Mix Mortar Market Volume (K Tons), by End Use Sector 2025 & 2033
- Figure 17: South America Dry Mix Mortar Market Revenue Share (%), by End Use Sector 2025 & 2033
- Figure 18: South America Dry Mix Mortar Market Volume Share (%), by End Use Sector 2025 & 2033
- Figure 19: South America Dry Mix Mortar Market Revenue (billion), by Application 2025 & 2033
- Figure 20: South America Dry Mix Mortar Market Volume (K Tons), by Application 2025 & 2033
- Figure 21: South America Dry Mix Mortar Market Revenue Share (%), by Application 2025 & 2033
- Figure 22: South America Dry Mix Mortar Market Volume Share (%), by Application 2025 & 2033
- Figure 23: South America Dry Mix Mortar Market Revenue (billion), by Country 2025 & 2033
- Figure 24: South America Dry Mix Mortar Market Volume (K Tons), by Country 2025 & 2033
- Figure 25: South America Dry Mix Mortar Market Revenue Share (%), by Country 2025 & 2033
- Figure 26: South America Dry Mix Mortar Market Volume Share (%), by Country 2025 & 2033
- Figure 27: Europe Dry Mix Mortar Market Revenue (billion), by End Use Sector 2025 & 2033
- Figure 28: Europe Dry Mix Mortar Market Volume (K Tons), by End Use Sector 2025 & 2033
- Figure 29: Europe Dry Mix Mortar Market Revenue Share (%), by End Use Sector 2025 & 2033
- Figure 30: Europe Dry Mix Mortar Market Volume Share (%), by End Use Sector 2025 & 2033
- Figure 31: Europe Dry Mix Mortar Market Revenue (billion), by Application 2025 & 2033
- Figure 32: Europe Dry Mix Mortar Market Volume (K Tons), by Application 2025 & 2033
- Figure 33: Europe Dry Mix Mortar Market Revenue Share (%), by Application 2025 & 2033
- Figure 34: Europe Dry Mix Mortar Market Volume Share (%), by Application 2025 & 2033
- Figure 35: Europe Dry Mix Mortar Market Revenue (billion), by Country 2025 & 2033
- Figure 36: Europe Dry Mix Mortar Market Volume (K Tons), by Country 2025 & 2033
- Figure 37: Europe Dry Mix Mortar Market Revenue Share (%), by Country 2025 & 2033
- Figure 38: Europe Dry Mix Mortar Market Volume Share (%), by Country 2025 & 2033
- Figure 39: Middle East & Africa Dry Mix Mortar Market Revenue (billion), by End Use Sector 2025 & 2033
- Figure 40: Middle East & Africa Dry Mix Mortar Market Volume (K Tons), by End Use Sector 2025 & 2033
- Figure 41: Middle East & Africa Dry Mix Mortar Market Revenue Share (%), by End Use Sector 2025 & 2033
- Figure 42: Middle East & Africa Dry Mix Mortar Market Volume Share (%), by End Use Sector 2025 & 2033
- Figure 43: Middle East & Africa Dry Mix Mortar Market Revenue (billion), by Application 2025 & 2033
- Figure 44: Middle East & Africa Dry Mix Mortar Market Volume (K Tons), by Application 2025 & 2033
- Figure 45: Middle East & Africa Dry Mix Mortar Market Revenue Share (%), by Application 2025 & 2033
- Figure 46: Middle East & Africa Dry Mix Mortar Market Volume Share (%), by Application 2025 & 2033
- Figure 47: Middle East & Africa Dry Mix Mortar Market Revenue (billion), by Country 2025 & 2033
- Figure 48: Middle East & Africa Dry Mix Mortar Market Volume (K Tons), by Country 2025 & 2033
- Figure 49: Middle East & Africa Dry Mix Mortar Market Revenue Share (%), by Country 2025 & 2033
- Figure 50: Middle East & Africa Dry Mix Mortar Market Volume Share (%), by Country 2025 & 2033
- Figure 51: Asia Pacific Dry Mix Mortar Market Revenue (billion), by End Use Sector 2025 & 2033
- Figure 52: Asia Pacific Dry Mix Mortar Market Volume (K Tons), by End Use Sector 2025 & 2033
- Figure 53: Asia Pacific Dry Mix Mortar Market Revenue Share (%), by End Use Sector 2025 & 2033
- Figure 54: Asia Pacific Dry Mix Mortar Market Volume Share (%), by End Use Sector 2025 & 2033
- Figure 55: Asia Pacific Dry Mix Mortar Market Revenue (billion), by Application 2025 & 2033
- Figure 56: Asia Pacific Dry Mix Mortar Market Volume (K Tons), by Application 2025 & 2033
- Figure 57: Asia Pacific Dry Mix Mortar Market Revenue Share (%), by Application 2025 & 2033
- Figure 58: Asia Pacific Dry Mix Mortar Market Volume Share (%), by Application 2025 & 2033
- Figure 59: Asia Pacific Dry Mix Mortar Market Revenue (billion), by Country 2025 & 2033
- Figure 60: Asia Pacific Dry Mix Mortar Market Volume (K Tons), by Country 2025 & 2033
- Figure 61: Asia Pacific Dry Mix Mortar Market Revenue Share (%), by Country 2025 & 2033
- Figure 62: Asia Pacific Dry Mix Mortar Market Volume Share (%), by Country 2025 & 2033
List of Tables
- Table 1: Global Dry Mix Mortar Market Revenue billion Forecast, by End Use Sector 2020 & 2033
- Table 2: Global Dry Mix Mortar Market Volume K Tons Forecast, by End Use Sector 2020 & 2033
- Table 3: Global Dry Mix Mortar Market Revenue billion Forecast, by Application 2020 & 2033
- Table 4: Global Dry Mix Mortar Market Volume K Tons Forecast, by Application 2020 & 2033
- Table 5: Global Dry Mix Mortar Market Revenue billion Forecast, by Region 2020 & 2033
- Table 6: Global Dry Mix Mortar Market Volume K Tons Forecast, by Region 2020 & 2033
- Table 7: Global Dry Mix Mortar Market Revenue billion Forecast, by End Use Sector 2020 & 2033
- Table 8: Global Dry Mix Mortar Market Volume K Tons Forecast, by End Use Sector 2020 & 2033
- Table 9: Global Dry Mix Mortar Market Revenue billion Forecast, by Application 2020 & 2033
- Table 10: Global Dry Mix Mortar Market Volume K Tons Forecast, by Application 2020 & 2033
- Table 11: Global Dry Mix Mortar Market Revenue billion Forecast, by Country 2020 & 2033
- Table 12: Global Dry Mix Mortar Market Volume K Tons Forecast, by Country 2020 & 2033
- Table 13: United States Dry Mix Mortar Market Revenue (billion) Forecast, by Application 2020 & 2033
- Table 14: United States Dry Mix Mortar Market Volume (K Tons) Forecast, by Application 2020 & 2033
- Table 15: Canada Dry Mix Mortar Market Revenue (billion) Forecast, by Application 2020 & 2033
- Table 16: Canada Dry Mix Mortar Market Volume (K Tons) Forecast, by Application 2020 & 2033
- Table 17: Mexico Dry Mix Mortar Market Revenue (billion) Forecast, by Application 2020 & 2033
- Table 18: Mexico Dry Mix Mortar Market Volume (K Tons) Forecast, by Application 2020 & 2033
- Table 19: Global Dry Mix Mortar Market Revenue billion Forecast, by End Use Sector 2020 & 2033
- Table 20: Global Dry Mix Mortar Market Volume K Tons Forecast, by End Use Sector 2020 & 2033
- Table 21: Global Dry Mix Mortar Market Revenue billion Forecast, by Application 2020 & 2033
- Table 22: Global Dry Mix Mortar Market Volume K Tons Forecast, by Application 2020 & 2033
- Table 23: Global Dry Mix Mortar Market Revenue billion Forecast, by Country 2020 & 2033
- Table 24: Global Dry Mix Mortar Market Volume K Tons Forecast, by Country 2020 & 2033
- Table 25: Brazil Dry Mix Mortar Market Revenue (billion) Forecast, by Application 2020 & 2033
- Table 26: Brazil Dry Mix Mortar Market Volume (K Tons) Forecast, by Application 2020 & 2033
- Table 27: Argentina Dry Mix Mortar Market Revenue (billion) Forecast, by Application 2020 & 2033
- Table 28: Argentina Dry Mix Mortar Market Volume (K Tons) Forecast, by Application 2020 & 2033
- Table 29: Rest of South America Dry Mix Mortar Market Revenue (billion) Forecast, by Application 2020 & 2033
- Table 30: Rest of South America Dry Mix Mortar Market Volume (K Tons) Forecast, by Application 2020 & 2033
- Table 31: Global Dry Mix Mortar Market Revenue billion Forecast, by End Use Sector 2020 & 2033
- Table 32: Global Dry Mix Mortar Market Volume K Tons Forecast, by End Use Sector 2020 & 2033
- Table 33: Global Dry Mix Mortar Market Revenue billion Forecast, by Application 2020 & 2033
- Table 34: Global Dry Mix Mortar Market Volume K Tons Forecast, by Application 2020 & 2033
- Table 35: Global Dry Mix Mortar Market Revenue billion Forecast, by Country 2020 & 2033
- Table 36: Global Dry Mix Mortar Market Volume K Tons Forecast, by Country 2020 & 2033
- Table 37: United Kingdom Dry Mix Mortar Market Revenue (billion) Forecast, by Application 2020 & 2033
- Table 38: United Kingdom Dry Mix Mortar Market Volume (K Tons) Forecast, by Application 2020 & 2033
- Table 39: Germany Dry Mix Mortar Market Revenue (billion) Forecast, by Application 2020 & 2033
- Table 40: Germany Dry Mix Mortar Market Volume (K Tons) Forecast, by Application 2020 & 2033
- Table 41: France Dry Mix Mortar Market Revenue (billion) Forecast, by Application 2020 & 2033
- Table 42: France Dry Mix Mortar Market Volume (K Tons) Forecast, by Application 2020 & 2033
- Table 43: Italy Dry Mix Mortar Market Revenue (billion) Forecast, by Application 2020 & 2033
- Table 44: Italy Dry Mix Mortar Market Volume (K Tons) Forecast, by Application 2020 & 2033
- Table 45: Spain Dry Mix Mortar Market Revenue (billion) Forecast, by Application 2020 & 2033
- Table 46: Spain Dry Mix Mortar Market Volume (K Tons) Forecast, by Application 2020 & 2033
- Table 47: Russia Dry Mix Mortar Market Revenue (billion) Forecast, by Application 2020 & 2033
- Table 48: Russia Dry Mix Mortar Market Volume (K Tons) Forecast, by Application 2020 & 2033
- Table 49: Benelux Dry Mix Mortar Market Revenue (billion) Forecast, by Application 2020 & 2033
- Table 50: Benelux Dry Mix Mortar Market Volume (K Tons) Forecast, by Application 2020 & 2033
- Table 51: Nordics Dry Mix Mortar Market Revenue (billion) Forecast, by Application 2020 & 2033
- Table 52: Nordics Dry Mix Mortar Market Volume (K Tons) Forecast, by Application 2020 & 2033
- Table 53: Rest of Europe Dry Mix Mortar Market Revenue (billion) Forecast, by Application 2020 & 2033
- Table 54: Rest of Europe Dry Mix Mortar Market Volume (K Tons) Forecast, by Application 2020 & 2033
- Table 55: Global Dry Mix Mortar Market Revenue billion Forecast, by End Use Sector 2020 & 2033
- Table 56: Global Dry Mix Mortar Market Volume K Tons Forecast, by End Use Sector 2020 & 2033
- Table 57: Global Dry Mix Mortar Market Revenue billion Forecast, by Application 2020 & 2033
- Table 58: Global Dry Mix Mortar Market Volume K Tons Forecast, by Application 2020 & 2033
- Table 59: Global Dry Mix Mortar Market Revenue billion Forecast, by Country 2020 & 2033
- Table 60: Global Dry Mix Mortar Market Volume K Tons Forecast, by Country 2020 & 2033
- Table 61: Turkey Dry Mix Mortar Market Revenue (billion) Forecast, by Application 2020 & 2033
- Table 62: Turkey Dry Mix Mortar Market Volume (K Tons) Forecast, by Application 2020 & 2033
- Table 63: Israel Dry Mix Mortar Market Revenue (billion) Forecast, by Application 2020 & 2033
- Table 64: Israel Dry Mix Mortar Market Volume (K Tons) Forecast, by Application 2020 & 2033
- Table 65: GCC Dry Mix Mortar Market Revenue (billion) Forecast, by Application 2020 & 2033
- Table 66: GCC Dry Mix Mortar Market Volume (K Tons) Forecast, by Application 2020 & 2033
- Table 67: North Africa Dry Mix Mortar Market Revenue (billion) Forecast, by Application 2020 & 2033
- Table 68: North Africa Dry Mix Mortar Market Volume (K Tons) Forecast, by Application 2020 & 2033
- Table 69: South Africa Dry Mix Mortar Market Revenue (billion) Forecast, by Application 2020 & 2033
- Table 70: South Africa Dry Mix Mortar Market Volume (K Tons) Forecast, by Application 2020 & 2033
- Table 71: Rest of Middle East & Africa Dry Mix Mortar Market Revenue (billion) Forecast, by Application 2020 & 2033
- Table 72: Rest of Middle East & Africa Dry Mix Mortar Market Volume (K Tons) Forecast, by Application 2020 & 2033
- Table 73: Global Dry Mix Mortar Market Revenue billion Forecast, by End Use Sector 2020 & 2033
- Table 74: Global Dry Mix Mortar Market Volume K Tons Forecast, by End Use Sector 2020 & 2033
- Table 75: Global Dry Mix Mortar Market Revenue billion Forecast, by Application 2020 & 2033
- Table 76: Global Dry Mix Mortar Market Volume K Tons Forecast, by Application 2020 & 2033
- Table 77: Global Dry Mix Mortar Market Revenue billion Forecast, by Country 2020 & 2033
- Table 78: Global Dry Mix Mortar Market Volume K Tons Forecast, by Country 2020 & 2033
- Table 79: China Dry Mix Mortar Market Revenue (billion) Forecast, by Application 2020 & 2033
- Table 80: China Dry Mix Mortar Market Volume (K Tons) Forecast, by Application 2020 & 2033
- Table 81: India Dry Mix Mortar Market Revenue (billion) Forecast, by Application 2020 & 2033
- Table 82: India Dry Mix Mortar Market Volume (K Tons) Forecast, by Application 2020 & 2033
- Table 83: Japan Dry Mix Mortar Market Revenue (billion) Forecast, by Application 2020 & 2033
- Table 84: Japan Dry Mix Mortar Market Volume (K Tons) Forecast, by Application 2020 & 2033
- Table 85: South Korea Dry Mix Mortar Market Revenue (billion) Forecast, by Application 2020 & 2033
- Table 86: South Korea Dry Mix Mortar Market Volume (K Tons) Forecast, by Application 2020 & 2033
- Table 87: ASEAN Dry Mix Mortar Market Revenue (billion) Forecast, by Application 2020 & 2033
- Table 88: ASEAN Dry Mix Mortar Market Volume (K Tons) Forecast, by Application 2020 & 2033
- Table 89: Oceania Dry Mix Mortar Market Revenue (billion) Forecast, by Application 2020 & 2033
- Table 90: Oceania Dry Mix Mortar Market Volume (K Tons) Forecast, by Application 2020 & 2033
- Table 91: Rest of Asia Pacific Dry Mix Mortar Market Revenue (billion) Forecast, by Application 2020 & 2033
- Table 92: Rest of Asia Pacific Dry Mix Mortar Market Volume (K Tons) Forecast, by Application 2020 & 2033
Frequently Asked Questions
1. What is the projected Compound Annual Growth Rate (CAGR) of the Dry Mix Mortar Market?
The projected CAGR is approximately 4.7%.
2. Which companies are prominent players in the Dry Mix Mortar Market?
Key companies in the market include HANIL HOLDINGS CO LTD, UltraTech Cement Ltd, Holcim, Votorantim Cimento, Saint-Gobain, MBCC Group, LATICRETE International Inc, CEMEX S A B de C V, Ardex Group, MAPEI S p A, Sika AG, SCG, SAMPYO GROUP, SIG, Grupo Puma.
3. What are the main segments of the Dry Mix Mortar Market?
The market segments include End Use Sector, Application.
4. Can you provide details about the market size?
The market size is estimated to be USD 8.89 billion as of 2022.
5. What are some drivers contributing to market growth?
; Banning/ Limiting Use of Plastics used in packaging applications.
6. What are the notable trends driving market growth?
OTHER KEY INDUSTRY TRENDS COVERED IN THE REPORT.
7. Are there any restraints impacting market growth?
; Harmful Amines in Dyes; Paperless Green Initiatives.
8. Can you provide examples of recent developments in the market?
August 2023: LATICRETE International, Inc. formulated a high-performance, lightweight, thin-set mortar, 254 Platinum Plus, for tile adhesive applications.May 2023: PCI, an affiliate of MBCC Group, formulated a ready-mixed flowable screed mortar, PCI Novoment Flow, offering multiple benefits like quick setting and curing.May 2023: MBCC group divested its construction systems business, including its subsidiaries, product portfolio, and advanced technologies, to Sika AG.
9. What pricing options are available for accessing the report?
Pricing options include single-user, multi-user, and enterprise licenses priced at USD 3800, USD 4500, and USD 5800 respectively.
10. Is the market size provided in terms of value or volume?
The market size is provided in terms of value, measured in billion and volume, measured in K Tons.
11. Are there any specific market keywords associated with the report?
Yes, the market keyword associated with the report is "Dry Mix Mortar Market," which aids in identifying and referencing the specific market segment covered.
12. How do I determine which pricing option suits my needs best?
The pricing options vary based on user requirements and access needs. Individual users may opt for single-user licenses, while businesses requiring broader access may choose multi-user or enterprise licenses for cost-effective access to the report.
13. Are there any additional resources or data provided in the Dry Mix Mortar Market report?
While the report offers comprehensive insights, it's advisable to review the specific contents or supplementary materials provided to ascertain if additional resources or data are available.
14. How can I stay updated on further developments or reports in the Dry Mix Mortar Market?
To stay informed about further developments, trends, and reports in the Dry Mix Mortar Market, consider subscribing to industry newsletters, following relevant companies and organizations, or regularly checking reputable industry news sources and publications.
Methodology
Step 1 - Identification of Relevant Samples Size from Population Database


Step 2 - Approaches for Defining Global Market Size (Value, Volume* & Price*)

Note*: In applicable scenarios
Step 3 - Data Sources
Primary Research
- Web Analytics
- Survey Reports
- Research Institute
- Latest Research Reports
- Opinion Leaders
Secondary Research
- Annual Reports
- White Paper
- Latest Press Release
- Industry Association
- Paid Database
- Investor Presentations

Step 4 - Data Triangulation
Involves using different sources of information in order to increase the validity of a study
These sources are likely to be stakeholders in a program - participants, other researchers, program staff, other community members, and so on.
Then we put all data in single framework & apply various statistical tools to find out the dynamic on the market.
During the analysis stage, feedback from the stakeholder groups would be compared to determine areas of agreement as well as areas of divergence