

Key Insights
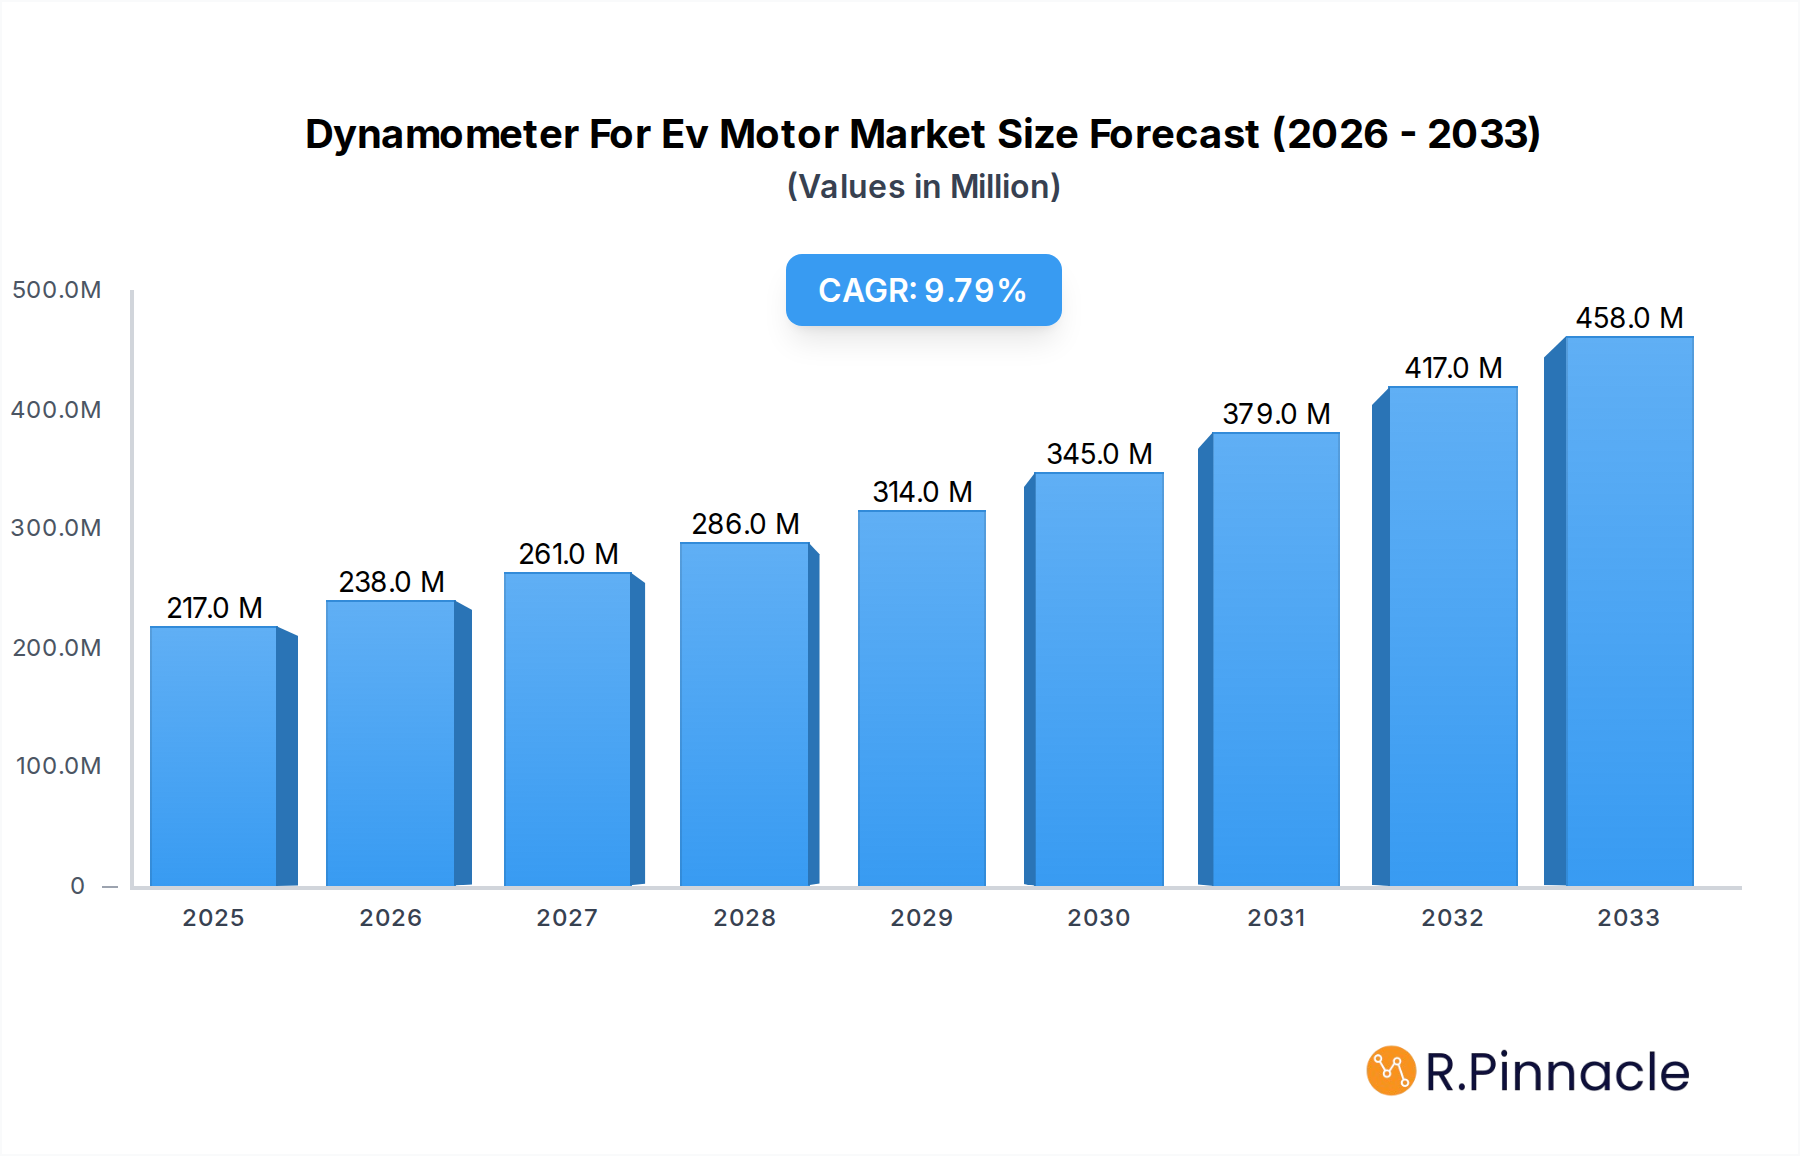
The global market for Dynamometers for EV Motors is poised for significant expansion, driven by the accelerating adoption of electric vehicles across all major automotive segments. With a current market size estimated at $217 million and projected to grow at a robust Compound Annual Growth Rate (CAGR) of 9.6% over the forecast period of 2025-2033, this sector represents a critical area of investment and innovation within the automotive testing industry. The burgeoning demand for electric cars, including Battery Electric Vehicles (BEVs) and Plug-in Hybrid Electric Vehicles (PHEVs), necessitates sophisticated and accurate testing solutions to ensure motor performance, efficiency, and reliability. This surge is further fueled by stringent government regulations mandating reduced emissions and promoting EV sales, alongside increasing consumer preference for sustainable transportation. The market's growth is also underpinned by ongoing technological advancements in EV powertrain development, requiring advanced dynamometer capabilities to simulate diverse operating conditions and validate next-generation motor technologies.

Dynamometer For Ev Motor Market Size (In Million)
The dynamometer market for EV motors is characterized by a dynamic competitive landscape, with key players such as AVL List GmbH, AIP Automotive, HORIBA, and Meidensha Corporation leading the charge in innovation and market penetration. While the market benefits from strong growth drivers, it also faces certain restraints, including the high initial investment costs associated with advanced dynamometer systems and the need for specialized technical expertise for their operation and maintenance. However, the trend towards integrated dynamometer solutions, which offer enhanced functionality and efficiency for testing both electric motors and entire powertrains, is gaining traction. Geographically, North America, Europe, and Asia Pacific are anticipated to be the leading markets, with China emerging as a particularly significant contributor due to its dominant position in global EV production. As the EV revolution continues to gain momentum, the demand for high-performance dynamometers to support research, development, and quality control in the electric motor sector is expected to remain exceptionally strong.
Dynamometer For Ev Motor Company Market Share
Dynamometer For EV Motor Market Analysis: Innovation, Dynamics, and Regional Dominance (2019-2033)
This comprehensive report provides an in-depth analysis of the global Dynamometer for EV Motor market, offering actionable insights and strategic recommendations for stakeholders. With a study period spanning from 2019 to 2033, this report leverages a robust methodology, establishing 2025 as the base and estimated year, and encompassing a forecast period from 2025 to 2033, with historical data from 2019 to 2024.
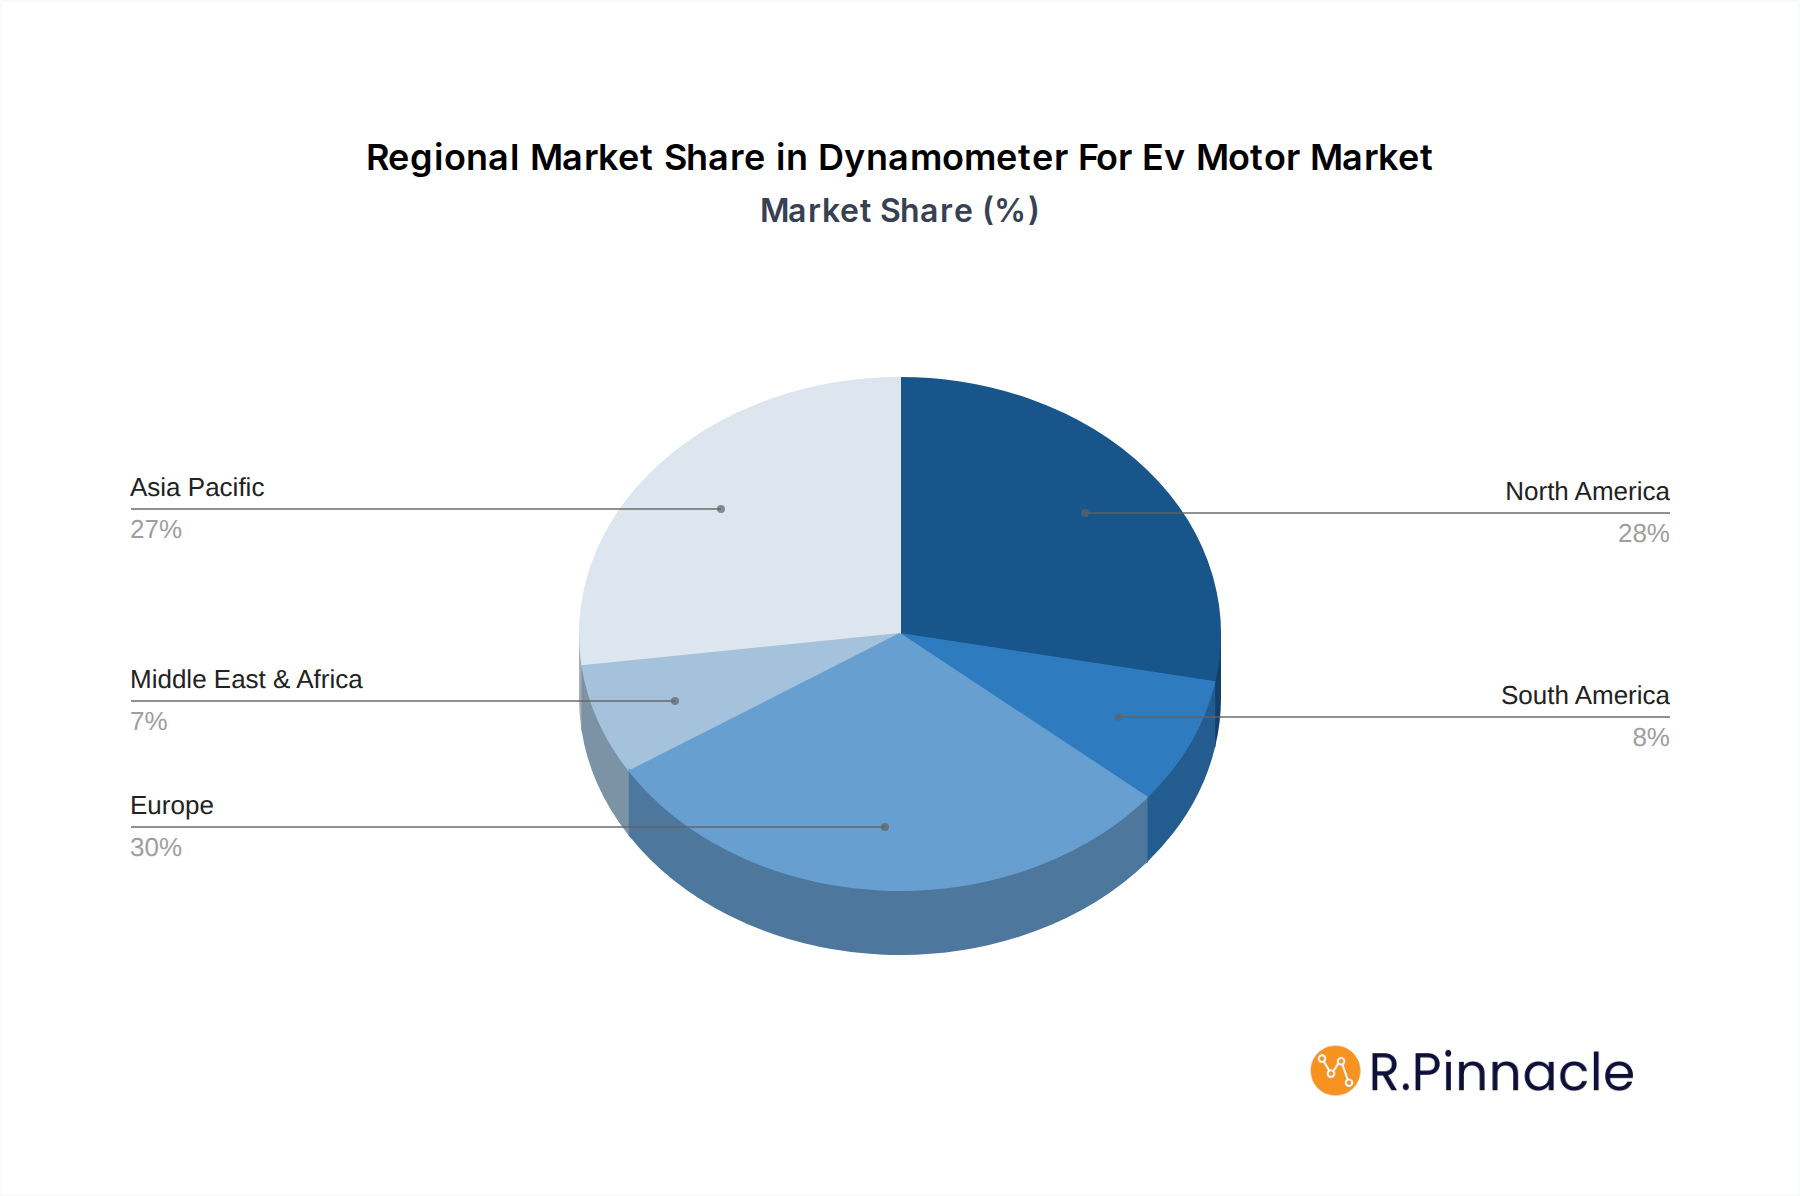
Dynamometer For Ev Motor Regional Market Share
Dynamometer For EV Motor Market Structure & Innovation Trends
The Dynamometer for EV Motor market exhibits a moderate to high level of concentration, with key players like AVL List GmbH, AIP Automotive, and HORIBA holding significant market share, estimated to be over 20 million units annually. Innovation remains a critical differentiator, driven by advancements in high-power density testing, integrated solutions, and data analytics capabilities for electric powertrains. Regulatory frameworks, particularly emissions standards and safety certifications for electric vehicles (EVs), are pivotal in shaping market demand and product development. The threat of product substitutes is minimal, given the specialized nature of dynamometer testing for EV motors. End-user demographics are predominantly automotive manufacturers, Tier-1 suppliers, and research institutions focused on EV development. Mergers and acquisitions (M&A) activities, with estimated deal values exceeding 50 million dollars, are observed as companies seek to expand their technological portfolios and geographical reach. Notable M&A activities are anticipated to drive consolidation and technological synergy, further shaping the competitive landscape.
Dynamometer For EV Motor Market Dynamics & Trends
The Dynamometer for EV Motor market is poised for substantial growth, propelled by the accelerating global adoption of electric vehicles. The increasing production volumes of Battery Electric Vehicles (BEVs) and Plug-in Hybrid Electric Vehicles (PHEVs) are creating an unprecedented demand for sophisticated testing equipment. Technological disruptions are centered around the development of higher power and torque capacity dynamometers, capable of simulating real-world driving conditions and stresses on EV powertrains. Furthermore, the integration of advanced software for data acquisition, analysis, and simulation is becoming standard, enabling manufacturers to optimize motor performance, efficiency, and durability. Consumer preferences are shifting towards EVs that offer longer range, faster charging, and enhanced performance, placing greater emphasis on rigorous motor testing and validation. This trend directly translates into a higher demand for accurate and reliable dynamometer solutions. The competitive dynamics are characterized by a blend of established players and emerging innovators, all vying for market share through product differentiation, technological advancements, and strategic partnerships. The market penetration of advanced dynamometer solutions is expected to exceed 60% within the forecast period, reflecting the industry's commitment to quality and innovation. The Compound Annual Growth Rate (CAGR) for this market is projected to be robust, estimated at over 15% for the forecast period, underscoring the sector's immense potential.
Dominant Regions & Segments in Dynamometer For EV Motor
North America and Europe currently dominate the Dynamometer for EV Motor market, driven by strong government initiatives promoting EV adoption, favorable economic policies, and a well-established automotive R&D infrastructure. The United States, with its significant investments in EV manufacturing and battery technology, stands out as a leading country. China is rapidly emerging as a key growth region, fueled by its ambitious EV production targets and supportive government policies.
- Application: BEV Dominance: Battery Electric Vehicles (BEVs) represent the largest and fastest-growing application segment. The exponential increase in BEV sales globally necessitates a corresponding surge in the demand for dynamometers capable of testing high-power electric motors and integrated powertrains. Economic policies incentivizing BEV purchases and the expansion of charging infrastructure are key drivers for this segment's dominance.
- Type: Integrated Systems: Integrated dynamometer systems, which combine motor, gearbox, and control systems for comprehensive testing, are gaining prominence. Their ability to simulate complex drivetrain interactions and provide holistic performance data offers a significant advantage over traditional free-standing setups. The ongoing trend towards advanced vehicle architectures favors integrated solutions.
- Infrastructure Development: Robust industrial infrastructure and government support for advanced manufacturing and testing facilities are critical factors contributing to regional dominance. Investments in research and development centers dedicated to electric mobility further solidify the position of leading regions.
Dynamometer For EV Motor Product Innovations
Product innovations in the Dynamometer for EV Motor sector are focused on enhanced testing precision, increased power handling capabilities, and improved data analytics. Manufacturers are developing compact and modular dynamometer solutions suitable for integrated testing of electric powertrains. Key advancements include the introduction of regenerative braking simulation, advanced thermal management testing, and real-time anomaly detection. These innovations provide automotive engineers with the tools to optimize EV motor efficiency, reduce NVH (Noise, Vibration, and Harshness), and accelerate product development cycles, offering a competitive edge in the rapidly evolving EV market.
Dynamometer For EV Motor Market Scope & Segmentation Analysis
The Dynamometer for EV Motor market is segmented by Application into BEV and PHEV.
- BEV Segment: This segment is projected to experience substantial growth, with an estimated market size exceeding 100 million dollars by 2025 and a forecast growth rate of over 18%. The increasing global adoption of battery-electric vehicles is the primary driver, demanding more sophisticated and high-capacity dynamometer solutions for testing electric motors and integrated powertrains. Competitive dynamics within this segment are characterized by a focus on high-performance testing capabilities and data accuracy.
- PHEV Segment: While not as large as the BEV segment, the PHEV segment also represents a significant market, with an estimated market size of over 50 million dollars by 2025, forecasting a growth rate of around 12%. Plug-in hybrid vehicles continue to play a crucial role in the transition to full electrification, requiring dynamometers capable of testing complex hybrid powertrains. The competitive landscape here involves solutions that can effectively simulate both electric and internal combustion engine operations.
The market is also segmented by Type into Integrated and Free Standing.
- Integrated Type: Integrated dynamometer systems are anticipated to dominate the market, with an estimated market share of over 70% by 2025. These systems offer comprehensive testing capabilities by incorporating the motor, gearbox, and control units, providing a more holistic view of powertrain performance. The demand for integrated solutions is driven by the need for greater efficiency and accuracy in testing complex EV powertrains.
- Free Standing Type: Free-standing dynamometers will continue to hold a significant market share, particularly for specialized testing or in scenarios where modularity is prioritized. Their adaptability for testing individual motor components or for specific research purposes ensures their continued relevance.
Key Drivers of Dynamometer For EV Motor Growth
The growth of the Dynamometer for EV Motor market is primarily driven by the robust expansion of the global electric vehicle industry, supported by favorable government policies and subsidies aimed at promoting EV adoption and reducing carbon emissions. Technological advancements in EV motor efficiency and performance necessitate the use of advanced dynamometers for rigorous testing and validation. The increasing focus on vehicle safety and quality standards by regulatory bodies further fuels the demand for high-precision testing equipment. Economic factors, such as fluctuating fuel prices and growing environmental awareness among consumers, also contribute to the surge in EV sales, consequently boosting the market for dynamometers.
Challenges in the Dynamometer For EV Motor Sector
Despite the promising growth, the Dynamometer for EV Motor sector faces several challenges. High initial investment costs for advanced dynamometer systems can be a barrier for smaller manufacturers and research institutions. Supply chain disruptions and the availability of specialized components can impact production timelines and costs. Intense competition from established players and emerging market entrants exerts pressure on pricing and profit margins. Furthermore, the rapid pace of technological evolution in EVs requires continuous updates and recalibration of testing equipment, adding to the ongoing operational costs and demanding skilled personnel for operation and maintenance.
Emerging Opportunities in Dynamometer For EV Motor
Emerging opportunities within the Dynamometer for EV Motor market lie in the development of smart, connected dynamometers integrated with AI and IoT capabilities for predictive maintenance and remote diagnostics. The growing demand for testing and validation of advanced EV components, such as in-wheel motors and electric driveshafts, presents new market niches. Expansion into emerging economies with rapidly growing EV markets offers significant growth potential. Furthermore, the development of solutions for testing high-voltage systems and specialized EV applications, like electric trucks and buses, opens up new avenues for market penetration and revenue generation.
Leading Players in the Dynamometer For EV Motor Market
- AVL List GmbH
- AIP Automotive
- HORIBA
- Meidensha Corporation
- Mustang Advanced Engineering
- Maturo GmbH
- Anhui Jingke Testing Technology Co.,Ltd.
- innco systems GmbH
- MTS
- Power Test
- MAHA
- Ono Sokki
- Rototest
- KRATZER
- Sierra Instruments
- SNT
- Dynapack
- SAJ Test
Key Developments in Dynamometer For EV Motor Industry
- 2023: AVL List GmbH launches a new series of high-power dynamometers designed for the latest generation of EV powertrains, enhancing testing efficiency by 20%.
- 2023: HORIBA introduces advanced simulation software that integrates seamlessly with their dynamometer systems, enabling more realistic testing scenarios for EV motors.
- 2024: AIP Automotive expands its product portfolio with compact, modular dynamometers tailored for testing individual EV motor components, catering to niche R&D requirements.
- 2024: Meidensha Corporation announces strategic partnerships with key EV battery manufacturers to develop integrated testing solutions for complete electric powertrains.
- 2025: Mustang Advanced Engineering unveils a new line of dynamometers with enhanced regenerative braking simulation capabilities, crucial for optimizing EV energy recovery.
Future Outlook for Dynamometer For EV Motor Market
The future outlook for the Dynamometer for EV Motor market is exceptionally bright, characterized by sustained high growth driven by the unwavering commitment of global automotive manufacturers to electrification. Advancements in battery technology, charging infrastructure, and autonomous driving features will continue to shape the requirements for EV motor testing, necessitating continuous innovation in dynamometer solutions. The market will witness an increasing trend towards digitalization, with an emphasis on smart testing, data-driven insights, and integrated R&D platforms. Strategic collaborations, technological acquisitions, and the expansion into underserved geographical markets will be key to maintaining a competitive edge and capitalizing on the vast opportunities presented by the ongoing global transition to electric mobility.
Dynamometer For Ev Motor Segmentation
-
1. Application
- 1.1. BEV
- 1.2. PHEV
-
2. Type
- 2.1. Integrated
- 2.2. Free Standing
Dynamometer For Ev Motor Segmentation By Geography
-
1. North America
- 1.1. United States
- 1.2. Canada
- 1.3. Mexico
-
2. South America
- 2.1. Brazil
- 2.2. Argentina
- 2.3. Rest of South America
-
3. Europe
- 3.1. United Kingdom
- 3.2. Germany
- 3.3. France
- 3.4. Italy
- 3.5. Spain
- 3.6. Russia
- 3.7. Benelux
- 3.8. Nordics
- 3.9. Rest of Europe
-
4. Middle East & Africa
- 4.1. Turkey
- 4.2. Israel
- 4.3. GCC
- 4.4. North Africa
- 4.5. South Africa
- 4.6. Rest of Middle East & Africa
-
5. Asia Pacific
- 5.1. China
- 5.2. India
- 5.3. Japan
- 5.4. South Korea
- 5.5. ASEAN
- 5.6. Oceania
- 5.7. Rest of Asia Pacific
Dynamometer For Ev Motor Regional Market Share
Geographic Coverage of Dynamometer For Ev Motor
Dynamometer For Ev Motor REPORT HIGHLIGHTS
| Aspects | Details |
|---|---|
| Study Period | 2020-2034 |
| Base Year | 2025 |
| Estimated Year | 2026 |
| Forecast Period | 2026-2034 |
| Historical Period | 2020-2025 |
| Growth Rate | CAGR of 9.6% from 2020-2034 |
| Segmentation |
|
Table of Contents
- 1. Introduction
- 1.1. Research Scope
- 1.2. Market Segmentation
- 1.3. Research Methodology
- 1.4. Definitions and Assumptions
- 2. Executive Summary
- 2.1. Introduction
- 3. Market Dynamics
- 3.1. Introduction
- 3.2. Market Drivers
- 3.3. Market Restrains
- 3.4. Market Trends
- 4. Market Factor Analysis
- 4.1. Porters Five Forces
- 4.2. Supply/Value Chain
- 4.3. PESTEL analysis
- 4.4. Market Entropy
- 4.5. Patent/Trademark Analysis
- 5. Global Dynamometer For Ev Motor Analysis, Insights and Forecast, 2020-2032
- 5.1. Market Analysis, Insights and Forecast - by Application
- 5.1.1. BEV
- 5.1.2. PHEV
- 5.2. Market Analysis, Insights and Forecast - by Type
- 5.2.1. Integrated
- 5.2.2. Free Standing
- 5.3. Market Analysis, Insights and Forecast - by Region
- 5.3.1. North America
- 5.3.2. South America
- 5.3.3. Europe
- 5.3.4. Middle East & Africa
- 5.3.5. Asia Pacific
- 5.1. Market Analysis, Insights and Forecast - by Application
- 6. North America Dynamometer For Ev Motor Analysis, Insights and Forecast, 2020-2032
- 6.1. Market Analysis, Insights and Forecast - by Application
- 6.1.1. BEV
- 6.1.2. PHEV
- 6.2. Market Analysis, Insights and Forecast - by Type
- 6.2.1. Integrated
- 6.2.2. Free Standing
- 6.1. Market Analysis, Insights and Forecast - by Application
- 7. South America Dynamometer For Ev Motor Analysis, Insights and Forecast, 2020-2032
- 7.1. Market Analysis, Insights and Forecast - by Application
- 7.1.1. BEV
- 7.1.2. PHEV
- 7.2. Market Analysis, Insights and Forecast - by Type
- 7.2.1. Integrated
- 7.2.2. Free Standing
- 7.1. Market Analysis, Insights and Forecast - by Application
- 8. Europe Dynamometer For Ev Motor Analysis, Insights and Forecast, 2020-2032
- 8.1. Market Analysis, Insights and Forecast - by Application
- 8.1.1. BEV
- 8.1.2. PHEV
- 8.2. Market Analysis, Insights and Forecast - by Type
- 8.2.1. Integrated
- 8.2.2. Free Standing
- 8.1. Market Analysis, Insights and Forecast - by Application
- 9. Middle East & Africa Dynamometer For Ev Motor Analysis, Insights and Forecast, 2020-2032
- 9.1. Market Analysis, Insights and Forecast - by Application
- 9.1.1. BEV
- 9.1.2. PHEV
- 9.2. Market Analysis, Insights and Forecast - by Type
- 9.2.1. Integrated
- 9.2.2. Free Standing
- 9.1. Market Analysis, Insights and Forecast - by Application
- 10. Asia Pacific Dynamometer For Ev Motor Analysis, Insights and Forecast, 2020-2032
- 10.1. Market Analysis, Insights and Forecast - by Application
- 10.1.1. BEV
- 10.1.2. PHEV
- 10.2. Market Analysis, Insights and Forecast - by Type
- 10.2.1. Integrated
- 10.2.2. Free Standing
- 10.1. Market Analysis, Insights and Forecast - by Application
- 11. Competitive Analysis
- 11.1. Global Market Share Analysis 2025
- 11.2. Company Profiles
- 11.2.1 AVL List GmbH
- 11.2.1.1. Overview
- 11.2.1.2. Products
- 11.2.1.3. SWOT Analysis
- 11.2.1.4. Recent Developments
- 11.2.1.5. Financials (Based on Availability)
- 11.2.2 AIP Automotive
- 11.2.2.1. Overview
- 11.2.2.2. Products
- 11.2.2.3. SWOT Analysis
- 11.2.2.4. Recent Developments
- 11.2.2.5. Financials (Based on Availability)
- 11.2.3 HORIBA
- 11.2.3.1. Overview
- 11.2.3.2. Products
- 11.2.3.3. SWOT Analysis
- 11.2.3.4. Recent Developments
- 11.2.3.5. Financials (Based on Availability)
- 11.2.4 Meidensha Corporation
- 11.2.4.1. Overview
- 11.2.4.2. Products
- 11.2.4.3. SWOT Analysis
- 11.2.4.4. Recent Developments
- 11.2.4.5. Financials (Based on Availability)
- 11.2.5 Mustang Advanced Engineering
- 11.2.5.1. Overview
- 11.2.5.2. Products
- 11.2.5.3. SWOT Analysis
- 11.2.5.4. Recent Developments
- 11.2.5.5. Financials (Based on Availability)
- 11.2.6 Maturo GmbH
- 11.2.6.1. Overview
- 11.2.6.2. Products
- 11.2.6.3. SWOT Analysis
- 11.2.6.4. Recent Developments
- 11.2.6.5. Financials (Based on Availability)
- 11.2.7 Anhui Jingke Testing Technology Co.
- 11.2.7.1. Overview
- 11.2.7.2. Products
- 11.2.7.3. SWOT Analysis
- 11.2.7.4. Recent Developments
- 11.2.7.5. Financials (Based on Availability)
- 11.2.8 Ltd.
- 11.2.8.1. Overview
- 11.2.8.2. Products
- 11.2.8.3. SWOT Analysis
- 11.2.8.4. Recent Developments
- 11.2.8.5. Financials (Based on Availability)
- 11.2.9 innco systems GmbH
- 11.2.9.1. Overview
- 11.2.9.2. Products
- 11.2.9.3. SWOT Analysis
- 11.2.9.4. Recent Developments
- 11.2.9.5. Financials (Based on Availability)
- 11.2.10 MTS
- 11.2.10.1. Overview
- 11.2.10.2. Products
- 11.2.10.3. SWOT Analysis
- 11.2.10.4. Recent Developments
- 11.2.10.5. Financials (Based on Availability)
- 11.2.11 Power Test
- 11.2.11.1. Overview
- 11.2.11.2. Products
- 11.2.11.3. SWOT Analysis
- 11.2.11.4. Recent Developments
- 11.2.11.5. Financials (Based on Availability)
- 11.2.12 MAHA
- 11.2.12.1. Overview
- 11.2.12.2. Products
- 11.2.12.3. SWOT Analysis
- 11.2.12.4. Recent Developments
- 11.2.12.5. Financials (Based on Availability)
- 11.2.13 Ono Sokki
- 11.2.13.1. Overview
- 11.2.13.2. Products
- 11.2.13.3. SWOT Analysis
- 11.2.13.4. Recent Developments
- 11.2.13.5. Financials (Based on Availability)
- 11.2.14 Rototest
- 11.2.14.1. Overview
- 11.2.14.2. Products
- 11.2.14.3. SWOT Analysis
- 11.2.14.4. Recent Developments
- 11.2.14.5. Financials (Based on Availability)
- 11.2.15 KRATZER
- 11.2.15.1. Overview
- 11.2.15.2. Products
- 11.2.15.3. SWOT Analysis
- 11.2.15.4. Recent Developments
- 11.2.15.5. Financials (Based on Availability)
- 11.2.16 Sierra Instruments
- 11.2.16.1. Overview
- 11.2.16.2. Products
- 11.2.16.3. SWOT Analysis
- 11.2.16.4. Recent Developments
- 11.2.16.5. Financials (Based on Availability)
- 11.2.17 SNT
- 11.2.17.1. Overview
- 11.2.17.2. Products
- 11.2.17.3. SWOT Analysis
- 11.2.17.4. Recent Developments
- 11.2.17.5. Financials (Based on Availability)
- 11.2.18 Dynapack
- 11.2.18.1. Overview
- 11.2.18.2. Products
- 11.2.18.3. SWOT Analysis
- 11.2.18.4. Recent Developments
- 11.2.18.5. Financials (Based on Availability)
- 11.2.19 SAJ Test
- 11.2.19.1. Overview
- 11.2.19.2. Products
- 11.2.19.3. SWOT Analysis
- 11.2.19.4. Recent Developments
- 11.2.19.5. Financials (Based on Availability)
- 11.2.1 AVL List GmbH
List of Figures
- Figure 1: Global Dynamometer For Ev Motor Revenue Breakdown (million, %) by Region 2025 & 2033
- Figure 2: North America Dynamometer For Ev Motor Revenue (million), by Application 2025 & 2033
- Figure 3: North America Dynamometer For Ev Motor Revenue Share (%), by Application 2025 & 2033
- Figure 4: North America Dynamometer For Ev Motor Revenue (million), by Type 2025 & 2033
- Figure 5: North America Dynamometer For Ev Motor Revenue Share (%), by Type 2025 & 2033
- Figure 6: North America Dynamometer For Ev Motor Revenue (million), by Country 2025 & 2033
- Figure 7: North America Dynamometer For Ev Motor Revenue Share (%), by Country 2025 & 2033
- Figure 8: South America Dynamometer For Ev Motor Revenue (million), by Application 2025 & 2033
- Figure 9: South America Dynamometer For Ev Motor Revenue Share (%), by Application 2025 & 2033
- Figure 10: South America Dynamometer For Ev Motor Revenue (million), by Type 2025 & 2033
- Figure 11: South America Dynamometer For Ev Motor Revenue Share (%), by Type 2025 & 2033
- Figure 12: South America Dynamometer For Ev Motor Revenue (million), by Country 2025 & 2033
- Figure 13: South America Dynamometer For Ev Motor Revenue Share (%), by Country 2025 & 2033
- Figure 14: Europe Dynamometer For Ev Motor Revenue (million), by Application 2025 & 2033
- Figure 15: Europe Dynamometer For Ev Motor Revenue Share (%), by Application 2025 & 2033
- Figure 16: Europe Dynamometer For Ev Motor Revenue (million), by Type 2025 & 2033
- Figure 17: Europe Dynamometer For Ev Motor Revenue Share (%), by Type 2025 & 2033
- Figure 18: Europe Dynamometer For Ev Motor Revenue (million), by Country 2025 & 2033
- Figure 19: Europe Dynamometer For Ev Motor Revenue Share (%), by Country 2025 & 2033
- Figure 20: Middle East & Africa Dynamometer For Ev Motor Revenue (million), by Application 2025 & 2033
- Figure 21: Middle East & Africa Dynamometer For Ev Motor Revenue Share (%), by Application 2025 & 2033
- Figure 22: Middle East & Africa Dynamometer For Ev Motor Revenue (million), by Type 2025 & 2033
- Figure 23: Middle East & Africa Dynamometer For Ev Motor Revenue Share (%), by Type 2025 & 2033
- Figure 24: Middle East & Africa Dynamometer For Ev Motor Revenue (million), by Country 2025 & 2033
- Figure 25: Middle East & Africa Dynamometer For Ev Motor Revenue Share (%), by Country 2025 & 2033
- Figure 26: Asia Pacific Dynamometer For Ev Motor Revenue (million), by Application 2025 & 2033
- Figure 27: Asia Pacific Dynamometer For Ev Motor Revenue Share (%), by Application 2025 & 2033
- Figure 28: Asia Pacific Dynamometer For Ev Motor Revenue (million), by Type 2025 & 2033
- Figure 29: Asia Pacific Dynamometer For Ev Motor Revenue Share (%), by Type 2025 & 2033
- Figure 30: Asia Pacific Dynamometer For Ev Motor Revenue (million), by Country 2025 & 2033
- Figure 31: Asia Pacific Dynamometer For Ev Motor Revenue Share (%), by Country 2025 & 2033
List of Tables
- Table 1: Global Dynamometer For Ev Motor Revenue million Forecast, by Application 2020 & 2033
- Table 2: Global Dynamometer For Ev Motor Revenue million Forecast, by Type 2020 & 2033
- Table 3: Global Dynamometer For Ev Motor Revenue million Forecast, by Region 2020 & 2033
- Table 4: Global Dynamometer For Ev Motor Revenue million Forecast, by Application 2020 & 2033
- Table 5: Global Dynamometer For Ev Motor Revenue million Forecast, by Type 2020 & 2033
- Table 6: Global Dynamometer For Ev Motor Revenue million Forecast, by Country 2020 & 2033
- Table 7: United States Dynamometer For Ev Motor Revenue (million) Forecast, by Application 2020 & 2033
- Table 8: Canada Dynamometer For Ev Motor Revenue (million) Forecast, by Application 2020 & 2033
- Table 9: Mexico Dynamometer For Ev Motor Revenue (million) Forecast, by Application 2020 & 2033
- Table 10: Global Dynamometer For Ev Motor Revenue million Forecast, by Application 2020 & 2033
- Table 11: Global Dynamometer For Ev Motor Revenue million Forecast, by Type 2020 & 2033
- Table 12: Global Dynamometer For Ev Motor Revenue million Forecast, by Country 2020 & 2033
- Table 13: Brazil Dynamometer For Ev Motor Revenue (million) Forecast, by Application 2020 & 2033
- Table 14: Argentina Dynamometer For Ev Motor Revenue (million) Forecast, by Application 2020 & 2033
- Table 15: Rest of South America Dynamometer For Ev Motor Revenue (million) Forecast, by Application 2020 & 2033
- Table 16: Global Dynamometer For Ev Motor Revenue million Forecast, by Application 2020 & 2033
- Table 17: Global Dynamometer For Ev Motor Revenue million Forecast, by Type 2020 & 2033
- Table 18: Global Dynamometer For Ev Motor Revenue million Forecast, by Country 2020 & 2033
- Table 19: United Kingdom Dynamometer For Ev Motor Revenue (million) Forecast, by Application 2020 & 2033
- Table 20: Germany Dynamometer For Ev Motor Revenue (million) Forecast, by Application 2020 & 2033
- Table 21: France Dynamometer For Ev Motor Revenue (million) Forecast, by Application 2020 & 2033
- Table 22: Italy Dynamometer For Ev Motor Revenue (million) Forecast, by Application 2020 & 2033
- Table 23: Spain Dynamometer For Ev Motor Revenue (million) Forecast, by Application 2020 & 2033
- Table 24: Russia Dynamometer For Ev Motor Revenue (million) Forecast, by Application 2020 & 2033
- Table 25: Benelux Dynamometer For Ev Motor Revenue (million) Forecast, by Application 2020 & 2033
- Table 26: Nordics Dynamometer For Ev Motor Revenue (million) Forecast, by Application 2020 & 2033
- Table 27: Rest of Europe Dynamometer For Ev Motor Revenue (million) Forecast, by Application 2020 & 2033
- Table 28: Global Dynamometer For Ev Motor Revenue million Forecast, by Application 2020 & 2033
- Table 29: Global Dynamometer For Ev Motor Revenue million Forecast, by Type 2020 & 2033
- Table 30: Global Dynamometer For Ev Motor Revenue million Forecast, by Country 2020 & 2033
- Table 31: Turkey Dynamometer For Ev Motor Revenue (million) Forecast, by Application 2020 & 2033
- Table 32: Israel Dynamometer For Ev Motor Revenue (million) Forecast, by Application 2020 & 2033
- Table 33: GCC Dynamometer For Ev Motor Revenue (million) Forecast, by Application 2020 & 2033
- Table 34: North Africa Dynamometer For Ev Motor Revenue (million) Forecast, by Application 2020 & 2033
- Table 35: South Africa Dynamometer For Ev Motor Revenue (million) Forecast, by Application 2020 & 2033
- Table 36: Rest of Middle East & Africa Dynamometer For Ev Motor Revenue (million) Forecast, by Application 2020 & 2033
- Table 37: Global Dynamometer For Ev Motor Revenue million Forecast, by Application 2020 & 2033
- Table 38: Global Dynamometer For Ev Motor Revenue million Forecast, by Type 2020 & 2033
- Table 39: Global Dynamometer For Ev Motor Revenue million Forecast, by Country 2020 & 2033
- Table 40: China Dynamometer For Ev Motor Revenue (million) Forecast, by Application 2020 & 2033
- Table 41: India Dynamometer For Ev Motor Revenue (million) Forecast, by Application 2020 & 2033
- Table 42: Japan Dynamometer For Ev Motor Revenue (million) Forecast, by Application 2020 & 2033
- Table 43: South Korea Dynamometer For Ev Motor Revenue (million) Forecast, by Application 2020 & 2033
- Table 44: ASEAN Dynamometer For Ev Motor Revenue (million) Forecast, by Application 2020 & 2033
- Table 45: Oceania Dynamometer For Ev Motor Revenue (million) Forecast, by Application 2020 & 2033
- Table 46: Rest of Asia Pacific Dynamometer For Ev Motor Revenue (million) Forecast, by Application 2020 & 2033
Frequently Asked Questions
1. What is the projected Compound Annual Growth Rate (CAGR) of the Dynamometer For Ev Motor?
The projected CAGR is approximately 9.6%.
2. Which companies are prominent players in the Dynamometer For Ev Motor?
Key companies in the market include AVL List GmbH, AIP Automotive, HORIBA, Meidensha Corporation, Mustang Advanced Engineering, Maturo GmbH, Anhui Jingke Testing Technology Co., Ltd., innco systems GmbH, MTS, Power Test, MAHA, Ono Sokki, Rototest, KRATZER, Sierra Instruments, SNT, Dynapack, SAJ Test.
3. What are the main segments of the Dynamometer For Ev Motor?
The market segments include Application, Type.
4. Can you provide details about the market size?
The market size is estimated to be USD 217 million as of 2022.
5. What are some drivers contributing to market growth?
N/A
6. What are the notable trends driving market growth?
N/A
7. Are there any restraints impacting market growth?
N/A
8. Can you provide examples of recent developments in the market?
N/A
9. What pricing options are available for accessing the report?
Pricing options include single-user, multi-user, and enterprise licenses priced at USD 4900.00, USD 7350.00, and USD 9800.00 respectively.
10. Is the market size provided in terms of value or volume?
The market size is provided in terms of value, measured in million.
11. Are there any specific market keywords associated with the report?
Yes, the market keyword associated with the report is "Dynamometer For Ev Motor," which aids in identifying and referencing the specific market segment covered.
12. How do I determine which pricing option suits my needs best?
The pricing options vary based on user requirements and access needs. Individual users may opt for single-user licenses, while businesses requiring broader access may choose multi-user or enterprise licenses for cost-effective access to the report.
13. Are there any additional resources or data provided in the Dynamometer For Ev Motor report?
While the report offers comprehensive insights, it's advisable to review the specific contents or supplementary materials provided to ascertain if additional resources or data are available.
14. How can I stay updated on further developments or reports in the Dynamometer For Ev Motor?
To stay informed about further developments, trends, and reports in the Dynamometer For Ev Motor, consider subscribing to industry newsletters, following relevant companies and organizations, or regularly checking reputable industry news sources and publications.
Methodology
Step 1 - Identification of Relevant Samples Size from Population Database


Step 2 - Approaches for Defining Global Market Size (Value, Volume* & Price*)

Note*: In applicable scenarios
Step 3 - Data Sources
Primary Research
- Web Analytics
- Survey Reports
- Research Institute
- Latest Research Reports
- Opinion Leaders
Secondary Research
- Annual Reports
- White Paper
- Latest Press Release
- Industry Association
- Paid Database
- Investor Presentations

Step 4 - Data Triangulation
Involves using different sources of information in order to increase the validity of a study
These sources are likely to be stakeholders in a program - participants, other researchers, program staff, other community members, and so on.
Then we put all data in single framework & apply various statistical tools to find out the dynamic on the market.
During the analysis stage, feedback from the stakeholder groups would be compared to determine areas of agreement as well as areas of divergence