

Key Insights
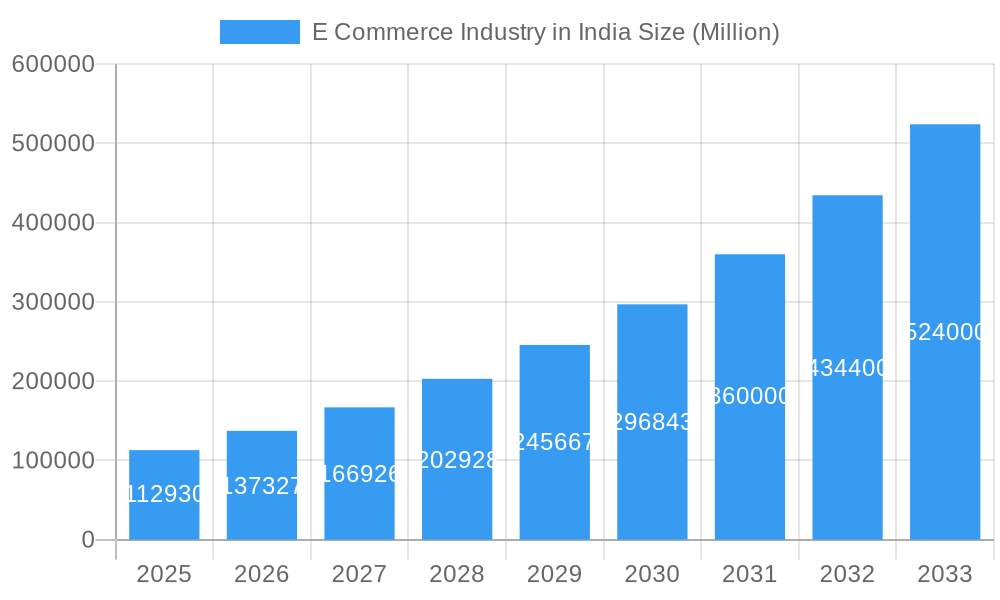
The Indian e-commerce market, valued at $112.93 billion in 2025, is experiencing explosive growth, projected to expand at a Compound Annual Growth Rate (CAGR) of 21.50% from 2025 to 2033. This surge is fueled by several key factors. Increased internet and smartphone penetration across diverse demographics, particularly in rural areas, is driving adoption. A burgeoning young population comfortable with online shopping contributes significantly. Furthermore, the expanding logistics infrastructure and government initiatives promoting digitalization are facilitating seamless deliveries and transactions. Competitive pricing strategies employed by major players like Amazon, Flipkart, and others, along with attractive payment options and a wide selection of products, further stimulate market growth. While challenges such as digital literacy gaps in certain regions and concerns about cybersecurity persist, these are being progressively addressed through technological advancements and consumer education.
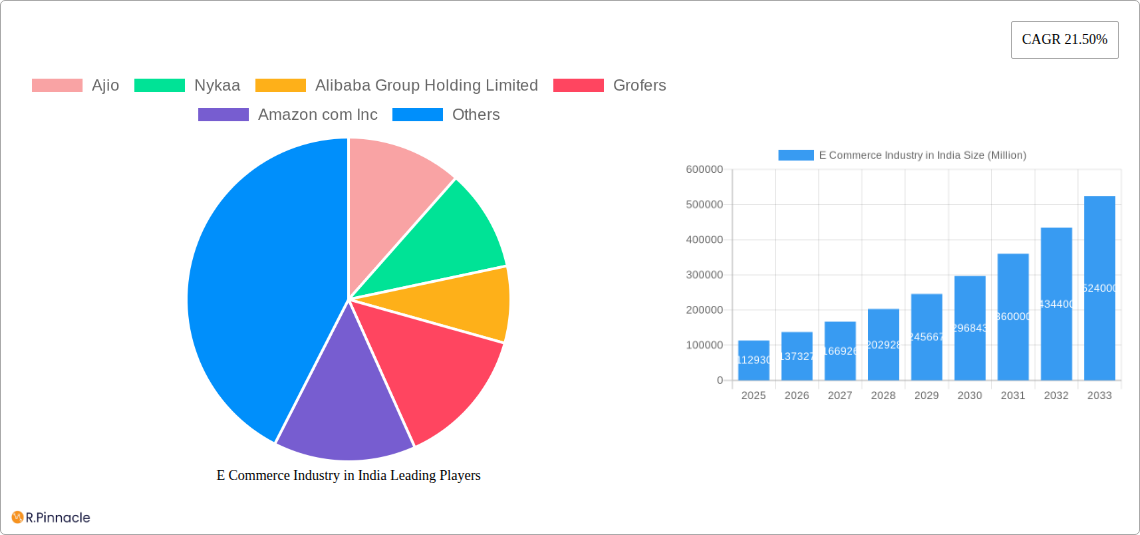
E Commerce Industry in India Market Size (In Billion)
Growth is expected to be particularly robust in segments like fashion and beauty (driven by players like Ajio, Nykaa, and Purplle), groceries (with Grofers and others leading the way), and electronics (with strong participation from established players such as Amazon and Flipkart). Regional variations are apparent, with potentially higher growth in less penetrated markets like East and South India as infrastructure improves and online shopping habits become more ingrained. The forecast suggests continued dominance of major players, though smaller, niche e-commerce businesses are also likely to emerge and find success by catering to specific consumer needs and preferences. The overall picture paints a vibrant and dynamic market with significant opportunities for both established players and new entrants.
E Commerce Industry in India Company Market Share
E-Commerce Industry in India: A Comprehensive Market Report (2019-2033)
This in-depth report provides a comprehensive analysis of the Indian e-commerce market, offering invaluable insights for industry professionals, investors, and strategists. With a study period spanning 2019-2033, a base year of 2025, and an estimated year of 2025, this report forecasts market trends until 2033, leveraging data from the historical period of 2019-2024. The report covers key market segments, leading players like Amazon, Flipkart, and Nykaa, and analyzes the significant impact of recent investments and technological advancements. Expect detailed breakdowns of market size (in Millions), CAGR, and competitive dynamics, enabling informed decision-making and strategic planning within this rapidly evolving sector.
E-Commerce Industry in India Market Structure & Innovation Trends
This section analyzes the competitive landscape of the Indian e-commerce market, examining market concentration, innovation drivers, regulatory frameworks, and key industry trends. We delve into the impact of mergers and acquisitions (M&A) activities, assessing their influence on market share and competitive dynamics. The report uses data from 2019-2024 to establish a robust historical foundation for future projections.
- Market Concentration: The Indian e-commerce market is dominated by a few major players, with Amazon and Flipkart holding significant market share. However, several smaller players are also emerging, particularly in niche segments. Estimates suggest Amazon holds approximately xx% market share and Flipkart approximately xx%, with the remaining xx% split amongst numerous other players.
- Innovation Drivers: Factors such as increasing smartphone penetration, improving digital literacy, and government initiatives promoting digitalization are driving innovation. The emergence of technologies like AI and machine learning is enhancing personalization and improving logistics efficiency.
- Regulatory Frameworks: Government regulations, including those related to data privacy and e-commerce practices, are shaping the market landscape. The evolving regulatory environment is a key consideration for companies operating within this market.
- M&A Activities: The e-commerce sector has witnessed significant M&A activity in recent years. Deals are driven by strategies to consolidate market share, expand into new segments, and access new technologies. The total value of M&A deals in the period 2019-2024 is estimated at approximately INR xx Million.
E-Commerce Industry in India Market Dynamics & Trends
This section explores the dynamic forces shaping the Indian e-commerce landscape. We examine market growth drivers, technological disruptions, evolving consumer preferences, and the intensifying competitive dynamics. Specific metrics, including the Compound Annual Growth Rate (CAGR) and market penetration rates, are analyzed to project future market trajectories. The analysis is based on data from 2019 to 2024, with projections extending to 2033.
The Indian e-commerce market is experiencing robust growth, driven by factors such as rising disposable incomes, increased internet and smartphone penetration, and changing consumer lifestyles. The CAGR for the period 2025-2033 is projected at xx%. Market penetration, currently at approximately xx%, is expected to increase significantly over the forecast period, driven by the expansion of e-commerce to more rural areas. Technological advancements, particularly in areas like mobile payments and logistics, are further accelerating growth. The intensifying competition among established players and new entrants is shaping market dynamics, with strategies focusing on enhancing customer experience, improving delivery times, and expanding product offerings.
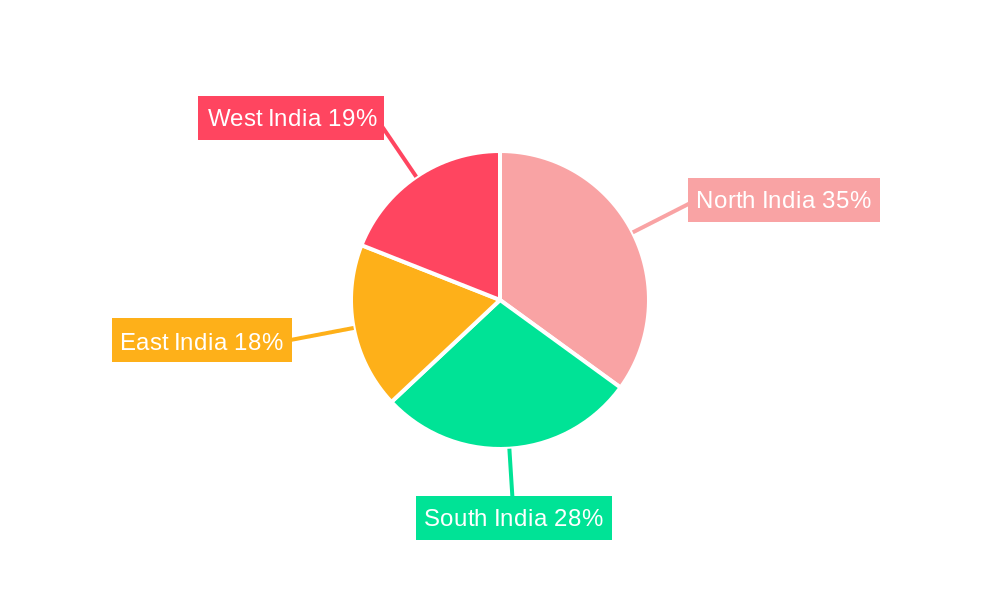
Dominant Regions & Segments in E-Commerce Industry in India
This section identifies the leading regions and segments within the Indian e-commerce market, analyzing the factors contributing to their dominance. We use data from 2019-2024 and forecasts to 2033 to present a comprehensive overview. The analysis focuses on Market Segmentation - by Application.
- Key Drivers of Regional Dominance:
- Urban Centers: Higher internet and smartphone penetration, greater disposable incomes, and established logistics networks contribute to the dominance of major metropolitan areas.
- Tier 2 and Tier 3 Cities: Rapidly increasing internet and smartphone adoption, coupled with government initiatives focused on digital inclusion, are driving growth in these areas.
- Dominant Segments: Within the Market Segmentation - by Application, the xx segment holds the largest market share, projected to reach xx Million by 2033, driven by factors such as increasing demand and favorable government policies. Other segments (specific segments of Market Segmentation - by Application) are also witnessing significant growth, though at varying paces.
E-Commerce Industry in India Product Innovations
This section summarizes recent product developments and applications within the Indian e-commerce sector, highlighting technological advancements that are enhancing customer experience and driving market expansion. The analysis focuses on the competitive advantages gained by companies through innovative product offerings.
Recent innovations focus on improving customer experience and personalization. AI-powered recommendation engines, advanced search functionalities, and seamless mobile interfaces are enhancing customer engagement. Technological advancements in logistics, including drone delivery and automated warehouses, are improving efficiency and reducing delivery times. Companies are also increasingly focusing on offering customized product experiences and providing enhanced value-added services.
Report Scope & Segmentation Analysis
This section details the scope of the report and provides a comprehensive breakdown of the market segmentation by application. Growth projections, market sizes, and competitive dynamics for each segment are presented.
The report comprehensively analyzes the Indian e-commerce market, focusing on Market Segmentation - by Application (detailed description of market segmentation by application is needed here). Each segment’s growth trajectory is detailed, with specific market size projections for 2025 and 2033, and an analysis of the competitive landscape within each segment.
Key Drivers of E-Commerce Industry in India Growth
This section outlines the key factors driving the growth of the Indian e-commerce industry. The analysis focuses on technological, economic, and regulatory factors with specific examples to provide a clear understanding of these influential forces.
Technological advancements, such as the proliferation of smartphones and high-speed internet, have played a crucial role. Economic growth and rising disposable incomes are fuelling consumer spending. Furthermore, government initiatives promoting digitalization and favorable regulatory policies create a conducive environment for market expansion.
Challenges in the E Commerce Industry in India Sector
This section discusses the challenges faced by the Indian e-commerce industry. The analysis focuses on quantifiable impacts of regulatory hurdles, supply chain issues, and intense competition.
Significant challenges include infrastructure limitations in certain regions, particularly regarding logistics and internet connectivity. The intense competition amongst existing players can create pricing pressures. Additionally, regulatory changes and potential policy shifts can create uncertainty for businesses.
Emerging Opportunities in E Commerce Industry in India
This section highlights emerging trends and opportunities within the Indian e-commerce sector. The analysis focuses on new markets, technologies, and evolving consumer preferences.
The expansion of e-commerce into rural areas presents significant opportunities. The increasing adoption of digital payment methods is also opening up new avenues for growth. Furthermore, the rise of social commerce and the growing demand for personalized experiences are creating exciting possibilities for innovation and market expansion.
Leading Players in the E Commerce Industry in India Market
This section lists the leading players in the Indian e-commerce market.
Key Developments in E Commerce Industry in India Industry
This section details key developments in the Indian e-commerce industry.
- June 2023: Amazon commits to investing an additional USD 15 billion in India over the next seven years, bringing its total investment to USD 26 billion. This signifies a strong commitment to the Indian market and will likely have a significant impact on market dynamics. The company aims to digitize 10 million small businesses, enable USD 20 billion in exports, and create two million jobs.
- January 2023: Flipkart's Singapore-based parent invests INR 722 Cr (USD 90 Million) in its Indian marketplace arm. This injection of capital will bolster Flipkart's competitive position and potentially fuel further expansion and innovation.
Future Outlook for E Commerce Industry in India Market
This section summarizes the growth accelerators and future market potential of the Indian e-commerce sector. The analysis highlights strategic opportunities for businesses operating within this dynamic market.
The Indian e-commerce market is poised for continued strong growth, driven by increasing internet and smartphone penetration, rising disposable incomes, and a growing preference for online shopping. This presents significant opportunities for companies to expand their market share and capitalize on the burgeoning demand for e-commerce services. Innovation in areas such as logistics, payment systems, and personalized customer experiences will be crucial for success in this competitive market.
E Commerce Industry in India Segmentation
-
1. B2C E-commerce
- 1.1. Beauty and Personal Care
- 1.2. Consumer Electronics
- 1.3. Fashion and Apparel
- 1.4. Food and Beverage
- 1.5. Furniture and Home
- 1.6. Other Applications (Toys, DIY, Media, Etc.)
-
2. Business models
- 2.1. B2C E-commerce
- 2.2. B2B E-commerce
-
3. Geography
- 3.1. Tier-I cities
- 3.2. Tier-II and tier-III cities
E Commerce Industry in India Segmentation By Geography
-
1. North America
- 1.1. United States
- 1.2. Canada
- 1.3. Mexico
-
2. South America
- 2.1. Brazil
- 2.2. Argentina
- 2.3. Rest of South America
-
3. Europe
- 3.1. United Kingdom
- 3.2. Germany
- 3.3. France
- 3.4. Italy
- 3.5. Spain
- 3.6. Russia
- 3.7. Benelux
- 3.8. Nordics
- 3.9. Rest of Europe
-
4. Middle East & Africa
- 4.1. Turkey
- 4.2. Israel
- 4.3. GCC
- 4.4. North Africa
- 4.5. South Africa
- 4.6. Rest of Middle East & Africa
-
5. Asia Pacific
- 5.1. China
- 5.2. India
- 5.3. Japan
- 5.4. South Korea
- 5.5. ASEAN
- 5.6. Oceania
- 5.7. Rest of Asia Pacific
E Commerce Industry in India Regional Market Share
Geographic Coverage of E Commerce Industry in India
E Commerce Industry in India REPORT HIGHLIGHTS
| Aspects | Details |
|---|---|
| Study Period | 2020-2034 |
| Base Year | 2025 |
| Estimated Year | 2026 |
| Forecast Period | 2026-2034 |
| Historical Period | 2020-2025 |
| Growth Rate | CAGR of 21.50% from 2020-2034 |
| Segmentation |
|
Table of Contents
- 1. Introduction
- 1.1. Research Scope
- 1.2. Market Segmentation
- 1.3. Research Objective
- 1.4. Definitions and Assumptions
- 2. Executive Summary
- 2.1. Market Snapshot
- 3. Market Dynamics
- 3.1. Market Drivers
- 3.2. Market Restrains
- 3.3. Market Trends
- 3.4. Market Opportunities
- 4. Market Factor Analysis
- 4.1. Porters Five Forces
- 4.1.1. Bargaining Power of Suppliers
- 4.1.2. Bargaining Power of Buyers
- 4.1.3. Threat of New Entrants
- 4.1.4. Threat of Substitutes
- 4.1.5. Competitive Rivalry
- 4.2. PESTEL analysis
- 4.3. BCG Analysis
- 4.3.1. Stars (High Growth, High Market Share)
- 4.3.2. Cash Cows (Low Growth, High Market Share)
- 4.3.3. Question Mark (High Growth, Low Market Share)
- 4.3.4. Dogs (Low Growth, Low Market Share)
- 4.4. Ansoff Matrix Analysis
- 4.5. Supply Chain Analysis
- 4.6. Regulatory Landscape
- 4.7. Current Market Potential and Opportunity Assessment (TAM–SAM–SOM Framework)
- 4.8. PRI Analyst Note
- 4.1. Porters Five Forces
- 5. Market Analysis, Insights and Forecast 2021-2033
- 5.1. Market Analysis, Insights and Forecast - by B2C E-commerce
- 5.1.1. Beauty and Personal Care
- 5.1.2. Consumer Electronics
- 5.1.3. Fashion and Apparel
- 5.1.4. Food and Beverage
- 5.1.5. Furniture and Home
- 5.1.6. Other Applications (Toys, DIY, Media, Etc.)
- 5.2. Market Analysis, Insights and Forecast - by Business models
- 5.2.1. B2C E-commerce
- 5.2.2. B2B E-commerce
- 5.3. Market Analysis, Insights and Forecast - by Geography
- 5.3.1. Tier-I cities
- 5.3.2. Tier-II and tier-III cities
- 5.4. Market Analysis, Insights and Forecast - by Region
- 5.4.1. North America
- 5.4.2. South America
- 5.4.3. Europe
- 5.4.4. Middle East & Africa
- 5.4.5. Asia Pacific
- 5.1. Market Analysis, Insights and Forecast - by B2C E-commerce
- 6. Global E Commerce Industry in India Analysis, Insights and Forecast, 2021-2033
- 6.1. Market Analysis, Insights and Forecast - by B2C E-commerce
- 6.1.1. Beauty and Personal Care
- 6.1.2. Consumer Electronics
- 6.1.3. Fashion and Apparel
- 6.1.4. Food and Beverage
- 6.1.5. Furniture and Home
- 6.1.6. Other Applications (Toys, DIY, Media, Etc.)
- 6.2. Market Analysis, Insights and Forecast - by Business models
- 6.2.1. B2C E-commerce
- 6.2.2. B2B E-commerce
- 6.3. Market Analysis, Insights and Forecast - by Geography
- 6.3.1. Tier-I cities
- 6.3.2. Tier-II and tier-III cities
- 6.1. Market Analysis, Insights and Forecast - by B2C E-commerce
- 7. North America E Commerce Industry in India Analysis, Insights and Forecast, 2020-2032
- 7.1. Market Analysis, Insights and Forecast - by B2C E-commerce
- 7.1.1. Beauty and Personal Care
- 7.1.2. Consumer Electronics
- 7.1.3. Fashion and Apparel
- 7.1.4. Food and Beverage
- 7.1.5. Furniture and Home
- 7.1.6. Other Applications (Toys, DIY, Media, Etc.)
- 7.2. Market Analysis, Insights and Forecast - by Business models
- 7.2.1. B2C E-commerce
- 7.2.2. B2B E-commerce
- 7.3. Market Analysis, Insights and Forecast - by Geography
- 7.3.1. Tier-I cities
- 7.3.2. Tier-II and tier-III cities
- 7.1. Market Analysis, Insights and Forecast - by B2C E-commerce
- 8. South America E Commerce Industry in India Analysis, Insights and Forecast, 2020-2032
- 8.1. Market Analysis, Insights and Forecast - by B2C E-commerce
- 8.1.1. Beauty and Personal Care
- 8.1.2. Consumer Electronics
- 8.1.3. Fashion and Apparel
- 8.1.4. Food and Beverage
- 8.1.5. Furniture and Home
- 8.1.6. Other Applications (Toys, DIY, Media, Etc.)
- 8.2. Market Analysis, Insights and Forecast - by Business models
- 8.2.1. B2C E-commerce
- 8.2.2. B2B E-commerce
- 8.3. Market Analysis, Insights and Forecast - by Geography
- 8.3.1. Tier-I cities
- 8.3.2. Tier-II and tier-III cities
- 8.1. Market Analysis, Insights and Forecast - by B2C E-commerce
- 9. Europe E Commerce Industry in India Analysis, Insights and Forecast, 2020-2032
- 9.1. Market Analysis, Insights and Forecast - by B2C E-commerce
- 9.1.1. Beauty and Personal Care
- 9.1.2. Consumer Electronics
- 9.1.3. Fashion and Apparel
- 9.1.4. Food and Beverage
- 9.1.5. Furniture and Home
- 9.1.6. Other Applications (Toys, DIY, Media, Etc.)
- 9.2. Market Analysis, Insights and Forecast - by Business models
- 9.2.1. B2C E-commerce
- 9.2.2. B2B E-commerce
- 9.3. Market Analysis, Insights and Forecast - by Geography
- 9.3.1. Tier-I cities
- 9.3.2. Tier-II and tier-III cities
- 9.1. Market Analysis, Insights and Forecast - by B2C E-commerce
- 10. Middle East & Africa E Commerce Industry in India Analysis, Insights and Forecast, 2020-2032
- 10.1. Market Analysis, Insights and Forecast - by B2C E-commerce
- 10.1.1. Beauty and Personal Care
- 10.1.2. Consumer Electronics
- 10.1.3. Fashion and Apparel
- 10.1.4. Food and Beverage
- 10.1.5. Furniture and Home
- 10.1.6. Other Applications (Toys, DIY, Media, Etc.)
- 10.2. Market Analysis, Insights and Forecast - by Business models
- 10.2.1. B2C E-commerce
- 10.2.2. B2B E-commerce
- 10.3. Market Analysis, Insights and Forecast - by Geography
- 10.3.1. Tier-I cities
- 10.3.2. Tier-II and tier-III cities
- 10.1. Market Analysis, Insights and Forecast - by B2C E-commerce
- 11. Asia Pacific E Commerce Industry in India Analysis, Insights and Forecast, 2020-2032
- 11.1. Market Analysis, Insights and Forecast - by B2C E-commerce
- 11.1.1. Beauty and Personal Care
- 11.1.2. Consumer Electronics
- 11.1.3. Fashion and Apparel
- 11.1.4. Food and Beverage
- 11.1.5. Furniture and Home
- 11.1.6. Other Applications (Toys, DIY, Media, Etc.)
- 11.2. Market Analysis, Insights and Forecast - by Business models
- 11.2.1. B2C E-commerce
- 11.2.2. B2B E-commerce
- 11.3. Market Analysis, Insights and Forecast - by Geography
- 11.3.1. Tier-I cities
- 11.3.2. Tier-II and tier-III cities
- 11.1. Market Analysis, Insights and Forecast - by B2C E-commerce
- 12. Competitive Analysis
- 12.1. Company Profiles
- 12.1.1 Ajio
- 12.1.1.1. Company Overview
- 12.1.1.2. Products
- 12.1.1.3. Company Financials
- 12.1.1.4. SWOT Analysis
- 12.1.2 Nykaa
- 12.1.2.1. Company Overview
- 12.1.2.2. Products
- 12.1.2.3. Company Financials
- 12.1.2.4. SWOT Analysis
- 12.1.3 Alibaba Group Holding Limited
- 12.1.3.1. Company Overview
- 12.1.3.2. Products
- 12.1.3.3. Company Financials
- 12.1.3.4. SWOT Analysis
- 12.1.4 Grofers
- 12.1.4.1. Company Overview
- 12.1.4.2. Products
- 12.1.4.3. Company Financials
- 12.1.4.4. SWOT Analysis
- 12.1.5 Amazon com Inc
- 12.1.5.1. Company Overview
- 12.1.5.2. Products
- 12.1.5.3. Company Financials
- 12.1.5.4. SWOT Analysis
- 12.1.6 Flipkart Private Limited
- 12.1.6.1. Company Overview
- 12.1.6.2. Products
- 12.1.6.3. Company Financials
- 12.1.6.4. SWOT Analysis
- 12.1.7 Purplle
- 12.1.7.1. Company Overview
- 12.1.7.2. Products
- 12.1.7.3. Company Financials
- 12.1.7.4. SWOT Analysis
- 12.1.8 eBay Inc
- 12.1.8.1. Company Overview
- 12.1.8.2. Products
- 12.1.8.3. Company Financials
- 12.1.8.4. SWOT Analysis
- 12.1.9 Snapdeal
- 12.1.9.1. Company Overview
- 12.1.9.2. Products
- 12.1.9.3. Company Financials
- 12.1.9.4. SWOT Analysis
- 12.1.10 Apple Inc
- 12.1.10.1. Company Overview
- 12.1.10.2. Products
- 12.1.10.3. Company Financials
- 12.1.10.4. SWOT Analysis
- 12.1.1 Ajio
- 12.2. Market Entropy
- 12.2.1 Company's Key Areas Served
- 12.2.2 Recent Developments
- 12.3. Company Market Share Analysis 2025
- 12.3.1 Top 5 Companies Market Share Analysis
- 12.3.2 Top 3 Companies Market Share Analysis
- 12.4. List of Potential Customers
- 13. Research Methodology
List of Figures
- Figure 1: Global E Commerce Industry in India Revenue Breakdown (Million, %) by Region 2025 & 2033
- Figure 2: Global E Commerce Industry in India Volume Breakdown (K Unit, %) by Region 2025 & 2033
- Figure 3: North America E Commerce Industry in India Revenue (Million), by B2C E-commerce 2025 & 2033
- Figure 4: North America E Commerce Industry in India Volume (K Unit), by B2C E-commerce 2025 & 2033
- Figure 5: North America E Commerce Industry in India Revenue Share (%), by B2C E-commerce 2025 & 2033
- Figure 6: North America E Commerce Industry in India Volume Share (%), by B2C E-commerce 2025 & 2033
- Figure 7: North America E Commerce Industry in India Revenue (Million), by Business models 2025 & 2033
- Figure 8: North America E Commerce Industry in India Volume (K Unit), by Business models 2025 & 2033
- Figure 9: North America E Commerce Industry in India Revenue Share (%), by Business models 2025 & 2033
- Figure 10: North America E Commerce Industry in India Volume Share (%), by Business models 2025 & 2033
- Figure 11: North America E Commerce Industry in India Revenue (Million), by Geography 2025 & 2033
- Figure 12: North America E Commerce Industry in India Volume (K Unit), by Geography 2025 & 2033
- Figure 13: North America E Commerce Industry in India Revenue Share (%), by Geography 2025 & 2033
- Figure 14: North America E Commerce Industry in India Volume Share (%), by Geography 2025 & 2033
- Figure 15: North America E Commerce Industry in India Revenue (Million), by Country 2025 & 2033
- Figure 16: North America E Commerce Industry in India Volume (K Unit), by Country 2025 & 2033
- Figure 17: North America E Commerce Industry in India Revenue Share (%), by Country 2025 & 2033
- Figure 18: North America E Commerce Industry in India Volume Share (%), by Country 2025 & 2033
- Figure 19: South America E Commerce Industry in India Revenue (Million), by B2C E-commerce 2025 & 2033
- Figure 20: South America E Commerce Industry in India Volume (K Unit), by B2C E-commerce 2025 & 2033
- Figure 21: South America E Commerce Industry in India Revenue Share (%), by B2C E-commerce 2025 & 2033
- Figure 22: South America E Commerce Industry in India Volume Share (%), by B2C E-commerce 2025 & 2033
- Figure 23: South America E Commerce Industry in India Revenue (Million), by Business models 2025 & 2033
- Figure 24: South America E Commerce Industry in India Volume (K Unit), by Business models 2025 & 2033
- Figure 25: South America E Commerce Industry in India Revenue Share (%), by Business models 2025 & 2033
- Figure 26: South America E Commerce Industry in India Volume Share (%), by Business models 2025 & 2033
- Figure 27: South America E Commerce Industry in India Revenue (Million), by Geography 2025 & 2033
- Figure 28: South America E Commerce Industry in India Volume (K Unit), by Geography 2025 & 2033
- Figure 29: South America E Commerce Industry in India Revenue Share (%), by Geography 2025 & 2033
- Figure 30: South America E Commerce Industry in India Volume Share (%), by Geography 2025 & 2033
- Figure 31: South America E Commerce Industry in India Revenue (Million), by Country 2025 & 2033
- Figure 32: South America E Commerce Industry in India Volume (K Unit), by Country 2025 & 2033
- Figure 33: South America E Commerce Industry in India Revenue Share (%), by Country 2025 & 2033
- Figure 34: South America E Commerce Industry in India Volume Share (%), by Country 2025 & 2033
- Figure 35: Europe E Commerce Industry in India Revenue (Million), by B2C E-commerce 2025 & 2033
- Figure 36: Europe E Commerce Industry in India Volume (K Unit), by B2C E-commerce 2025 & 2033
- Figure 37: Europe E Commerce Industry in India Revenue Share (%), by B2C E-commerce 2025 & 2033
- Figure 38: Europe E Commerce Industry in India Volume Share (%), by B2C E-commerce 2025 & 2033
- Figure 39: Europe E Commerce Industry in India Revenue (Million), by Business models 2025 & 2033
- Figure 40: Europe E Commerce Industry in India Volume (K Unit), by Business models 2025 & 2033
- Figure 41: Europe E Commerce Industry in India Revenue Share (%), by Business models 2025 & 2033
- Figure 42: Europe E Commerce Industry in India Volume Share (%), by Business models 2025 & 2033
- Figure 43: Europe E Commerce Industry in India Revenue (Million), by Geography 2025 & 2033
- Figure 44: Europe E Commerce Industry in India Volume (K Unit), by Geography 2025 & 2033
- Figure 45: Europe E Commerce Industry in India Revenue Share (%), by Geography 2025 & 2033
- Figure 46: Europe E Commerce Industry in India Volume Share (%), by Geography 2025 & 2033
- Figure 47: Europe E Commerce Industry in India Revenue (Million), by Country 2025 & 2033
- Figure 48: Europe E Commerce Industry in India Volume (K Unit), by Country 2025 & 2033
- Figure 49: Europe E Commerce Industry in India Revenue Share (%), by Country 2025 & 2033
- Figure 50: Europe E Commerce Industry in India Volume Share (%), by Country 2025 & 2033
- Figure 51: Middle East & Africa E Commerce Industry in India Revenue (Million), by B2C E-commerce 2025 & 2033
- Figure 52: Middle East & Africa E Commerce Industry in India Volume (K Unit), by B2C E-commerce 2025 & 2033
- Figure 53: Middle East & Africa E Commerce Industry in India Revenue Share (%), by B2C E-commerce 2025 & 2033
- Figure 54: Middle East & Africa E Commerce Industry in India Volume Share (%), by B2C E-commerce 2025 & 2033
- Figure 55: Middle East & Africa E Commerce Industry in India Revenue (Million), by Business models 2025 & 2033
- Figure 56: Middle East & Africa E Commerce Industry in India Volume (K Unit), by Business models 2025 & 2033
- Figure 57: Middle East & Africa E Commerce Industry in India Revenue Share (%), by Business models 2025 & 2033
- Figure 58: Middle East & Africa E Commerce Industry in India Volume Share (%), by Business models 2025 & 2033
- Figure 59: Middle East & Africa E Commerce Industry in India Revenue (Million), by Geography 2025 & 2033
- Figure 60: Middle East & Africa E Commerce Industry in India Volume (K Unit), by Geography 2025 & 2033
- Figure 61: Middle East & Africa E Commerce Industry in India Revenue Share (%), by Geography 2025 & 2033
- Figure 62: Middle East & Africa E Commerce Industry in India Volume Share (%), by Geography 2025 & 2033
- Figure 63: Middle East & Africa E Commerce Industry in India Revenue (Million), by Country 2025 & 2033
- Figure 64: Middle East & Africa E Commerce Industry in India Volume (K Unit), by Country 2025 & 2033
- Figure 65: Middle East & Africa E Commerce Industry in India Revenue Share (%), by Country 2025 & 2033
- Figure 66: Middle East & Africa E Commerce Industry in India Volume Share (%), by Country 2025 & 2033
- Figure 67: Asia Pacific E Commerce Industry in India Revenue (Million), by B2C E-commerce 2025 & 2033
- Figure 68: Asia Pacific E Commerce Industry in India Volume (K Unit), by B2C E-commerce 2025 & 2033
- Figure 69: Asia Pacific E Commerce Industry in India Revenue Share (%), by B2C E-commerce 2025 & 2033
- Figure 70: Asia Pacific E Commerce Industry in India Volume Share (%), by B2C E-commerce 2025 & 2033
- Figure 71: Asia Pacific E Commerce Industry in India Revenue (Million), by Business models 2025 & 2033
- Figure 72: Asia Pacific E Commerce Industry in India Volume (K Unit), by Business models 2025 & 2033
- Figure 73: Asia Pacific E Commerce Industry in India Revenue Share (%), by Business models 2025 & 2033
- Figure 74: Asia Pacific E Commerce Industry in India Volume Share (%), by Business models 2025 & 2033
- Figure 75: Asia Pacific E Commerce Industry in India Revenue (Million), by Geography 2025 & 2033
- Figure 76: Asia Pacific E Commerce Industry in India Volume (K Unit), by Geography 2025 & 2033
- Figure 77: Asia Pacific E Commerce Industry in India Revenue Share (%), by Geography 2025 & 2033
- Figure 78: Asia Pacific E Commerce Industry in India Volume Share (%), by Geography 2025 & 2033
- Figure 79: Asia Pacific E Commerce Industry in India Revenue (Million), by Country 2025 & 2033
- Figure 80: Asia Pacific E Commerce Industry in India Volume (K Unit), by Country 2025 & 2033
- Figure 81: Asia Pacific E Commerce Industry in India Revenue Share (%), by Country 2025 & 2033
- Figure 82: Asia Pacific E Commerce Industry in India Volume Share (%), by Country 2025 & 2033
List of Tables
- Table 1: Global E Commerce Industry in India Revenue Million Forecast, by B2C E-commerce 2020 & 2033
- Table 2: Global E Commerce Industry in India Volume K Unit Forecast, by B2C E-commerce 2020 & 2033
- Table 3: Global E Commerce Industry in India Revenue Million Forecast, by Business models 2020 & 2033
- Table 4: Global E Commerce Industry in India Volume K Unit Forecast, by Business models 2020 & 2033
- Table 5: Global E Commerce Industry in India Revenue Million Forecast, by Geography 2020 & 2033
- Table 6: Global E Commerce Industry in India Volume K Unit Forecast, by Geography 2020 & 2033
- Table 7: Global E Commerce Industry in India Revenue Million Forecast, by Region 2020 & 2033
- Table 8: Global E Commerce Industry in India Volume K Unit Forecast, by Region 2020 & 2033
- Table 9: Global E Commerce Industry in India Revenue Million Forecast, by B2C E-commerce 2020 & 2033
- Table 10: Global E Commerce Industry in India Volume K Unit Forecast, by B2C E-commerce 2020 & 2033
- Table 11: Global E Commerce Industry in India Revenue Million Forecast, by Business models 2020 & 2033
- Table 12: Global E Commerce Industry in India Volume K Unit Forecast, by Business models 2020 & 2033
- Table 13: Global E Commerce Industry in India Revenue Million Forecast, by Geography 2020 & 2033
- Table 14: Global E Commerce Industry in India Volume K Unit Forecast, by Geography 2020 & 2033
- Table 15: Global E Commerce Industry in India Revenue Million Forecast, by Country 2020 & 2033
- Table 16: Global E Commerce Industry in India Volume K Unit Forecast, by Country 2020 & 2033
- Table 17: United States E Commerce Industry in India Revenue (Million) Forecast, by Application 2020 & 2033
- Table 18: United States E Commerce Industry in India Volume (K Unit) Forecast, by Application 2020 & 2033
- Table 19: Canada E Commerce Industry in India Revenue (Million) Forecast, by Application 2020 & 2033
- Table 20: Canada E Commerce Industry in India Volume (K Unit) Forecast, by Application 2020 & 2033
- Table 21: Mexico E Commerce Industry in India Revenue (Million) Forecast, by Application 2020 & 2033
- Table 22: Mexico E Commerce Industry in India Volume (K Unit) Forecast, by Application 2020 & 2033
- Table 23: Global E Commerce Industry in India Revenue Million Forecast, by B2C E-commerce 2020 & 2033
- Table 24: Global E Commerce Industry in India Volume K Unit Forecast, by B2C E-commerce 2020 & 2033
- Table 25: Global E Commerce Industry in India Revenue Million Forecast, by Business models 2020 & 2033
- Table 26: Global E Commerce Industry in India Volume K Unit Forecast, by Business models 2020 & 2033
- Table 27: Global E Commerce Industry in India Revenue Million Forecast, by Geography 2020 & 2033
- Table 28: Global E Commerce Industry in India Volume K Unit Forecast, by Geography 2020 & 2033
- Table 29: Global E Commerce Industry in India Revenue Million Forecast, by Country 2020 & 2033
- Table 30: Global E Commerce Industry in India Volume K Unit Forecast, by Country 2020 & 2033
- Table 31: Brazil E Commerce Industry in India Revenue (Million) Forecast, by Application 2020 & 2033
- Table 32: Brazil E Commerce Industry in India Volume (K Unit) Forecast, by Application 2020 & 2033
- Table 33: Argentina E Commerce Industry in India Revenue (Million) Forecast, by Application 2020 & 2033
- Table 34: Argentina E Commerce Industry in India Volume (K Unit) Forecast, by Application 2020 & 2033
- Table 35: Rest of South America E Commerce Industry in India Revenue (Million) Forecast, by Application 2020 & 2033
- Table 36: Rest of South America E Commerce Industry in India Volume (K Unit) Forecast, by Application 2020 & 2033
- Table 37: Global E Commerce Industry in India Revenue Million Forecast, by B2C E-commerce 2020 & 2033
- Table 38: Global E Commerce Industry in India Volume K Unit Forecast, by B2C E-commerce 2020 & 2033
- Table 39: Global E Commerce Industry in India Revenue Million Forecast, by Business models 2020 & 2033
- Table 40: Global E Commerce Industry in India Volume K Unit Forecast, by Business models 2020 & 2033
- Table 41: Global E Commerce Industry in India Revenue Million Forecast, by Geography 2020 & 2033
- Table 42: Global E Commerce Industry in India Volume K Unit Forecast, by Geography 2020 & 2033
- Table 43: Global E Commerce Industry in India Revenue Million Forecast, by Country 2020 & 2033
- Table 44: Global E Commerce Industry in India Volume K Unit Forecast, by Country 2020 & 2033
- Table 45: United Kingdom E Commerce Industry in India Revenue (Million) Forecast, by Application 2020 & 2033
- Table 46: United Kingdom E Commerce Industry in India Volume (K Unit) Forecast, by Application 2020 & 2033
- Table 47: Germany E Commerce Industry in India Revenue (Million) Forecast, by Application 2020 & 2033
- Table 48: Germany E Commerce Industry in India Volume (K Unit) Forecast, by Application 2020 & 2033
- Table 49: France E Commerce Industry in India Revenue (Million) Forecast, by Application 2020 & 2033
- Table 50: France E Commerce Industry in India Volume (K Unit) Forecast, by Application 2020 & 2033
- Table 51: Italy E Commerce Industry in India Revenue (Million) Forecast, by Application 2020 & 2033
- Table 52: Italy E Commerce Industry in India Volume (K Unit) Forecast, by Application 2020 & 2033
- Table 53: Spain E Commerce Industry in India Revenue (Million) Forecast, by Application 2020 & 2033
- Table 54: Spain E Commerce Industry in India Volume (K Unit) Forecast, by Application 2020 & 2033
- Table 55: Russia E Commerce Industry in India Revenue (Million) Forecast, by Application 2020 & 2033
- Table 56: Russia E Commerce Industry in India Volume (K Unit) Forecast, by Application 2020 & 2033
- Table 57: Benelux E Commerce Industry in India Revenue (Million) Forecast, by Application 2020 & 2033
- Table 58: Benelux E Commerce Industry in India Volume (K Unit) Forecast, by Application 2020 & 2033
- Table 59: Nordics E Commerce Industry in India Revenue (Million) Forecast, by Application 2020 & 2033
- Table 60: Nordics E Commerce Industry in India Volume (K Unit) Forecast, by Application 2020 & 2033
- Table 61: Rest of Europe E Commerce Industry in India Revenue (Million) Forecast, by Application 2020 & 2033
- Table 62: Rest of Europe E Commerce Industry in India Volume (K Unit) Forecast, by Application 2020 & 2033
- Table 63: Global E Commerce Industry in India Revenue Million Forecast, by B2C E-commerce 2020 & 2033
- Table 64: Global E Commerce Industry in India Volume K Unit Forecast, by B2C E-commerce 2020 & 2033
- Table 65: Global E Commerce Industry in India Revenue Million Forecast, by Business models 2020 & 2033
- Table 66: Global E Commerce Industry in India Volume K Unit Forecast, by Business models 2020 & 2033
- Table 67: Global E Commerce Industry in India Revenue Million Forecast, by Geography 2020 & 2033
- Table 68: Global E Commerce Industry in India Volume K Unit Forecast, by Geography 2020 & 2033
- Table 69: Global E Commerce Industry in India Revenue Million Forecast, by Country 2020 & 2033
- Table 70: Global E Commerce Industry in India Volume K Unit Forecast, by Country 2020 & 2033
- Table 71: Turkey E Commerce Industry in India Revenue (Million) Forecast, by Application 2020 & 2033
- Table 72: Turkey E Commerce Industry in India Volume (K Unit) Forecast, by Application 2020 & 2033
- Table 73: Israel E Commerce Industry in India Revenue (Million) Forecast, by Application 2020 & 2033
- Table 74: Israel E Commerce Industry in India Volume (K Unit) Forecast, by Application 2020 & 2033
- Table 75: GCC E Commerce Industry in India Revenue (Million) Forecast, by Application 2020 & 2033
- Table 76: GCC E Commerce Industry in India Volume (K Unit) Forecast, by Application 2020 & 2033
- Table 77: North Africa E Commerce Industry in India Revenue (Million) Forecast, by Application 2020 & 2033
- Table 78: North Africa E Commerce Industry in India Volume (K Unit) Forecast, by Application 2020 & 2033
- Table 79: South Africa E Commerce Industry in India Revenue (Million) Forecast, by Application 2020 & 2033
- Table 80: South Africa E Commerce Industry in India Volume (K Unit) Forecast, by Application 2020 & 2033
- Table 81: Rest of Middle East & Africa E Commerce Industry in India Revenue (Million) Forecast, by Application 2020 & 2033
- Table 82: Rest of Middle East & Africa E Commerce Industry in India Volume (K Unit) Forecast, by Application 2020 & 2033
- Table 83: Global E Commerce Industry in India Revenue Million Forecast, by B2C E-commerce 2020 & 2033
- Table 84: Global E Commerce Industry in India Volume K Unit Forecast, by B2C E-commerce 2020 & 2033
- Table 85: Global E Commerce Industry in India Revenue Million Forecast, by Business models 2020 & 2033
- Table 86: Global E Commerce Industry in India Volume K Unit Forecast, by Business models 2020 & 2033
- Table 87: Global E Commerce Industry in India Revenue Million Forecast, by Geography 2020 & 2033
- Table 88: Global E Commerce Industry in India Volume K Unit Forecast, by Geography 2020 & 2033
- Table 89: Global E Commerce Industry in India Revenue Million Forecast, by Country 2020 & 2033
- Table 90: Global E Commerce Industry in India Volume K Unit Forecast, by Country 2020 & 2033
- Table 91: China E Commerce Industry in India Revenue (Million) Forecast, by Application 2020 & 2033
- Table 92: China E Commerce Industry in India Volume (K Unit) Forecast, by Application 2020 & 2033
- Table 93: India E Commerce Industry in India Revenue (Million) Forecast, by Application 2020 & 2033
- Table 94: India E Commerce Industry in India Volume (K Unit) Forecast, by Application 2020 & 2033
- Table 95: Japan E Commerce Industry in India Revenue (Million) Forecast, by Application 2020 & 2033
- Table 96: Japan E Commerce Industry in India Volume (K Unit) Forecast, by Application 2020 & 2033
- Table 97: South Korea E Commerce Industry in India Revenue (Million) Forecast, by Application 2020 & 2033
- Table 98: South Korea E Commerce Industry in India Volume (K Unit) Forecast, by Application 2020 & 2033
- Table 99: ASEAN E Commerce Industry in India Revenue (Million) Forecast, by Application 2020 & 2033
- Table 100: ASEAN E Commerce Industry in India Volume (K Unit) Forecast, by Application 2020 & 2033
- Table 101: Oceania E Commerce Industry in India Revenue (Million) Forecast, by Application 2020 & 2033
- Table 102: Oceania E Commerce Industry in India Volume (K Unit) Forecast, by Application 2020 & 2033
- Table 103: Rest of Asia Pacific E Commerce Industry in India Revenue (Million) Forecast, by Application 2020 & 2033
- Table 104: Rest of Asia Pacific E Commerce Industry in India Volume (K Unit) Forecast, by Application 2020 & 2033
Frequently Asked Questions
1. What is the projected Compound Annual Growth Rate (CAGR) of the E Commerce Industry in India?
The projected CAGR is approximately 21.50%.
2. Which companies are prominent players in the E Commerce Industry in India?
Key companies in the market include Ajio, Nykaa, Alibaba Group Holding Limited, Grofers, Amazon com Inc, Flipkart Private Limited, Purplle, eBay Inc, Snapdeal, Apple Inc.
3. What are the main segments of the E Commerce Industry in India?
The market segments include B2C E-commerce, Business models , Geography.
4. Can you provide details about the market size?
The market size is estimated to be USD 112.93 Million as of 2022.
5. What are some drivers contributing to market growth?
Increased Internet Penetration Across the Country; Supportive Government Policies and Regulatory Framework.
6. What are the notable trends driving market growth?
Internet Plays a Significant Role in Market Growth.
7. Are there any restraints impacting market growth?
Privacy and security concerns.
8. Can you provide examples of recent developments in the market?
June 2023 - American tech giant Amazon has committed to investing an additional USD 15 billion in India over the next seven years. This will take the company’s total India investment across all businesses to USD 26 billion. Amazon has already invested USD 11 billion in India. The company has pledged to digitize 10 million small businesses, enable USD 20 billion in exports, and create two million jobs in India by 2025.
9. What pricing options are available for accessing the report?
Pricing options include single-user, multi-user, and enterprise licenses priced at USD 3800, USD 4500, and USD 5800 respectively.
10. Is the market size provided in terms of value or volume?
The market size is provided in terms of value, measured in Million and volume, measured in K Unit.
11. Are there any specific market keywords associated with the report?
Yes, the market keyword associated with the report is "E Commerce Industry in India," which aids in identifying and referencing the specific market segment covered.
12. How do I determine which pricing option suits my needs best?
The pricing options vary based on user requirements and access needs. Individual users may opt for single-user licenses, while businesses requiring broader access may choose multi-user or enterprise licenses for cost-effective access to the report.
13. Are there any additional resources or data provided in the E Commerce Industry in India report?
While the report offers comprehensive insights, it's advisable to review the specific contents or supplementary materials provided to ascertain if additional resources or data are available.
14. How can I stay updated on further developments or reports in the E Commerce Industry in India?
To stay informed about further developments, trends, and reports in the E Commerce Industry in India, consider subscribing to industry newsletters, following relevant companies and organizations, or regularly checking reputable industry news sources and publications.
Methodology
Step 1 - Identification of Relevant Samples Size from Population Database


Step 2 - Approaches for Defining Global Market Size (Value, Volume* & Price*)

Note*: In applicable scenarios
Step 3 - Data Sources
Primary Research
- Web Analytics
- Survey Reports
- Research Institute
- Latest Research Reports
- Opinion Leaders
Secondary Research
- Annual Reports
- White Paper
- Latest Press Release
- Industry Association
- Paid Database
- Investor Presentations

Step 4 - Data Triangulation
Involves using different sources of information in order to increase the validity of a study
These sources are likely to be stakeholders in a program - participants, other researchers, program staff, other community members, and so on.
Then we put all data in single framework & apply various statistical tools to find out the dynamic on the market.
During the analysis stage, feedback from the stakeholder groups would be compared to determine areas of agreement as well as areas of divergence