

Key Insights
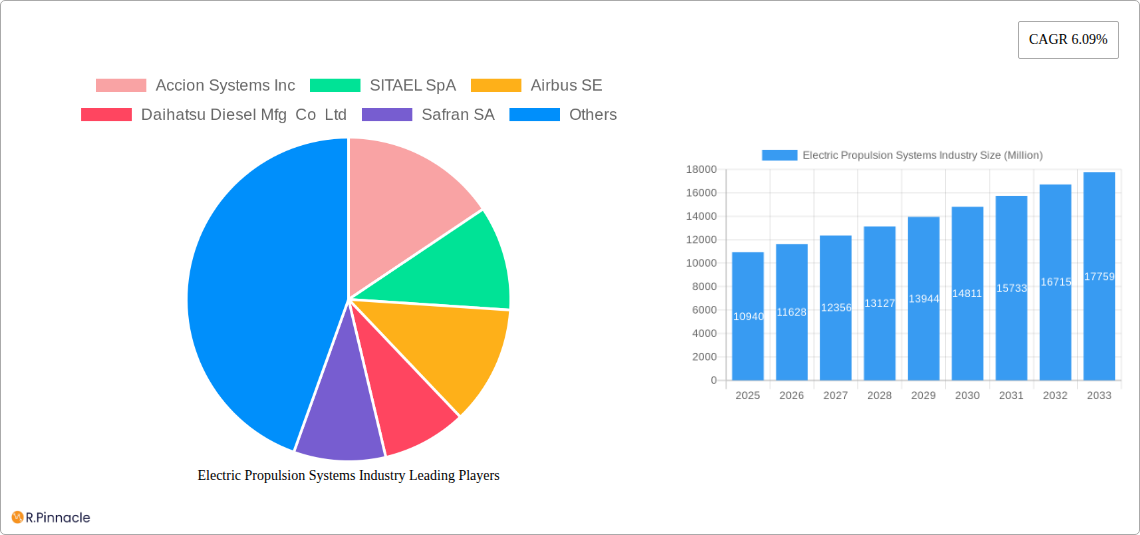
The Electric Propulsion Systems (EPS) market is experiencing robust growth, projected to reach a value of $10.94 billion in 2025 and maintain a Compound Annual Growth Rate (CAGR) of 6.09% from 2025 to 2033. Several factors drive this expansion. The increasing demand for fuel-efficient and environmentally friendly transportation solutions across various sectors—airborne, terrestrial, marine, and space—is a primary catalyst. Government regulations promoting emission reduction and the rising adoption of electric vehicles (EVs) are further bolstering market growth. Technological advancements leading to improved battery life, higher power density, and reduced costs of EPS components also contribute significantly. The market segmentation reveals a strong preference for hybrid electric propulsion systems, although full-electric systems are witnessing rapid adoption, particularly in the airborne and terrestrial segments. Competition is fierce, with major players like Airbus, Safran, and Northrop Grumman alongside emerging innovators like Accion Systems and Busek vying for market share. The Asia-Pacific region, driven by substantial investments in electric mobility and space exploration in countries like China and India, is anticipated to be a key growth area. North America, with its established aerospace and defense industries, and Europe, focused on sustainable transportation initiatives, will also remain significant markets.
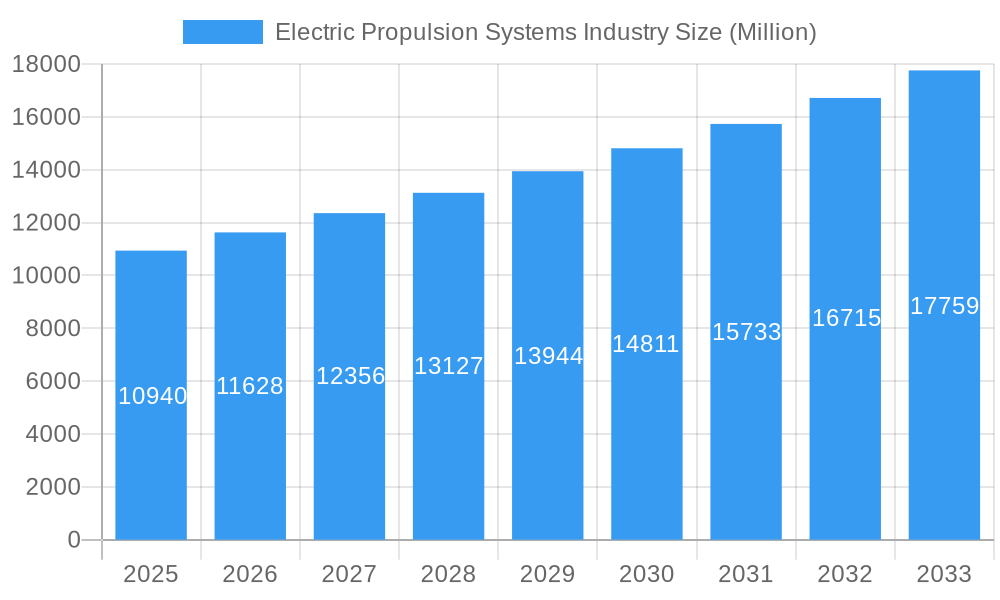
Electric Propulsion Systems Industry Market Size (In Billion)
Continued market expansion relies heavily on overcoming existing challenges. High initial investment costs associated with EPS technologies remain a barrier for widespread adoption, especially in developing countries. The need for robust and reliable charging infrastructure, particularly for terrestrial applications, is another critical factor. Further research and development efforts are required to enhance battery technology and address issues related to energy density, lifespan, and charging time. Overcoming these hurdles will be crucial for sustaining the projected CAGR and unlocking the full potential of the EPS market. The successful integration of EPS into various applications across diverse sectors will depend on the continued collaboration between manufacturers, policymakers, and research institutions.
Electric Propulsion Systems Industry Company Market Share
Electric Propulsion Systems Industry Market Report: 2019-2033
This comprehensive report provides an in-depth analysis of the Electric Propulsion Systems industry, offering invaluable insights for industry professionals, investors, and strategic decision-makers. The report covers market structure, innovation trends, dynamics, regional dominance, product innovations, and future outlook, with a focus on the period 2019-2033 (Study Period), using 2025 as the base and estimated year. The forecast period spans 2025-2033, while the historical period covers 2019-2024. The global market size in 2025 is estimated at $XX Million.
Electric Propulsion Systems Industry Market Structure & Innovation Trends
The Electric Propulsion Systems market exhibits a moderately consolidated structure with several key players holding significant market share. Accion Systems Inc, SITAEL SpA, Airbus SE, and Safran SA are among the leading companies, collectively accounting for an estimated xx% of the market in 2025. Market concentration is influenced by factors including technological advancements, regulatory landscapes, and M&A activities. The industry witnessed significant M&A activity between 2019 and 2024, with deals valued at approximately $XX Million. These mergers and acquisitions were primarily driven by the need to expand product portfolios, enhance technological capabilities, and gain access to new markets.
- Key Innovation Drivers: Miniaturization of components, improved energy density, enhanced efficiency, and the development of advanced power electronics.
- Regulatory Frameworks: Stringent emission regulations and government incentives for green technologies are accelerating the adoption of electric propulsion systems.
- Product Substitutes: Traditional combustion engine systems, although facing increasing pressure due to environmental concerns and rising fuel costs.
- End-User Demographics: Growth is fueled by diverse sectors including aerospace, automotive, marine, and space exploration.
- M&A Activity: Significant consolidation is expected to continue, shaping the market landscape in the coming years.
Electric Propulsion Systems Industry Market Dynamics & Trends
The Electric Propulsion Systems market is experiencing robust growth, driven by several factors. The Compound Annual Growth Rate (CAGR) is projected to be xx% during the forecast period (2025-2033). Market penetration is steadily increasing across various applications. Technological disruptions, such as advancements in battery technology and power electronics, are significantly influencing market dynamics. Consumer preference for environmentally friendly solutions further propels market expansion. Intense competition among established players and emerging startups is fostering innovation and driving down costs. Increased demand for electric vehicles and stricter emission standards are also contributing to the market’s growth trajectory. The market size is anticipated to reach $XX Million by 2033.
Dominant Regions & Segments in Electric Propulsion Systems Industry
North America currently holds the largest market share in the Electric Propulsion Systems industry, driven by robust R&D investments, stringent environmental regulations, and a strong aerospace and defense sector. However, the Asia-Pacific region is projected to witness the fastest growth rate due to rapid industrialization, increasing urbanization, and government support for electric mobility.
By Type:
- Full-electric: This segment is expected to dominate the market due to its higher efficiency and lower emissions compared to hybrid systems.
- Hybrid: Hybrid systems are finding applications where full electrification is not feasible or cost-effective.
By Application:
- Airborne: The aerospace segment is a significant driver of growth due to the increasing demand for electric and hybrid-electric aircraft.
- Terrestrial: Electric vehicles and other ground-based applications are contributing significantly to market expansion.
- Marine: The marine sector is witnessing growing adoption of electric propulsion systems for improved fuel efficiency and reduced emissions.
- Space: Space exploration programs are fueling the demand for high-performance electric propulsion systems.
Key Drivers for North American Dominance:
- Strong government support for clean technologies and substantial investments in R&D.
- A well-established aerospace and defense industry.
- High consumer awareness and demand for electric and hybrid vehicles.
Electric Propulsion Systems Industry Product Innovations
Recent years have witnessed significant advancements in electric propulsion systems, including the development of more efficient motors, higher energy density batteries, and improved power electronics. These innovations are leading to lighter, smaller, and more cost-effective systems, expanding their applications across various sectors. The focus is shifting towards modular designs, enabling customization and integration into diverse platforms. This trend is improving market fit and enhancing competitive advantages.
Report Scope & Segmentation Analysis
This report comprehensively analyzes the Electric Propulsion Systems market across various segments:
By Type: Hybrid and Full-electric, each with detailed growth projections, market sizes, and competitive landscapes. The full-electric segment is projected to experience faster growth due to its environmental advantages.
By Application: Airborne, Terrestrial, Marine, and Space, each showcasing specific market dynamics, growth drivers, and key players. The airborne and terrestrial segments are expected to lead in terms of market size.
Key Drivers of Electric Propulsion Systems Industry Growth
The growth of the electric propulsion systems market is propelled by several factors: stricter emission regulations globally, increasing demand for energy-efficient transportation and industrial equipment, and continuous technological advancements leading to improved system performance and reduced costs. Government incentives and subsidies aimed at promoting green technologies are also contributing significantly to market expansion.
Challenges in the Electric Propulsion Systems Industry Sector
The industry faces challenges such as high initial investment costs associated with electric propulsion systems, the need for robust charging infrastructure, and potential supply chain disruptions impacting the availability of critical components. The need for skilled labor and the ongoing development of battery technologies are also significant challenges. These factors can hinder market growth and impact profitability.
Emerging Opportunities in Electric Propulsion Systems Industry
Emerging opportunities include the expansion into new applications, such as electric aircraft and drones, the development of advanced battery technologies with higher energy density and longer lifespan, and the integration of smart technologies for improved system control and management. The growing focus on sustainable transportation and industrial processes presents significant growth potential for electric propulsion systems.
Leading Players in the Electric Propulsion Systems Industry Market
- Accion Systems Inc
- SITAEL SpA
- Airbus SE
- Daihatsu Diesel Mfg Co Ltd
- Safran SA
- Aerojet Rocketdyne Holdings Inc
- Orbital ATK (Northrop Grumman Corporation)
- Efficient Drivetrains Inc (Cummins Inc)
- Collins Aerospace (RTX Corporation)
- Busek Co Inc
- Thales Alenia Space
- General Electric Company
- The Boeing Company
Key Developments in Electric Propulsion Systems Industry
- 2022 Q4: Airbus SE unveiled a new electric propulsion system for urban air mobility vehicles.
- 2023 Q1: Safran SA announced a strategic partnership to develop advanced electric propulsion technologies for aerospace applications.
- 2024 Q2: Accion Systems Inc secured a significant contract for electric propulsion systems for a space exploration mission. (Further details would be included in the full report)
Future Outlook for Electric Propulsion Systems Industry Market
The future outlook for the Electric Propulsion Systems market is highly positive, driven by sustained technological advancements, increasing environmental awareness, and supportive government policies. The market is poised for significant growth across various applications, offering substantial opportunities for industry players and investors alike. The continued development of high-performance, cost-effective electric propulsion systems will be a key driver of future market expansion.
Electric Propulsion Systems Industry Segmentation
- 1. Production Analysis
- 2. Consumption Analysis
- 3. Import Market Analysis (Value & Volume)
- 4. Export Market Analysis (Value & Volume)
- 5. Price Trend Analysis
Electric Propulsion Systems Industry Segmentation By Geography
-
1. North America
- 1.1. United States
- 1.2. Canada
- 1.3. Mexico
-
2. South America
- 2.1. Brazil
- 2.2. Argentina
- 2.3. Rest of South America
-
3. Europe
- 3.1. United Kingdom
- 3.2. Germany
- 3.3. France
- 3.4. Italy
- 3.5. Spain
- 3.6. Russia
- 3.7. Benelux
- 3.8. Nordics
- 3.9. Rest of Europe
-
4. Middle East & Africa
- 4.1. Turkey
- 4.2. Israel
- 4.3. GCC
- 4.4. North Africa
- 4.5. South Africa
- 4.6. Rest of Middle East & Africa
-
5. Asia Pacific
- 5.1. China
- 5.2. India
- 5.3. Japan
- 5.4. South Korea
- 5.5. ASEAN
- 5.6. Oceania
- 5.7. Rest of Asia Pacific
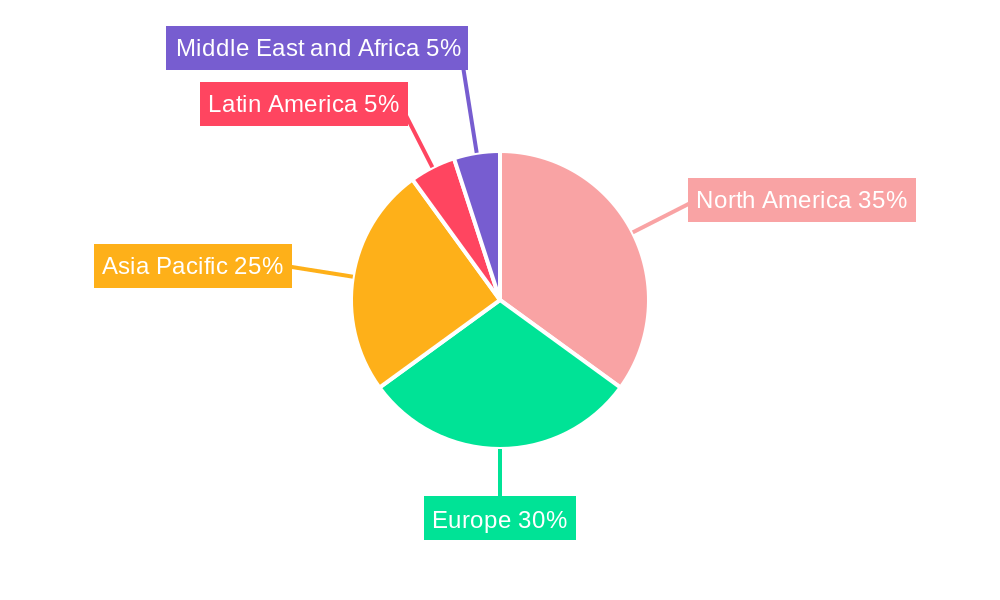
Electric Propulsion Systems Industry Regional Market Share
Geographic Coverage of Electric Propulsion Systems Industry
Electric Propulsion Systems Industry REPORT HIGHLIGHTS
| Aspects | Details |
|---|---|
| Study Period | 2020-2034 |
| Base Year | 2025 |
| Estimated Year | 2026 |
| Forecast Period | 2026-2034 |
| Historical Period | 2020-2025 |
| Growth Rate | CAGR of 6.09% from 2020-2034 |
| Segmentation |
|
Table of Contents
- 1. Introduction
- 1.1. Research Scope
- 1.2. Market Segmentation
- 1.3. Research Objective
- 1.4. Definitions and Assumptions
- 2. Executive Summary
- 2.1. Market Snapshot
- 3. Market Dynamics
- 3.1. Market Drivers
- 3.2. Market Restrains
- 3.3. Market Trends
- 3.4. Market Opportunities
- 4. Market Factor Analysis
- 4.1. Porters Five Forces
- 4.1.1. Bargaining Power of Suppliers
- 4.1.2. Bargaining Power of Buyers
- 4.1.3. Threat of New Entrants
- 4.1.4. Threat of Substitutes
- 4.1.5. Competitive Rivalry
- 4.2. PESTEL analysis
- 4.3. BCG Analysis
- 4.3.1. Stars (High Growth, High Market Share)
- 4.3.2. Cash Cows (Low Growth, High Market Share)
- 4.3.3. Question Mark (High Growth, Low Market Share)
- 4.3.4. Dogs (Low Growth, Low Market Share)
- 4.4. Ansoff Matrix Analysis
- 4.5. Supply Chain Analysis
- 4.6. Regulatory Landscape
- 4.7. Current Market Potential and Opportunity Assessment (TAM–SAM–SOM Framework)
- 4.8. PRI Analyst Note
- 4.1. Porters Five Forces
- 5. Market Analysis, Insights and Forecast 2021-2033
- 5.1. Market Analysis, Insights and Forecast - by Production Analysis
- 5.2. Market Analysis, Insights and Forecast - by Consumption Analysis
- 5.3. Market Analysis, Insights and Forecast - by Import Market Analysis (Value & Volume)
- 5.4. Market Analysis, Insights and Forecast - by Export Market Analysis (Value & Volume)
- 5.5. Market Analysis, Insights and Forecast - by Price Trend Analysis
- 5.6. Market Analysis, Insights and Forecast - by Region
- 5.6.1. North America
- 5.6.2. South America
- 5.6.3. Europe
- 5.6.4. Middle East & Africa
- 5.6.5. Asia Pacific
- 6. Global Electric Propulsion Systems Industry Analysis, Insights and Forecast, 2021-2033
- 6.1. Market Analysis, Insights and Forecast - by Production Analysis
- 6.2. Market Analysis, Insights and Forecast - by Consumption Analysis
- 6.3. Market Analysis, Insights and Forecast - by Import Market Analysis (Value & Volume)
- 6.4. Market Analysis, Insights and Forecast - by Export Market Analysis (Value & Volume)
- 6.5. Market Analysis, Insights and Forecast - by Price Trend Analysis
- 7. North America Electric Propulsion Systems Industry Analysis, Insights and Forecast, 2020-2032
- 7.1. Market Analysis, Insights and Forecast - by Production Analysis
- 7.2. Market Analysis, Insights and Forecast - by Consumption Analysis
- 7.3. Market Analysis, Insights and Forecast - by Import Market Analysis (Value & Volume)
- 7.4. Market Analysis, Insights and Forecast - by Export Market Analysis (Value & Volume)
- 7.5. Market Analysis, Insights and Forecast - by Price Trend Analysis
- 8. South America Electric Propulsion Systems Industry Analysis, Insights and Forecast, 2020-2032
- 8.1. Market Analysis, Insights and Forecast - by Production Analysis
- 8.2. Market Analysis, Insights and Forecast - by Consumption Analysis
- 8.3. Market Analysis, Insights and Forecast - by Import Market Analysis (Value & Volume)
- 8.4. Market Analysis, Insights and Forecast - by Export Market Analysis (Value & Volume)
- 8.5. Market Analysis, Insights and Forecast - by Price Trend Analysis
- 9. Europe Electric Propulsion Systems Industry Analysis, Insights and Forecast, 2020-2032
- 9.1. Market Analysis, Insights and Forecast - by Production Analysis
- 9.2. Market Analysis, Insights and Forecast - by Consumption Analysis
- 9.3. Market Analysis, Insights and Forecast - by Import Market Analysis (Value & Volume)
- 9.4. Market Analysis, Insights and Forecast - by Export Market Analysis (Value & Volume)
- 9.5. Market Analysis, Insights and Forecast - by Price Trend Analysis
- 10. Middle East & Africa Electric Propulsion Systems Industry Analysis, Insights and Forecast, 2020-2032
- 10.1. Market Analysis, Insights and Forecast - by Production Analysis
- 10.2. Market Analysis, Insights and Forecast - by Consumption Analysis
- 10.3. Market Analysis, Insights and Forecast - by Import Market Analysis (Value & Volume)
- 10.4. Market Analysis, Insights and Forecast - by Export Market Analysis (Value & Volume)
- 10.5. Market Analysis, Insights and Forecast - by Price Trend Analysis
- 11. Asia Pacific Electric Propulsion Systems Industry Analysis, Insights and Forecast, 2020-2032
- 11.1. Market Analysis, Insights and Forecast - by Production Analysis
- 11.2. Market Analysis, Insights and Forecast - by Consumption Analysis
- 11.3. Market Analysis, Insights and Forecast - by Import Market Analysis (Value & Volume)
- 11.4. Market Analysis, Insights and Forecast - by Export Market Analysis (Value & Volume)
- 11.5. Market Analysis, Insights and Forecast - by Price Trend Analysis
- 12. Competitive Analysis
- 12.1. Company Profiles
- 12.1.1 Accion Systems Inc
- 12.1.1.1. Company Overview
- 12.1.1.2. Products
- 12.1.1.3. Company Financials
- 12.1.1.4. SWOT Analysis
- 12.1.2 SITAEL SpA
- 12.1.2.1. Company Overview
- 12.1.2.2. Products
- 12.1.2.3. Company Financials
- 12.1.2.4. SWOT Analysis
- 12.1.3 Airbus SE
- 12.1.3.1. Company Overview
- 12.1.3.2. Products
- 12.1.3.3. Company Financials
- 12.1.3.4. SWOT Analysis
- 12.1.4 Daihatsu Diesel Mfg Co Ltd
- 12.1.4.1. Company Overview
- 12.1.4.2. Products
- 12.1.4.3. Company Financials
- 12.1.4.4. SWOT Analysis
- 12.1.5 Safran SA
- 12.1.5.1. Company Overview
- 12.1.5.2. Products
- 12.1.5.3. Company Financials
- 12.1.5.4. SWOT Analysis
- 12.1.6 Aerojet Rocketdyne Holdings Inc
- 12.1.6.1. Company Overview
- 12.1.6.2. Products
- 12.1.6.3. Company Financials
- 12.1.6.4. SWOT Analysis
- 12.1.7 Orbital ATK (Northrop Grumman Corporation)
- 12.1.7.1. Company Overview
- 12.1.7.2. Products
- 12.1.7.3. Company Financials
- 12.1.7.4. SWOT Analysis
- 12.1.8 Efficient Drivetrains Inc (Cummins Inc )
- 12.1.8.1. Company Overview
- 12.1.8.2. Products
- 12.1.8.3. Company Financials
- 12.1.8.4. SWOT Analysis
- 12.1.9 Collins Aerospace (RTX Corporation
- 12.1.9.1. Company Overview
- 12.1.9.2. Products
- 12.1.9.3. Company Financials
- 12.1.9.4. SWOT Analysis
- 12.1.10 Busek Co Inc
- 12.1.10.1. Company Overview
- 12.1.10.2. Products
- 12.1.10.3. Company Financials
- 12.1.10.4. SWOT Analysis
- 12.1.11 Thales Alenia Space
- 12.1.11.1. Company Overview
- 12.1.11.2. Products
- 12.1.11.3. Company Financials
- 12.1.11.4. SWOT Analysis
- 12.1.12 General Electric Company
- 12.1.12.1. Company Overview
- 12.1.12.2. Products
- 12.1.12.3. Company Financials
- 12.1.12.4. SWOT Analysis
- 12.1.13 The Boeing Company
- 12.1.13.1. Company Overview
- 12.1.13.2. Products
- 12.1.13.3. Company Financials
- 12.1.13.4. SWOT Analysis
- 12.1.1 Accion Systems Inc
- 12.2. Market Entropy
- 12.2.1 Company's Key Areas Served
- 12.2.2 Recent Developments
- 12.3. Company Market Share Analysis 2025
- 12.3.1 Top 5 Companies Market Share Analysis
- 12.3.2 Top 3 Companies Market Share Analysis
- 12.4. List of Potential Customers
- 13. Research Methodology
List of Figures
- Figure 1: Global Electric Propulsion Systems Industry Revenue Breakdown (Million, %) by Region 2025 & 2033
- Figure 2: North America Electric Propulsion Systems Industry Revenue (Million), by Production Analysis 2025 & 2033
- Figure 3: North America Electric Propulsion Systems Industry Revenue Share (%), by Production Analysis 2025 & 2033
- Figure 4: North America Electric Propulsion Systems Industry Revenue (Million), by Consumption Analysis 2025 & 2033
- Figure 5: North America Electric Propulsion Systems Industry Revenue Share (%), by Consumption Analysis 2025 & 2033
- Figure 6: North America Electric Propulsion Systems Industry Revenue (Million), by Import Market Analysis (Value & Volume) 2025 & 2033
- Figure 7: North America Electric Propulsion Systems Industry Revenue Share (%), by Import Market Analysis (Value & Volume) 2025 & 2033
- Figure 8: North America Electric Propulsion Systems Industry Revenue (Million), by Export Market Analysis (Value & Volume) 2025 & 2033
- Figure 9: North America Electric Propulsion Systems Industry Revenue Share (%), by Export Market Analysis (Value & Volume) 2025 & 2033
- Figure 10: North America Electric Propulsion Systems Industry Revenue (Million), by Price Trend Analysis 2025 & 2033
- Figure 11: North America Electric Propulsion Systems Industry Revenue Share (%), by Price Trend Analysis 2025 & 2033
- Figure 12: North America Electric Propulsion Systems Industry Revenue (Million), by Country 2025 & 2033
- Figure 13: North America Electric Propulsion Systems Industry Revenue Share (%), by Country 2025 & 2033
- Figure 14: South America Electric Propulsion Systems Industry Revenue (Million), by Production Analysis 2025 & 2033
- Figure 15: South America Electric Propulsion Systems Industry Revenue Share (%), by Production Analysis 2025 & 2033
- Figure 16: South America Electric Propulsion Systems Industry Revenue (Million), by Consumption Analysis 2025 & 2033
- Figure 17: South America Electric Propulsion Systems Industry Revenue Share (%), by Consumption Analysis 2025 & 2033
- Figure 18: South America Electric Propulsion Systems Industry Revenue (Million), by Import Market Analysis (Value & Volume) 2025 & 2033
- Figure 19: South America Electric Propulsion Systems Industry Revenue Share (%), by Import Market Analysis (Value & Volume) 2025 & 2033
- Figure 20: South America Electric Propulsion Systems Industry Revenue (Million), by Export Market Analysis (Value & Volume) 2025 & 2033
- Figure 21: South America Electric Propulsion Systems Industry Revenue Share (%), by Export Market Analysis (Value & Volume) 2025 & 2033
- Figure 22: South America Electric Propulsion Systems Industry Revenue (Million), by Price Trend Analysis 2025 & 2033
- Figure 23: South America Electric Propulsion Systems Industry Revenue Share (%), by Price Trend Analysis 2025 & 2033
- Figure 24: South America Electric Propulsion Systems Industry Revenue (Million), by Country 2025 & 2033
- Figure 25: South America Electric Propulsion Systems Industry Revenue Share (%), by Country 2025 & 2033
- Figure 26: Europe Electric Propulsion Systems Industry Revenue (Million), by Production Analysis 2025 & 2033
- Figure 27: Europe Electric Propulsion Systems Industry Revenue Share (%), by Production Analysis 2025 & 2033
- Figure 28: Europe Electric Propulsion Systems Industry Revenue (Million), by Consumption Analysis 2025 & 2033
- Figure 29: Europe Electric Propulsion Systems Industry Revenue Share (%), by Consumption Analysis 2025 & 2033
- Figure 30: Europe Electric Propulsion Systems Industry Revenue (Million), by Import Market Analysis (Value & Volume) 2025 & 2033
- Figure 31: Europe Electric Propulsion Systems Industry Revenue Share (%), by Import Market Analysis (Value & Volume) 2025 & 2033
- Figure 32: Europe Electric Propulsion Systems Industry Revenue (Million), by Export Market Analysis (Value & Volume) 2025 & 2033
- Figure 33: Europe Electric Propulsion Systems Industry Revenue Share (%), by Export Market Analysis (Value & Volume) 2025 & 2033
- Figure 34: Europe Electric Propulsion Systems Industry Revenue (Million), by Price Trend Analysis 2025 & 2033
- Figure 35: Europe Electric Propulsion Systems Industry Revenue Share (%), by Price Trend Analysis 2025 & 2033
- Figure 36: Europe Electric Propulsion Systems Industry Revenue (Million), by Country 2025 & 2033
- Figure 37: Europe Electric Propulsion Systems Industry Revenue Share (%), by Country 2025 & 2033
- Figure 38: Middle East & Africa Electric Propulsion Systems Industry Revenue (Million), by Production Analysis 2025 & 2033
- Figure 39: Middle East & Africa Electric Propulsion Systems Industry Revenue Share (%), by Production Analysis 2025 & 2033
- Figure 40: Middle East & Africa Electric Propulsion Systems Industry Revenue (Million), by Consumption Analysis 2025 & 2033
- Figure 41: Middle East & Africa Electric Propulsion Systems Industry Revenue Share (%), by Consumption Analysis 2025 & 2033
- Figure 42: Middle East & Africa Electric Propulsion Systems Industry Revenue (Million), by Import Market Analysis (Value & Volume) 2025 & 2033
- Figure 43: Middle East & Africa Electric Propulsion Systems Industry Revenue Share (%), by Import Market Analysis (Value & Volume) 2025 & 2033
- Figure 44: Middle East & Africa Electric Propulsion Systems Industry Revenue (Million), by Export Market Analysis (Value & Volume) 2025 & 2033
- Figure 45: Middle East & Africa Electric Propulsion Systems Industry Revenue Share (%), by Export Market Analysis (Value & Volume) 2025 & 2033
- Figure 46: Middle East & Africa Electric Propulsion Systems Industry Revenue (Million), by Price Trend Analysis 2025 & 2033
- Figure 47: Middle East & Africa Electric Propulsion Systems Industry Revenue Share (%), by Price Trend Analysis 2025 & 2033
- Figure 48: Middle East & Africa Electric Propulsion Systems Industry Revenue (Million), by Country 2025 & 2033
- Figure 49: Middle East & Africa Electric Propulsion Systems Industry Revenue Share (%), by Country 2025 & 2033
- Figure 50: Asia Pacific Electric Propulsion Systems Industry Revenue (Million), by Production Analysis 2025 & 2033
- Figure 51: Asia Pacific Electric Propulsion Systems Industry Revenue Share (%), by Production Analysis 2025 & 2033
- Figure 52: Asia Pacific Electric Propulsion Systems Industry Revenue (Million), by Consumption Analysis 2025 & 2033
- Figure 53: Asia Pacific Electric Propulsion Systems Industry Revenue Share (%), by Consumption Analysis 2025 & 2033
- Figure 54: Asia Pacific Electric Propulsion Systems Industry Revenue (Million), by Import Market Analysis (Value & Volume) 2025 & 2033
- Figure 55: Asia Pacific Electric Propulsion Systems Industry Revenue Share (%), by Import Market Analysis (Value & Volume) 2025 & 2033
- Figure 56: Asia Pacific Electric Propulsion Systems Industry Revenue (Million), by Export Market Analysis (Value & Volume) 2025 & 2033
- Figure 57: Asia Pacific Electric Propulsion Systems Industry Revenue Share (%), by Export Market Analysis (Value & Volume) 2025 & 2033
- Figure 58: Asia Pacific Electric Propulsion Systems Industry Revenue (Million), by Price Trend Analysis 2025 & 2033
- Figure 59: Asia Pacific Electric Propulsion Systems Industry Revenue Share (%), by Price Trend Analysis 2025 & 2033
- Figure 60: Asia Pacific Electric Propulsion Systems Industry Revenue (Million), by Country 2025 & 2033
- Figure 61: Asia Pacific Electric Propulsion Systems Industry Revenue Share (%), by Country 2025 & 2033
List of Tables
- Table 1: Global Electric Propulsion Systems Industry Revenue Million Forecast, by Production Analysis 2020 & 2033
- Table 2: Global Electric Propulsion Systems Industry Revenue Million Forecast, by Consumption Analysis 2020 & 2033
- Table 3: Global Electric Propulsion Systems Industry Revenue Million Forecast, by Import Market Analysis (Value & Volume) 2020 & 2033
- Table 4: Global Electric Propulsion Systems Industry Revenue Million Forecast, by Export Market Analysis (Value & Volume) 2020 & 2033
- Table 5: Global Electric Propulsion Systems Industry Revenue Million Forecast, by Price Trend Analysis 2020 & 2033
- Table 6: Global Electric Propulsion Systems Industry Revenue Million Forecast, by Region 2020 & 2033
- Table 7: Global Electric Propulsion Systems Industry Revenue Million Forecast, by Production Analysis 2020 & 2033
- Table 8: Global Electric Propulsion Systems Industry Revenue Million Forecast, by Consumption Analysis 2020 & 2033
- Table 9: Global Electric Propulsion Systems Industry Revenue Million Forecast, by Import Market Analysis (Value & Volume) 2020 & 2033
- Table 10: Global Electric Propulsion Systems Industry Revenue Million Forecast, by Export Market Analysis (Value & Volume) 2020 & 2033
- Table 11: Global Electric Propulsion Systems Industry Revenue Million Forecast, by Price Trend Analysis 2020 & 2033
- Table 12: Global Electric Propulsion Systems Industry Revenue Million Forecast, by Country 2020 & 2033
- Table 13: United States Electric Propulsion Systems Industry Revenue (Million) Forecast, by Application 2020 & 2033
- Table 14: Canada Electric Propulsion Systems Industry Revenue (Million) Forecast, by Application 2020 & 2033
- Table 15: Mexico Electric Propulsion Systems Industry Revenue (Million) Forecast, by Application 2020 & 2033
- Table 16: Global Electric Propulsion Systems Industry Revenue Million Forecast, by Production Analysis 2020 & 2033
- Table 17: Global Electric Propulsion Systems Industry Revenue Million Forecast, by Consumption Analysis 2020 & 2033
- Table 18: Global Electric Propulsion Systems Industry Revenue Million Forecast, by Import Market Analysis (Value & Volume) 2020 & 2033
- Table 19: Global Electric Propulsion Systems Industry Revenue Million Forecast, by Export Market Analysis (Value & Volume) 2020 & 2033
- Table 20: Global Electric Propulsion Systems Industry Revenue Million Forecast, by Price Trend Analysis 2020 & 2033
- Table 21: Global Electric Propulsion Systems Industry Revenue Million Forecast, by Country 2020 & 2033
- Table 22: Brazil Electric Propulsion Systems Industry Revenue (Million) Forecast, by Application 2020 & 2033
- Table 23: Argentina Electric Propulsion Systems Industry Revenue (Million) Forecast, by Application 2020 & 2033
- Table 24: Rest of South America Electric Propulsion Systems Industry Revenue (Million) Forecast, by Application 2020 & 2033
- Table 25: Global Electric Propulsion Systems Industry Revenue Million Forecast, by Production Analysis 2020 & 2033
- Table 26: Global Electric Propulsion Systems Industry Revenue Million Forecast, by Consumption Analysis 2020 & 2033
- Table 27: Global Electric Propulsion Systems Industry Revenue Million Forecast, by Import Market Analysis (Value & Volume) 2020 & 2033
- Table 28: Global Electric Propulsion Systems Industry Revenue Million Forecast, by Export Market Analysis (Value & Volume) 2020 & 2033
- Table 29: Global Electric Propulsion Systems Industry Revenue Million Forecast, by Price Trend Analysis 2020 & 2033
- Table 30: Global Electric Propulsion Systems Industry Revenue Million Forecast, by Country 2020 & 2033
- Table 31: United Kingdom Electric Propulsion Systems Industry Revenue (Million) Forecast, by Application 2020 & 2033
- Table 32: Germany Electric Propulsion Systems Industry Revenue (Million) Forecast, by Application 2020 & 2033
- Table 33: France Electric Propulsion Systems Industry Revenue (Million) Forecast, by Application 2020 & 2033
- Table 34: Italy Electric Propulsion Systems Industry Revenue (Million) Forecast, by Application 2020 & 2033
- Table 35: Spain Electric Propulsion Systems Industry Revenue (Million) Forecast, by Application 2020 & 2033
- Table 36: Russia Electric Propulsion Systems Industry Revenue (Million) Forecast, by Application 2020 & 2033
- Table 37: Benelux Electric Propulsion Systems Industry Revenue (Million) Forecast, by Application 2020 & 2033
- Table 38: Nordics Electric Propulsion Systems Industry Revenue (Million) Forecast, by Application 2020 & 2033
- Table 39: Rest of Europe Electric Propulsion Systems Industry Revenue (Million) Forecast, by Application 2020 & 2033
- Table 40: Global Electric Propulsion Systems Industry Revenue Million Forecast, by Production Analysis 2020 & 2033
- Table 41: Global Electric Propulsion Systems Industry Revenue Million Forecast, by Consumption Analysis 2020 & 2033
- Table 42: Global Electric Propulsion Systems Industry Revenue Million Forecast, by Import Market Analysis (Value & Volume) 2020 & 2033
- Table 43: Global Electric Propulsion Systems Industry Revenue Million Forecast, by Export Market Analysis (Value & Volume) 2020 & 2033
- Table 44: Global Electric Propulsion Systems Industry Revenue Million Forecast, by Price Trend Analysis 2020 & 2033
- Table 45: Global Electric Propulsion Systems Industry Revenue Million Forecast, by Country 2020 & 2033
- Table 46: Turkey Electric Propulsion Systems Industry Revenue (Million) Forecast, by Application 2020 & 2033
- Table 47: Israel Electric Propulsion Systems Industry Revenue (Million) Forecast, by Application 2020 & 2033
- Table 48: GCC Electric Propulsion Systems Industry Revenue (Million) Forecast, by Application 2020 & 2033
- Table 49: North Africa Electric Propulsion Systems Industry Revenue (Million) Forecast, by Application 2020 & 2033
- Table 50: South Africa Electric Propulsion Systems Industry Revenue (Million) Forecast, by Application 2020 & 2033
- Table 51: Rest of Middle East & Africa Electric Propulsion Systems Industry Revenue (Million) Forecast, by Application 2020 & 2033
- Table 52: Global Electric Propulsion Systems Industry Revenue Million Forecast, by Production Analysis 2020 & 2033
- Table 53: Global Electric Propulsion Systems Industry Revenue Million Forecast, by Consumption Analysis 2020 & 2033
- Table 54: Global Electric Propulsion Systems Industry Revenue Million Forecast, by Import Market Analysis (Value & Volume) 2020 & 2033
- Table 55: Global Electric Propulsion Systems Industry Revenue Million Forecast, by Export Market Analysis (Value & Volume) 2020 & 2033
- Table 56: Global Electric Propulsion Systems Industry Revenue Million Forecast, by Price Trend Analysis 2020 & 2033
- Table 57: Global Electric Propulsion Systems Industry Revenue Million Forecast, by Country 2020 & 2033
- Table 58: China Electric Propulsion Systems Industry Revenue (Million) Forecast, by Application 2020 & 2033
- Table 59: India Electric Propulsion Systems Industry Revenue (Million) Forecast, by Application 2020 & 2033
- Table 60: Japan Electric Propulsion Systems Industry Revenue (Million) Forecast, by Application 2020 & 2033
- Table 61: South Korea Electric Propulsion Systems Industry Revenue (Million) Forecast, by Application 2020 & 2033
- Table 62: ASEAN Electric Propulsion Systems Industry Revenue (Million) Forecast, by Application 2020 & 2033
- Table 63: Oceania Electric Propulsion Systems Industry Revenue (Million) Forecast, by Application 2020 & 2033
- Table 64: Rest of Asia Pacific Electric Propulsion Systems Industry Revenue (Million) Forecast, by Application 2020 & 2033
Frequently Asked Questions
1. What is the projected Compound Annual Growth Rate (CAGR) of the Electric Propulsion Systems Industry?
The projected CAGR is approximately 6.09%.
2. Which companies are prominent players in the Electric Propulsion Systems Industry?
Key companies in the market include Accion Systems Inc, SITAEL SpA, Airbus SE, Daihatsu Diesel Mfg Co Ltd, Safran SA, Aerojet Rocketdyne Holdings Inc, Orbital ATK (Northrop Grumman Corporation), Efficient Drivetrains Inc (Cummins Inc ), Collins Aerospace (RTX Corporation, Busek Co Inc, Thales Alenia Space, General Electric Company, The Boeing Company.
3. What are the main segments of the Electric Propulsion Systems Industry?
The market segments include Production Analysis, Consumption Analysis, Import Market Analysis (Value & Volume), Export Market Analysis (Value & Volume), Price Trend Analysis.
4. Can you provide details about the market size?
The market size is estimated to be USD 10.94 Million as of 2022.
5. What are some drivers contributing to market growth?
; Increased Seaborne Threats And Ambiguous Maritime Security Policies; Increasing Adoption Of Security Technologies In Bric Countries.
6. What are the notable trends driving market growth?
Space Segment Envisioned to Experience Highest Growth During the Forecast Period.
7. Are there any restraints impacting market growth?
; High Risk Rate In Ungoverned Zones; Unstructured Security Standards And Technologies.
8. Can you provide examples of recent developments in the market?
N/A
9. What pricing options are available for accessing the report?
Pricing options include single-user, multi-user, and enterprise licenses priced at USD 4750, USD 5250, and USD 8750 respectively.
10. Is the market size provided in terms of value or volume?
The market size is provided in terms of value, measured in Million.
11. Are there any specific market keywords associated with the report?
Yes, the market keyword associated with the report is "Electric Propulsion Systems Industry," which aids in identifying and referencing the specific market segment covered.
12. How do I determine which pricing option suits my needs best?
The pricing options vary based on user requirements and access needs. Individual users may opt for single-user licenses, while businesses requiring broader access may choose multi-user or enterprise licenses for cost-effective access to the report.
13. Are there any additional resources or data provided in the Electric Propulsion Systems Industry report?
While the report offers comprehensive insights, it's advisable to review the specific contents or supplementary materials provided to ascertain if additional resources or data are available.
14. How can I stay updated on further developments or reports in the Electric Propulsion Systems Industry?
To stay informed about further developments, trends, and reports in the Electric Propulsion Systems Industry, consider subscribing to industry newsletters, following relevant companies and organizations, or regularly checking reputable industry news sources and publications.
Methodology
Step 1 - Identification of Relevant Samples Size from Population Database


Step 2 - Approaches for Defining Global Market Size (Value, Volume* & Price*)

Note*: In applicable scenarios
Step 3 - Data Sources
Primary Research
- Web Analytics
- Survey Reports
- Research Institute
- Latest Research Reports
- Opinion Leaders
Secondary Research
- Annual Reports
- White Paper
- Latest Press Release
- Industry Association
- Paid Database
- Investor Presentations

Step 4 - Data Triangulation
Involves using different sources of information in order to increase the validity of a study
These sources are likely to be stakeholders in a program - participants, other researchers, program staff, other community members, and so on.
Then we put all data in single framework & apply various statistical tools to find out the dynamic on the market.
During the analysis stage, feedback from the stakeholder groups would be compared to determine areas of agreement as well as areas of divergence