

Key Insights
The electric traction motor market is poised for significant expansion, driven by the global imperative for sustainable transportation and increasing electrification. With a projected market size of $15.87 billion in 2025, and a compound annual growth rate (CAGR) of 8.82%, the industry is set for substantial growth through 2033. Key catalysts include stringent global emission regulations favoring electric vehicle (EV) adoption and modernization of railway infrastructure. Escalating demand for high-efficiency power solutions in industrial machinery further fuels market development. Technological innovations enhancing power density, efficiency, and cost-effectiveness are also critical drivers. While initial capital investment and charging infrastructure requirements present hurdles, ongoing technological advancements are mitigating these constraints, facilitating broader market adoption. The market is segmented by motor type, with alternating current (AC) motors currently leading over direct current (DC) motors, particularly in high-power applications like rail. Motors with power ratings exceeding 400 kW dominate, driven by their application in heavy-duty sectors. Geographically, North America and Europe hold significant market shares, while the Asia-Pacific region is anticipated to experience rapid growth due to substantial investments in electric mobility and industrial infrastructure.
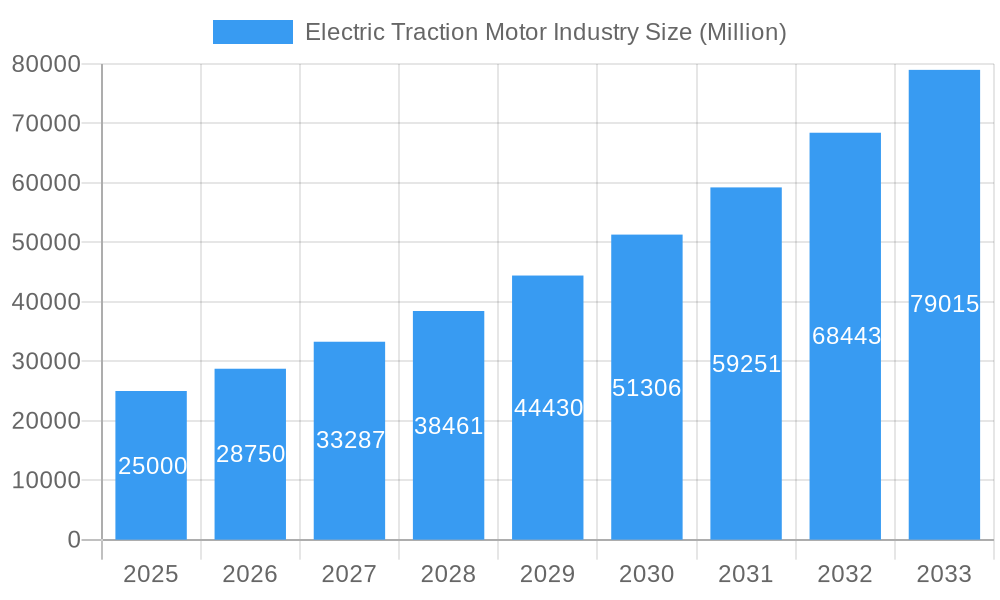
Electric Traction Motor Industry Market Size (In Billion)
The competitive environment is characterized by innovation and strategic alliances. Leading companies are focusing on advanced product development, collaborative partnerships, and comprehensive after-sales support. Future market evolution will be shaped by breakthroughs in battery technology, expansion of high-speed rail networks, and increased industrial automation. The integration of smart technologies and data analytics into motor design and operation will enhance performance and reliability, boosting market appeal. The electric traction motor market is expected to maintain its upward trajectory, offering significant opportunities for stakeholders. Government incentives and supportive policies are anticipated to accelerate growth across major regions, contributing to substantial market expansion throughout the forecast period.
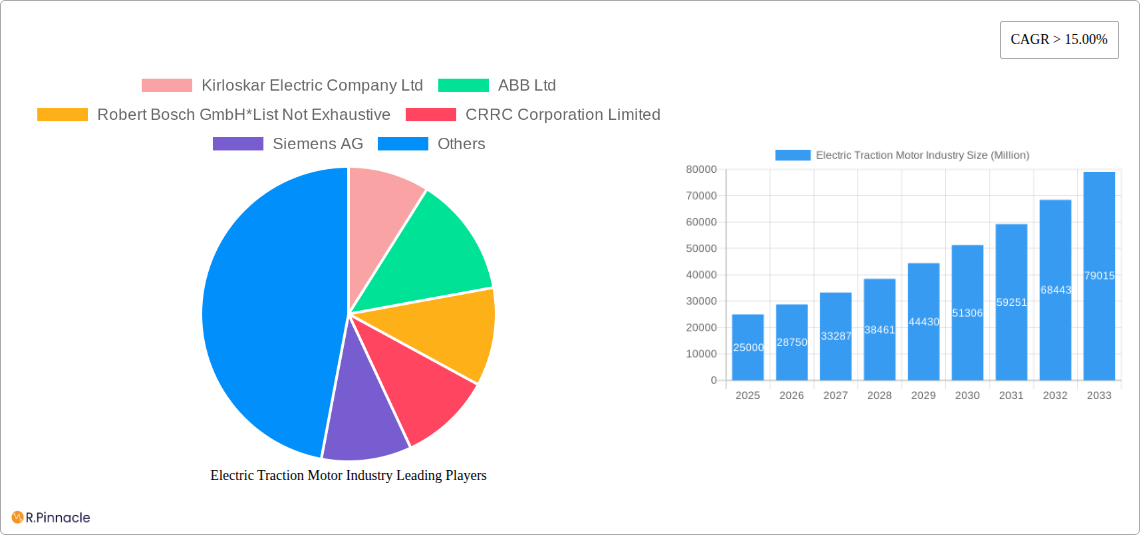
Electric Traction Motor Industry Company Market Share
Electric Traction Motor Industry Report: 2019-2033 Forecast
This comprehensive report provides an in-depth analysis of the Electric Traction Motor industry, projecting robust growth from 2019 to 2033. Valued at xx Million in 2025, the market is poised for significant expansion, driven by technological advancements and increasing demand across diverse sectors. This report is crucial for industry professionals, investors, and strategic decision-makers seeking actionable insights into this dynamic market.
Electric Traction Motor Industry Market Structure & Innovation Trends
The Electric Traction Motor market exhibits a moderately concentrated structure, with key players like Kirloskar Electric Company Ltd, ABB Ltd, Robert Bosch GmbH, CRRC Corporation Limited, Siemens AG, Alstom SA, Traktionssysteme Austria (TSA) GmbH, CG Power and Industrial Solutions Ltd, General Electric Company, and Skoda Transportation AS holding significant market share. Market share dynamics are influenced by continuous innovation, focusing on efficiency improvements, reduced emissions, and advanced control systems. Regulatory frameworks, particularly those concerning environmental standards and safety regulations, play a crucial role. Product substitutes, such as alternative propulsion systems, pose a competitive threat, albeit limited currently. The market is experiencing a moderate level of M&A activity, with deal values averaging xx Million in recent years.
- Market Concentration: Moderately concentrated, with top 10 players holding approximately xx% of market share in 2025.
- Innovation Drivers: Improved efficiency, reduced emissions, advanced control systems, lightweight materials.
- Regulatory Frameworks: Stringent emission norms and safety standards drive innovation and market growth.
- M&A Activity: Average deal value approximately xx Million, with xx deals closed between 2019 and 2024.
Electric Traction Motor Industry Market Dynamics & Trends
The Electric Traction Motor market is experiencing robust growth, driven by the burgeoning electric vehicle (EV) sector and the ongoing electrification of railways globally. The Compound Annual Growth Rate (CAGR) is projected to be xx% during the forecast period (2025-2033). Increasing government support for green transportation, coupled with declining battery costs, significantly contributes to market expansion. Technological advancements, such as the development of high-power density motors and improved power electronics, are disrupting the market landscape. Consumer preference for eco-friendly transportation solutions fuels demand. Competitive dynamics are shaped by technological leadership, cost efficiency, and strategic partnerships. Market penetration of electric traction motors in various applications is steadily increasing, with railway and EV sectors leading the way.
Dominant Regions & Segments in Electric Traction Motor Industry
The Asia-Pacific region is expected to dominate the Electric Traction Motor market during the forecast period due to significant investments in infrastructure development, particularly in high-speed rail and electric vehicle manufacturing. Within this region, China and India are projected to be the leading countries.
- Leading Region: Asia-Pacific
- Leading Countries: China, India
- Dominant Segment (Type): Alternating Current (AC) motors are projected to hold the largest market share due to their higher efficiency in high-power applications.
- Dominant Segment (Power Rating): Above 400 kW, driven by high-speed rail and heavy-duty electric vehicle applications.
- Dominant Segment (Application): Railway sector continues to dominate, followed by the rapidly growing electric vehicle segment.
Key Drivers:
- Asia-Pacific: Robust infrastructure development, government support for electric transportation, growing EV adoption.
- China: Massive investments in high-speed rail and electric vehicle manufacturing.
- India: Expanding railway network and increasing electric vehicle production.
Electric Traction Motor Industry Product Innovations
Recent innovations focus on increasing power density, improving efficiency, reducing weight, and enhancing durability. Silicon carbide (SiC) power modules and advanced winding techniques are key technological trends. These advancements lead to improved performance, extended lifespan, and reduced operational costs, making electric traction motors increasingly competitive across various applications.
Report Scope & Segmentation Analysis
This report provides a comprehensive segmentation analysis of the Electric Traction Motor market based on type (Alternating Current, Direct Current), power rating (Below 200 kW, 200-400 kW, Above 400 kW), and application (Railway, Electric Vehicle, Industrial Machinery, Others). Each segment's market size, growth projections, and competitive landscape are thoroughly examined. The market size for AC motors is projected to be xx Million in 2025, growing to xx Million by 2033. DC motors, though smaller in market share, are expected to see substantial growth, fueled primarily by electric vehicle applications. The railway application segment currently dominates but the EV segment is expected to show the highest growth rate in the coming years.
Key Drivers of Electric Traction Motor Industry Growth
The industry’s growth is fueled by several factors including stringent emission regulations, rapid advancements in electric vehicle technology, rising demand for sustainable transportation solutions, and increasing investments in railway infrastructure modernization globally. Government incentives and subsidies for electric vehicles also contribute significantly.
Challenges in the Electric Traction Motor Industry Sector
The industry faces challenges such as the high initial cost of electric traction motors, the complex supply chain management required for procuring rare earth materials, and intense competition among established and emerging players. Regulatory uncertainties in some regions also pose a risk. Furthermore, the reliability and durability of electric motors in extreme operating conditions remain areas of ongoing improvement.
Emerging Opportunities in Electric Traction Motor Industry
Significant opportunities exist in the development of next-generation electric traction motors with enhanced power density, improved thermal management, and reduced reliance on rare earth materials. The expansion of the electric vehicle market in developing economies presents substantial growth potential. Furthermore, the increasing adoption of hybrid and electric buses and other commercial vehicles offers further opportunities for market expansion.
Leading Players in the Electric Traction Motor Industry Market
- Kirloskar Electric Company Ltd
- ABB Ltd
- Robert Bosch GmbH
- CRRC Corporation Limited
- Siemens AG
- Alstom SA
- Traktionssysteme Austria (TSA) GmbH
- CG Power and Industrial Solutions Ltd
- General Electric Company
- Skoda Transportation AS
Key Developments in Electric Traction Motor Industry
- 2022 Q3: ABB launched a new range of high-efficiency electric traction motors for electric buses.
- 2023 Q1: Siemens and Alstom announced a strategic partnership to develop next-generation electric traction systems for high-speed rail.
- 2024 Q2: Kirloskar Electric acquired a smaller motor manufacturer, expanding its market share. (Further developments will be added as they occur.)
Future Outlook for Electric Traction Motor Industry Market
The Electric Traction Motor market is expected to experience significant growth over the forecast period, driven by continued advancements in battery technology, increasing demand for sustainable transportation solutions, and favorable government policies supporting electric mobility. Strategic partnerships and investments in research and development will be crucial for market success. The focus on efficiency, reliability, and cost-effectiveness will define the competitive landscape in the coming years.
Electric Traction Motor Industry Segmentation
-
1. Type
- 1.1. Alternating Current
- 1.2. Direct Current
-
2. Power Rating
- 2.1. Below 200 kW
- 2.2. 200 - 400 kW
- 2.3. Above 400 kW
-
3. Application
- 3.1. Railway
- 3.2. Electric Vehicle
- 3.3. Industrial Machinery
- 3.4. Others
Electric Traction Motor Industry Segmentation By Geography
- 1. North America
- 2. Asia Pacific
- 3. Europe
- 4. South America
- 5. Middle East and Africa
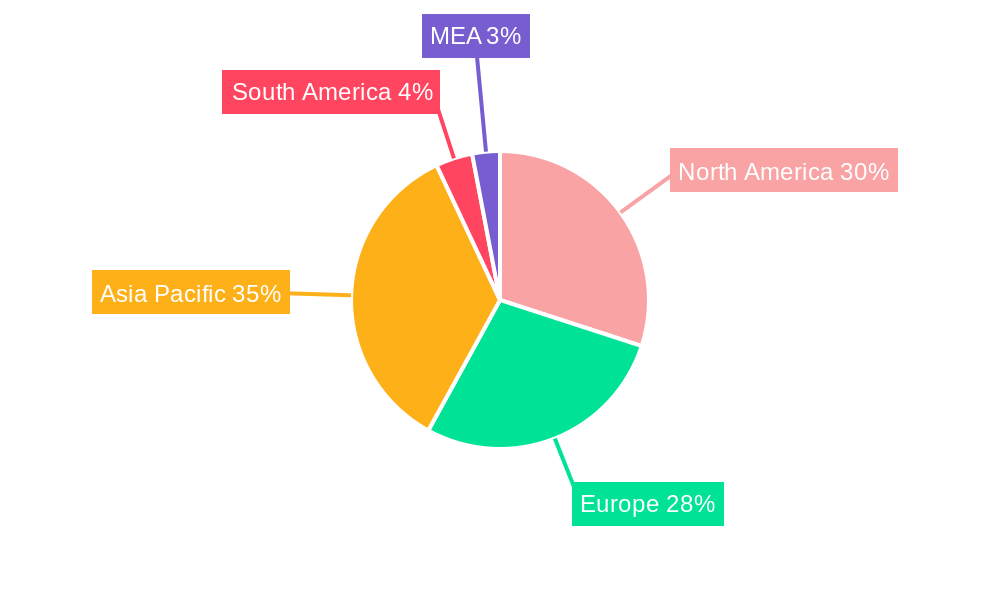
Electric Traction Motor Industry Regional Market Share
Geographic Coverage of Electric Traction Motor Industry
Electric Traction Motor Industry REPORT HIGHLIGHTS
| Aspects | Details |
|---|---|
| Study Period | 2020-2034 |
| Base Year | 2025 |
| Estimated Year | 2026 |
| Forecast Period | 2026-2034 |
| Historical Period | 2020-2025 |
| Growth Rate | CAGR of 8.82% from 2020-2034 |
| Segmentation |
|
Table of Contents
- 1. Introduction
- 1.1. Research Scope
- 1.2. Market Segmentation
- 1.3. Research Objective
- 1.4. Definitions and Assumptions
- 2. Executive Summary
- 2.1. Market Snapshot
- 3. Market Dynamics
- 3.1. Market Drivers
- 3.2. Market Restrains
- 3.3. Market Trends
- 3.4. Market Opportunities
- 4. Market Factor Analysis
- 4.1. Porters Five Forces
- 4.1.1. Bargaining Power of Suppliers
- 4.1.2. Bargaining Power of Buyers
- 4.1.3. Threat of New Entrants
- 4.1.4. Threat of Substitutes
- 4.1.5. Competitive Rivalry
- 4.2. PESTEL analysis
- 4.3. BCG Analysis
- 4.3.1. Stars (High Growth, High Market Share)
- 4.3.2. Cash Cows (Low Growth, High Market Share)
- 4.3.3. Question Mark (High Growth, Low Market Share)
- 4.3.4. Dogs (Low Growth, Low Market Share)
- 4.4. Ansoff Matrix Analysis
- 4.5. Supply Chain Analysis
- 4.6. Regulatory Landscape
- 4.7. Current Market Potential and Opportunity Assessment (TAM–SAM–SOM Framework)
- 4.8. PRI Analyst Note
- 4.1. Porters Five Forces
- 5. Market Analysis, Insights and Forecast 2021-2033
- 5.1. Market Analysis, Insights and Forecast - by Type
- 5.1.1. Alternating Current
- 5.1.2. Direct Current
- 5.2. Market Analysis, Insights and Forecast - by Power Rating
- 5.2.1. Below 200 kW
- 5.2.2. 200 - 400 kW
- 5.2.3. Above 400 kW
- 5.3. Market Analysis, Insights and Forecast - by Application
- 5.3.1. Railway
- 5.3.2. Electric Vehicle
- 5.3.3. Industrial Machinery
- 5.3.4. Others
- 5.4. Market Analysis, Insights and Forecast - by Region
- 5.4.1. North America
- 5.4.2. Asia Pacific
- 5.4.3. Europe
- 5.4.4. South America
- 5.4.5. Middle East and Africa
- 5.1. Market Analysis, Insights and Forecast - by Type
- 6. Global Electric Traction Motor Industry Analysis, Insights and Forecast, 2021-2033
- 6.1. Market Analysis, Insights and Forecast - by Type
- 6.1.1. Alternating Current
- 6.1.2. Direct Current
- 6.2. Market Analysis, Insights and Forecast - by Power Rating
- 6.2.1. Below 200 kW
- 6.2.2. 200 - 400 kW
- 6.2.3. Above 400 kW
- 6.3. Market Analysis, Insights and Forecast - by Application
- 6.3.1. Railway
- 6.3.2. Electric Vehicle
- 6.3.3. Industrial Machinery
- 6.3.4. Others
- 6.1. Market Analysis, Insights and Forecast - by Type
- 7. North America Electric Traction Motor Industry Analysis, Insights and Forecast, 2020-2032
- 7.1. Market Analysis, Insights and Forecast - by Type
- 7.1.1. Alternating Current
- 7.1.2. Direct Current
- 7.2. Market Analysis, Insights and Forecast - by Power Rating
- 7.2.1. Below 200 kW
- 7.2.2. 200 - 400 kW
- 7.2.3. Above 400 kW
- 7.3. Market Analysis, Insights and Forecast - by Application
- 7.3.1. Railway
- 7.3.2. Electric Vehicle
- 7.3.3. Industrial Machinery
- 7.3.4. Others
- 7.1. Market Analysis, Insights and Forecast - by Type
- 8. Asia Pacific Electric Traction Motor Industry Analysis, Insights and Forecast, 2020-2032
- 8.1. Market Analysis, Insights and Forecast - by Type
- 8.1.1. Alternating Current
- 8.1.2. Direct Current
- 8.2. Market Analysis, Insights and Forecast - by Power Rating
- 8.2.1. Below 200 kW
- 8.2.2. 200 - 400 kW
- 8.2.3. Above 400 kW
- 8.3. Market Analysis, Insights and Forecast - by Application
- 8.3.1. Railway
- 8.3.2. Electric Vehicle
- 8.3.3. Industrial Machinery
- 8.3.4. Others
- 8.1. Market Analysis, Insights and Forecast - by Type
- 9. Europe Electric Traction Motor Industry Analysis, Insights and Forecast, 2020-2032
- 9.1. Market Analysis, Insights and Forecast - by Type
- 9.1.1. Alternating Current
- 9.1.2. Direct Current
- 9.2. Market Analysis, Insights and Forecast - by Power Rating
- 9.2.1. Below 200 kW
- 9.2.2. 200 - 400 kW
- 9.2.3. Above 400 kW
- 9.3. Market Analysis, Insights and Forecast - by Application
- 9.3.1. Railway
- 9.3.2. Electric Vehicle
- 9.3.3. Industrial Machinery
- 9.3.4. Others
- 9.1. Market Analysis, Insights and Forecast - by Type
- 10. South America Electric Traction Motor Industry Analysis, Insights and Forecast, 2020-2032
- 10.1. Market Analysis, Insights and Forecast - by Type
- 10.1.1. Alternating Current
- 10.1.2. Direct Current
- 10.2. Market Analysis, Insights and Forecast - by Power Rating
- 10.2.1. Below 200 kW
- 10.2.2. 200 - 400 kW
- 10.2.3. Above 400 kW
- 10.3. Market Analysis, Insights and Forecast - by Application
- 10.3.1. Railway
- 10.3.2. Electric Vehicle
- 10.3.3. Industrial Machinery
- 10.3.4. Others
- 10.1. Market Analysis, Insights and Forecast - by Type
- 11. Middle East and Africa Electric Traction Motor Industry Analysis, Insights and Forecast, 2020-2032
- 11.1. Market Analysis, Insights and Forecast - by Type
- 11.1.1. Alternating Current
- 11.1.2. Direct Current
- 11.2. Market Analysis, Insights and Forecast - by Power Rating
- 11.2.1. Below 200 kW
- 11.2.2. 200 - 400 kW
- 11.2.3. Above 400 kW
- 11.3. Market Analysis, Insights and Forecast - by Application
- 11.3.1. Railway
- 11.3.2. Electric Vehicle
- 11.3.3. Industrial Machinery
- 11.3.4. Others
- 11.1. Market Analysis, Insights and Forecast - by Type
- 12. Competitive Analysis
- 12.1. Company Profiles
- 12.1.1 Kirloskar Electric Company Ltd
- 12.1.1.1. Company Overview
- 12.1.1.2. Products
- 12.1.1.3. Company Financials
- 12.1.1.4. SWOT Analysis
- 12.1.2 ABB Ltd
- 12.1.2.1. Company Overview
- 12.1.2.2. Products
- 12.1.2.3. Company Financials
- 12.1.2.4. SWOT Analysis
- 12.1.3 Robert Bosch GmbH*List Not Exhaustive
- 12.1.3.1. Company Overview
- 12.1.3.2. Products
- 12.1.3.3. Company Financials
- 12.1.3.4. SWOT Analysis
- 12.1.4 CRRC Corporation Limited
- 12.1.4.1. Company Overview
- 12.1.4.2. Products
- 12.1.4.3. Company Financials
- 12.1.4.4. SWOT Analysis
- 12.1.5 Siemens AG
- 12.1.5.1. Company Overview
- 12.1.5.2. Products
- 12.1.5.3. Company Financials
- 12.1.5.4. SWOT Analysis
- 12.1.6 Alstom SA
- 12.1.6.1. Company Overview
- 12.1.6.2. Products
- 12.1.6.3. Company Financials
- 12.1.6.4. SWOT Analysis
- 12.1.7 Traktionssysteme Austria (TSA) GmbH
- 12.1.7.1. Company Overview
- 12.1.7.2. Products
- 12.1.7.3. Company Financials
- 12.1.7.4. SWOT Analysis
- 12.1.8 CG Power and Industrial Solutions Ltd
- 12.1.8.1. Company Overview
- 12.1.8.2. Products
- 12.1.8.3. Company Financials
- 12.1.8.4. SWOT Analysis
- 12.1.9 General Electric Company
- 12.1.9.1. Company Overview
- 12.1.9.2. Products
- 12.1.9.3. Company Financials
- 12.1.9.4. SWOT Analysis
- 12.1.10 Skoda Transportation AS
- 12.1.10.1. Company Overview
- 12.1.10.2. Products
- 12.1.10.3. Company Financials
- 12.1.10.4. SWOT Analysis
- 12.1.1 Kirloskar Electric Company Ltd
- 12.2. Market Entropy
- 12.2.1 Company's Key Areas Served
- 12.2.2 Recent Developments
- 12.3. Company Market Share Analysis 2025
- 12.3.1 Top 5 Companies Market Share Analysis
- 12.3.2 Top 3 Companies Market Share Analysis
- 12.4. List of Potential Customers
- 13. Research Methodology
List of Figures
- Figure 1: Global Electric Traction Motor Industry Revenue Breakdown (billion, %) by Region 2025 & 2033
- Figure 2: North America Electric Traction Motor Industry Revenue (billion), by Type 2025 & 2033
- Figure 3: North America Electric Traction Motor Industry Revenue Share (%), by Type 2025 & 2033
- Figure 4: North America Electric Traction Motor Industry Revenue (billion), by Power Rating 2025 & 2033
- Figure 5: North America Electric Traction Motor Industry Revenue Share (%), by Power Rating 2025 & 2033
- Figure 6: North America Electric Traction Motor Industry Revenue (billion), by Application 2025 & 2033
- Figure 7: North America Electric Traction Motor Industry Revenue Share (%), by Application 2025 & 2033
- Figure 8: North America Electric Traction Motor Industry Revenue (billion), by Country 2025 & 2033
- Figure 9: North America Electric Traction Motor Industry Revenue Share (%), by Country 2025 & 2033
- Figure 10: Asia Pacific Electric Traction Motor Industry Revenue (billion), by Type 2025 & 2033
- Figure 11: Asia Pacific Electric Traction Motor Industry Revenue Share (%), by Type 2025 & 2033
- Figure 12: Asia Pacific Electric Traction Motor Industry Revenue (billion), by Power Rating 2025 & 2033
- Figure 13: Asia Pacific Electric Traction Motor Industry Revenue Share (%), by Power Rating 2025 & 2033
- Figure 14: Asia Pacific Electric Traction Motor Industry Revenue (billion), by Application 2025 & 2033
- Figure 15: Asia Pacific Electric Traction Motor Industry Revenue Share (%), by Application 2025 & 2033
- Figure 16: Asia Pacific Electric Traction Motor Industry Revenue (billion), by Country 2025 & 2033
- Figure 17: Asia Pacific Electric Traction Motor Industry Revenue Share (%), by Country 2025 & 2033
- Figure 18: Europe Electric Traction Motor Industry Revenue (billion), by Type 2025 & 2033
- Figure 19: Europe Electric Traction Motor Industry Revenue Share (%), by Type 2025 & 2033
- Figure 20: Europe Electric Traction Motor Industry Revenue (billion), by Power Rating 2025 & 2033
- Figure 21: Europe Electric Traction Motor Industry Revenue Share (%), by Power Rating 2025 & 2033
- Figure 22: Europe Electric Traction Motor Industry Revenue (billion), by Application 2025 & 2033
- Figure 23: Europe Electric Traction Motor Industry Revenue Share (%), by Application 2025 & 2033
- Figure 24: Europe Electric Traction Motor Industry Revenue (billion), by Country 2025 & 2033
- Figure 25: Europe Electric Traction Motor Industry Revenue Share (%), by Country 2025 & 2033
- Figure 26: South America Electric Traction Motor Industry Revenue (billion), by Type 2025 & 2033
- Figure 27: South America Electric Traction Motor Industry Revenue Share (%), by Type 2025 & 2033
- Figure 28: South America Electric Traction Motor Industry Revenue (billion), by Power Rating 2025 & 2033
- Figure 29: South America Electric Traction Motor Industry Revenue Share (%), by Power Rating 2025 & 2033
- Figure 30: South America Electric Traction Motor Industry Revenue (billion), by Application 2025 & 2033
- Figure 31: South America Electric Traction Motor Industry Revenue Share (%), by Application 2025 & 2033
- Figure 32: South America Electric Traction Motor Industry Revenue (billion), by Country 2025 & 2033
- Figure 33: South America Electric Traction Motor Industry Revenue Share (%), by Country 2025 & 2033
- Figure 34: Middle East and Africa Electric Traction Motor Industry Revenue (billion), by Type 2025 & 2033
- Figure 35: Middle East and Africa Electric Traction Motor Industry Revenue Share (%), by Type 2025 & 2033
- Figure 36: Middle East and Africa Electric Traction Motor Industry Revenue (billion), by Power Rating 2025 & 2033
- Figure 37: Middle East and Africa Electric Traction Motor Industry Revenue Share (%), by Power Rating 2025 & 2033
- Figure 38: Middle East and Africa Electric Traction Motor Industry Revenue (billion), by Application 2025 & 2033
- Figure 39: Middle East and Africa Electric Traction Motor Industry Revenue Share (%), by Application 2025 & 2033
- Figure 40: Middle East and Africa Electric Traction Motor Industry Revenue (billion), by Country 2025 & 2033
- Figure 41: Middle East and Africa Electric Traction Motor Industry Revenue Share (%), by Country 2025 & 2033
List of Tables
- Table 1: Global Electric Traction Motor Industry Revenue billion Forecast, by Type 2020 & 2033
- Table 2: Global Electric Traction Motor Industry Revenue billion Forecast, by Power Rating 2020 & 2033
- Table 3: Global Electric Traction Motor Industry Revenue billion Forecast, by Application 2020 & 2033
- Table 4: Global Electric Traction Motor Industry Revenue billion Forecast, by Region 2020 & 2033
- Table 5: Global Electric Traction Motor Industry Revenue billion Forecast, by Type 2020 & 2033
- Table 6: Global Electric Traction Motor Industry Revenue billion Forecast, by Power Rating 2020 & 2033
- Table 7: Global Electric Traction Motor Industry Revenue billion Forecast, by Application 2020 & 2033
- Table 8: Global Electric Traction Motor Industry Revenue billion Forecast, by Country 2020 & 2033
- Table 9: Global Electric Traction Motor Industry Revenue billion Forecast, by Type 2020 & 2033
- Table 10: Global Electric Traction Motor Industry Revenue billion Forecast, by Power Rating 2020 & 2033
- Table 11: Global Electric Traction Motor Industry Revenue billion Forecast, by Application 2020 & 2033
- Table 12: Global Electric Traction Motor Industry Revenue billion Forecast, by Country 2020 & 2033
- Table 13: Global Electric Traction Motor Industry Revenue billion Forecast, by Type 2020 & 2033
- Table 14: Global Electric Traction Motor Industry Revenue billion Forecast, by Power Rating 2020 & 2033
- Table 15: Global Electric Traction Motor Industry Revenue billion Forecast, by Application 2020 & 2033
- Table 16: Global Electric Traction Motor Industry Revenue billion Forecast, by Country 2020 & 2033
- Table 17: Global Electric Traction Motor Industry Revenue billion Forecast, by Type 2020 & 2033
- Table 18: Global Electric Traction Motor Industry Revenue billion Forecast, by Power Rating 2020 & 2033
- Table 19: Global Electric Traction Motor Industry Revenue billion Forecast, by Application 2020 & 2033
- Table 20: Global Electric Traction Motor Industry Revenue billion Forecast, by Country 2020 & 2033
- Table 21: Global Electric Traction Motor Industry Revenue billion Forecast, by Type 2020 & 2033
- Table 22: Global Electric Traction Motor Industry Revenue billion Forecast, by Power Rating 2020 & 2033
- Table 23: Global Electric Traction Motor Industry Revenue billion Forecast, by Application 2020 & 2033
- Table 24: Global Electric Traction Motor Industry Revenue billion Forecast, by Country 2020 & 2033
Frequently Asked Questions
1. What is the projected Compound Annual Growth Rate (CAGR) of the Electric Traction Motor Industry?
The projected CAGR is approximately 8.82%.
2. Which companies are prominent players in the Electric Traction Motor Industry?
Key companies in the market include Kirloskar Electric Company Ltd, ABB Ltd, Robert Bosch GmbH*List Not Exhaustive, CRRC Corporation Limited, Siemens AG, Alstom SA, Traktionssysteme Austria (TSA) GmbH, CG Power and Industrial Solutions Ltd, General Electric Company, Skoda Transportation AS.
3. What are the main segments of the Electric Traction Motor Industry?
The market segments include Type, Power Rating, Application.
4. Can you provide details about the market size?
The market size is estimated to be USD 15.87 billion as of 2022.
5. What are some drivers contributing to market growth?
4.; Increasing Integration Of Renewable Energy Generation4.; Aging Power Grids And Investments In Transmission And Distribution Infrastructure.
6. What are the notable trends driving market growth?
Electric Vehicle to Witness Significant Growth.
7. Are there any restraints impacting market growth?
4.; Lack Of Investor Confidence Due To Sociopolitical Instability In Some Countries.
8. Can you provide examples of recent developments in the market?
N/A
9. What pricing options are available for accessing the report?
Pricing options include single-user, multi-user, and enterprise licenses priced at USD 4750, USD 5250, and USD 8750 respectively.
10. Is the market size provided in terms of value or volume?
The market size is provided in terms of value, measured in billion.
11. Are there any specific market keywords associated with the report?
Yes, the market keyword associated with the report is "Electric Traction Motor Industry," which aids in identifying and referencing the specific market segment covered.
12. How do I determine which pricing option suits my needs best?
The pricing options vary based on user requirements and access needs. Individual users may opt for single-user licenses, while businesses requiring broader access may choose multi-user or enterprise licenses for cost-effective access to the report.
13. Are there any additional resources or data provided in the Electric Traction Motor Industry report?
While the report offers comprehensive insights, it's advisable to review the specific contents or supplementary materials provided to ascertain if additional resources or data are available.
14. How can I stay updated on further developments or reports in the Electric Traction Motor Industry?
To stay informed about further developments, trends, and reports in the Electric Traction Motor Industry, consider subscribing to industry newsletters, following relevant companies and organizations, or regularly checking reputable industry news sources and publications.
Methodology
Step 1 - Identification of Relevant Samples Size from Population Database


Step 2 - Approaches for Defining Global Market Size (Value, Volume* & Price*)

Note*: In applicable scenarios
Step 3 - Data Sources
Primary Research
- Web Analytics
- Survey Reports
- Research Institute
- Latest Research Reports
- Opinion Leaders
Secondary Research
- Annual Reports
- White Paper
- Latest Press Release
- Industry Association
- Paid Database
- Investor Presentations

Step 4 - Data Triangulation
Involves using different sources of information in order to increase the validity of a study
These sources are likely to be stakeholders in a program - participants, other researchers, program staff, other community members, and so on.
Then we put all data in single framework & apply various statistical tools to find out the dynamic on the market.
During the analysis stage, feedback from the stakeholder groups would be compared to determine areas of agreement as well as areas of divergence