

Key Insights
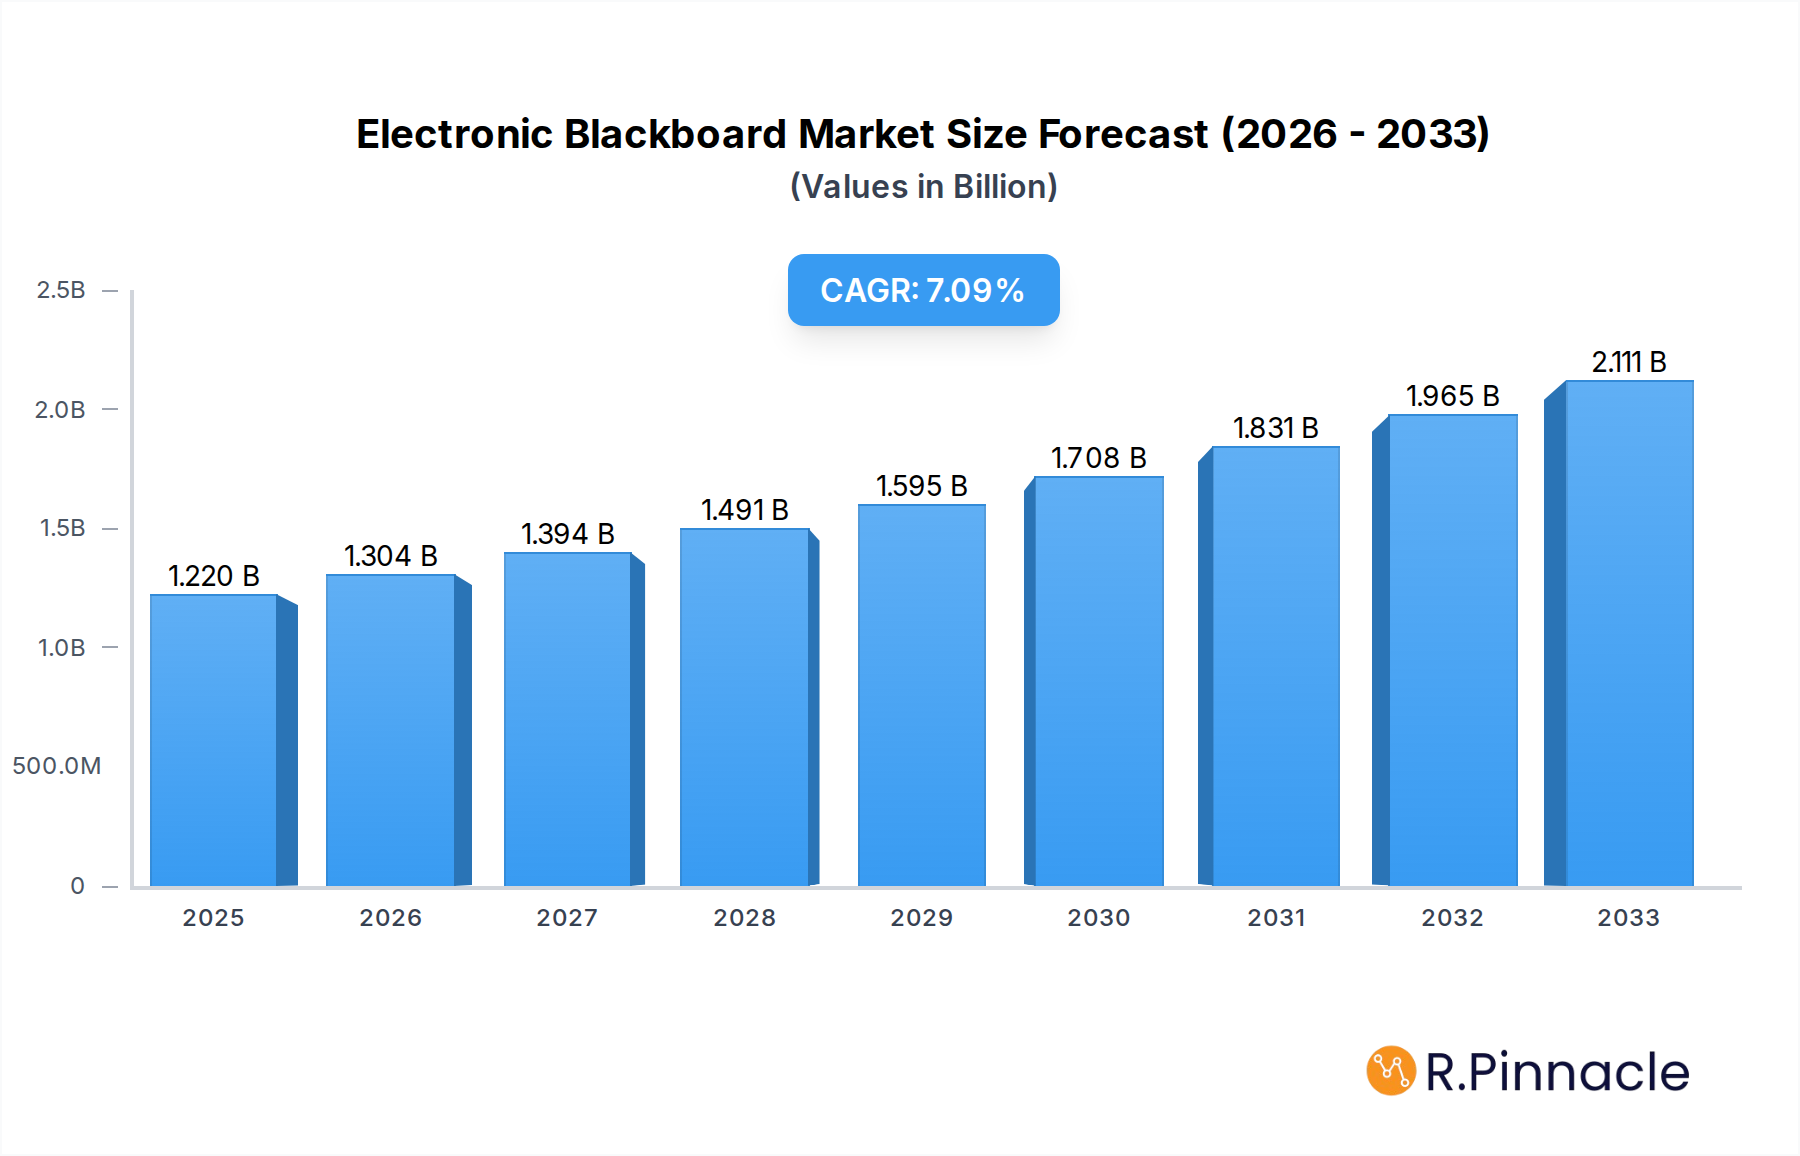
The global Electronic Blackboard market is poised for significant expansion, driven by the escalating demand for interactive and engaging learning environments across educational institutions and for home-based learning. With a projected market size of USD 1.22 billion in 2025, the market is expected to witness a robust Compound Annual Growth Rate (CAGR) of 6.6% over the forecast period of 2025-2033. This growth is fueled by advancements in display technology, increasing adoption of digital learning tools, and government initiatives promoting technology integration in education. The K-12 education segment, in particular, is a key driver, as schools increasingly invest in smart classrooms to enhance student participation and comprehension. Higher education institutions are also embracing electronic blackboards for their collaborative features and ability to deliver dynamic content. The "85 Inch" segment is expected to dominate the market in terms of volume and revenue due to its suitability for larger classrooms and lecture halls.

Electronic Blackboard Market Size (In Billion)
The market is propelled by the trend towards digitalization in education and the growing recognition of the benefits of interactive whiteboards in improving pedagogical outcomes. The increasing affordability of these technologies, coupled with the need for remote and hybrid learning solutions, further accentuates the growth trajectory. Key market drivers include the enhanced collaboration capabilities offered by electronic blackboards, their ability to integrate multimedia content, and the improved visual learning experience they provide. While the market enjoys strong growth, potential restraints could include the initial cost of implementation for some institutions, the need for adequate technical support and training, and the pace of technological obsolescence. However, the overall market outlook remains highly positive, with major players like HiSense, Hitevision, Seewo (CVTE), and Hikvision actively innovating and expanding their product portfolios to capture market share. The Asia Pacific region, led by China, is anticipated to be a significant contributor to market growth due to rapid technological adoption and a large student population.
Electronic Blackboard Company Market Share
This comprehensive report delves into the dynamic global Electronic Blackboard market, offering in-depth analysis and actionable insights for industry professionals. Spanning the study period from 2019 to 2033, with a base year of 2025 and a forecast period from 2025 to 2033, this report dissects market structure, growth drivers, regional dominance, product innovations, and future potential. Leveraging high-ranking keywords, this report aims to boost search visibility and engage key stakeholders in the burgeoning smart education and interactive display sectors.
Electronic Blackboard Market Structure & Innovation Trends
The Electronic Blackboard market exhibits a moderately concentrated structure, with key players like HiSense, Hitevision, Seewo (CVTE), and Hikvision holding significant market share. Innovation is a primary driver, fueled by advancements in touch technology, display resolution, and integrated software solutions designed to enhance educational and corporate collaboration. Regulatory frameworks, while generally supportive of technological adoption in education, can vary by region, influencing market entry and product compliance. The threat of product substitutes, such as traditional whiteboards augmented with digital projectors or standalone interactive displays, remains a factor, though the integrated nature of electronic blackboards offers a distinct advantage. End-user demographics are increasingly diverse, encompassing K-12 education, higher education, corporate training, and home use. Mergers and acquisitions (M&A) activity has been on the rise, with significant deal values exceeding billions of dollars as larger entities seek to consolidate their market position and expand their technological portfolios. For instance, recent M&A deals have focused on acquiring companies with advanced AI integration capabilities for smart classrooms.
Electronic Blackboard Market Dynamics & Trends
The Electronic Blackboard market is experiencing robust growth, driven by a confluence of accelerating factors. The increasing global emphasis on digital transformation in education and the corporate sector is a primary catalyst, with institutions investing billions in modernizing learning and collaboration environments. Technological disruptions, including the integration of AI-powered learning analytics, touchless interaction, and seamless connectivity with cloud-based platforms, are reshaping product offerings and consumer expectations. The projected CAGR for the forecast period is approximately xx%, underscoring the market's strong upward trajectory. Consumer preferences are shifting towards intuitive, user-friendly interfaces, enhanced interactivity, and versatile functionalities that support diverse pedagogical approaches and presentation styles. Market penetration is steadily increasing, particularly in developed economies where digital infrastructure is well-established. Competitive dynamics are intense, characterized by continuous product innovation, aggressive pricing strategies, and strategic partnerships aimed at expanding market reach. The adoption of smart classroom solutions, with electronic blackboards as a central component, is projected to reach over xx% by 2033, representing a substantial market opportunity worth billions. The evolution of remote and hybrid learning models further accentuates the demand for interactive and collaborative display solutions, positioning electronic blackboards as indispensable tools for the future of education and professional communication.
Dominant Regions & Segments in Electronic Blackboard
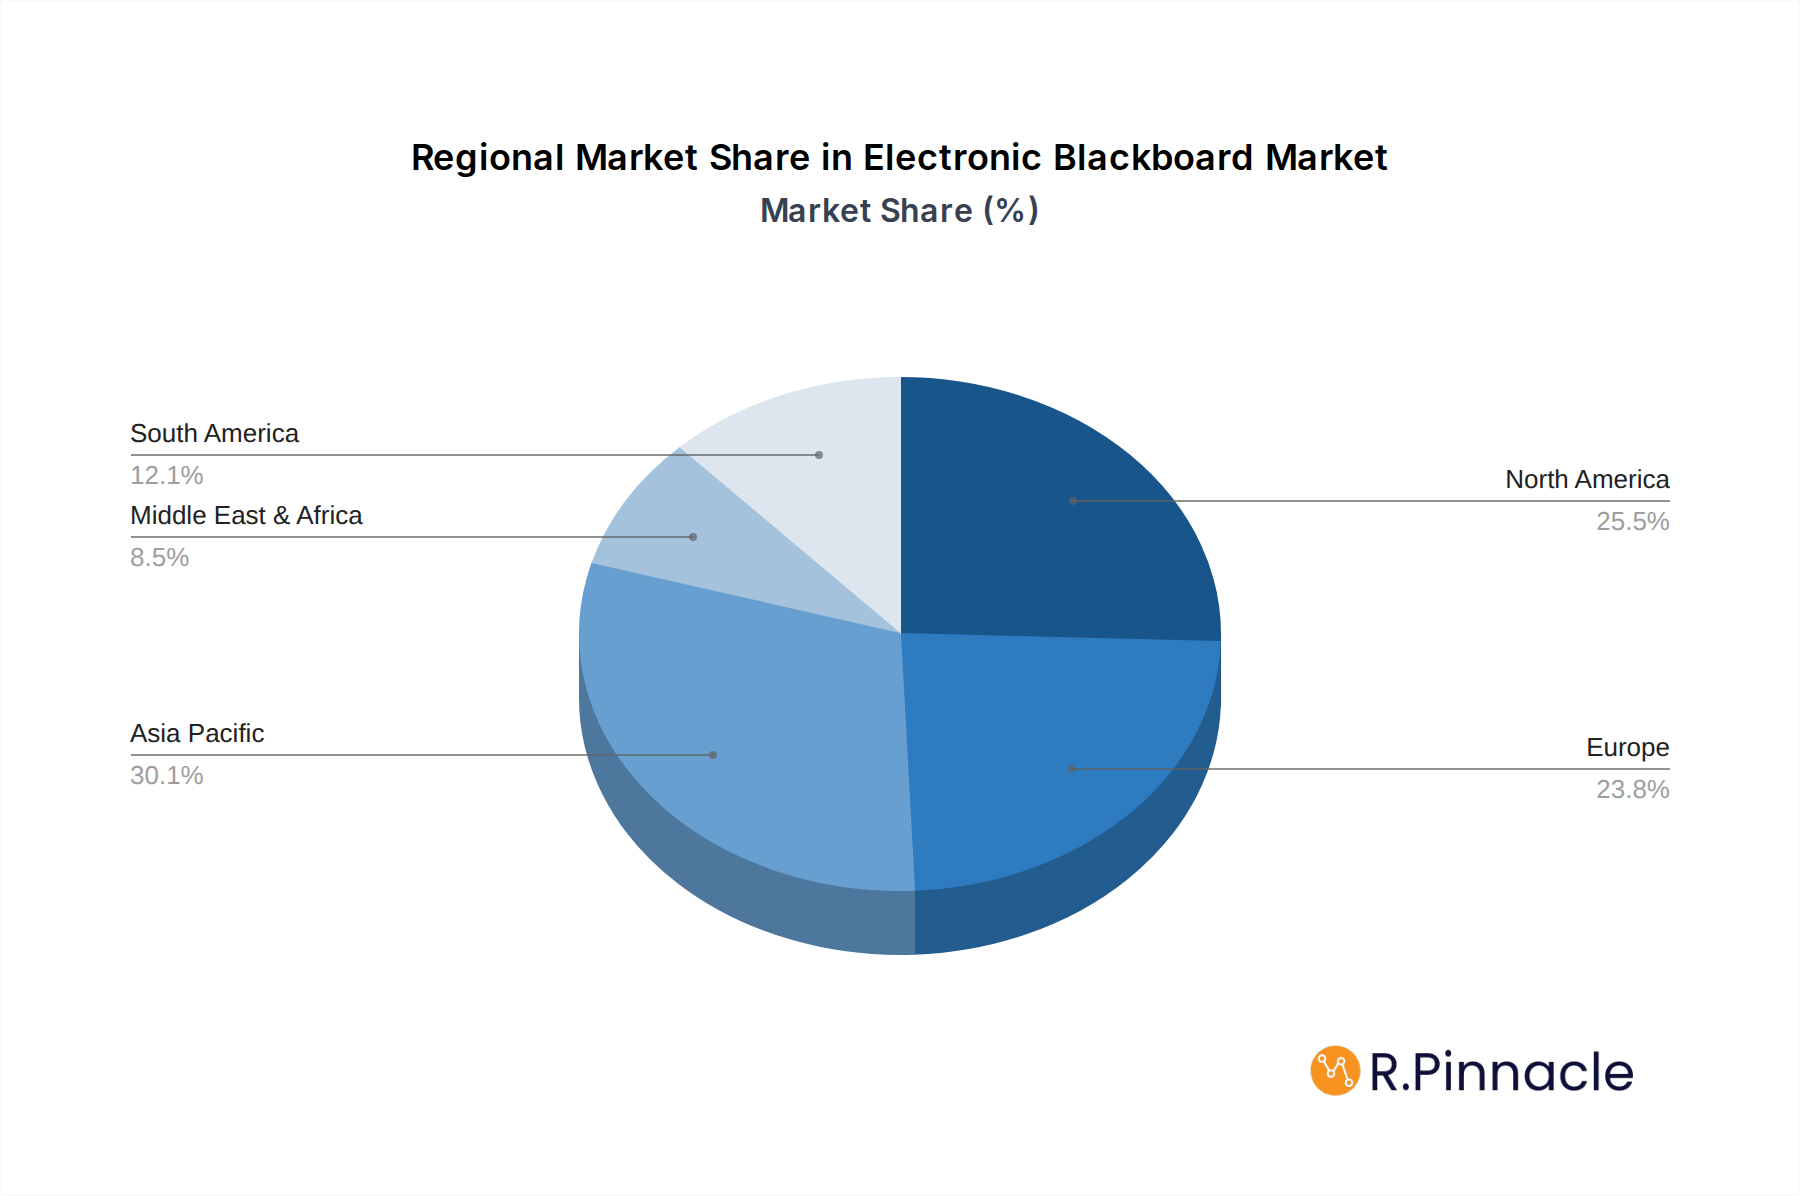
North America, particularly the United States, currently holds dominance in the Electronic Blackboard market, driven by strong government initiatives promoting educational technology adoption and substantial investment from higher education institutions. The region's well-developed digital infrastructure and high disposable income contribute significantly to this leadership. In terms of applications, K-12 Education is the largest and fastest-growing segment, with schools worldwide investing billions in equipping classrooms with interactive learning tools. This is fueled by pedagogical shifts that emphasize student engagement and personalized learning experiences. The 85-inch screen size is emerging as a popular choice for many educational settings and corporate meeting rooms due to its optimal balance of visibility and space utilization, representing a significant market share within the larger product type segmentation. Key drivers for regional dominance include supportive economic policies that encourage technology investment, robust educational infrastructure, and a growing awareness of the benefits of digital learning tools. Countries like China are rapidly gaining ground, propelled by government-led digitalization drives and a massive student population, presenting a significant future growth opportunity.
Electronic Blackboard Product Innovations
Recent product innovations in the Electronic Blackboard market are centered on enhancing user experience and expanding functionality. Advances in ultra-high definition (UHD) displays offer superior visual clarity, while improved touch responsiveness ensures a more natural and intuitive interaction. Integration of AI-powered features, such as speech recognition for note-taking and intelligent content suggestions, is transforming the blackboard into a smart learning assistant. Wireless connectivity and seamless integration with existing educational platforms and video conferencing tools are crucial competitive advantages, enabling effortless content sharing and remote collaboration. The development of energy-efficient designs and robust build quality further addresses market demand for durable and sustainable solutions.
Report Scope & Segmentation Analysis
This report meticulously segments the Electronic Blackboard market across key application and product type categories.
- Application: Home Use: This segment, while smaller than educational applications, is projected to witness significant growth as smart home technology evolves and parents seek interactive learning tools for their children at home. Market size is estimated in the billions.
- K-12 Education: This remains the largest and most dynamic segment, with ongoing investments in smart classrooms driving substantial market expansion. Growth projections are robust, with market sizes in the tens of billions.
- Higher Education: Universities and colleges are increasingly adopting electronic blackboards for lecture halls and collaborative study spaces, contributing to steady market growth and a market size in the billions.
- Others: This category encompasses corporate training, government institutions, and public spaces, all of which present niche but growing opportunities, with market sizes in the billions.
- Types: 85 Inch: This specific screen size is identified as a high-demand category, reflecting a growing preference for versatile display solutions that cater to a wide range of room sizes and user needs. Its market share is substantial, contributing significantly to overall revenue.
Key Drivers of Electronic Blackboard Growth
The growth of the Electronic Blackboard market is primarily propelled by several interconnected factors. The escalating demand for interactive and engaging learning environments, particularly in the K-12 and higher education sectors, is a core driver, with institutions investing billions to modernize their classrooms. Technological advancements, including the integration of AI, enhanced touch sensitivity, and cloud connectivity, are making these devices more functional and appealing. Government initiatives worldwide promoting digital education and smart classroom adoption further bolster market expansion. The increasing adoption of hybrid and remote learning models necessitates sophisticated collaborative tools, positioning electronic blackboards as essential infrastructure.
Challenges in the Electronic Blackboard Sector
Despite its strong growth trajectory, the Electronic Blackboard sector faces several challenges that could impede its full potential. High initial investment costs can be a barrier for some educational institutions and smaller businesses, particularly in developing economies. Supply chain disruptions, as experienced in recent years, can affect production and lead to price volatility. Intense competition among manufacturers leads to price pressures and necessitates continuous innovation to maintain market share. Evolving cybersecurity threats also require robust security measures, adding to development costs. Regulatory hurdles related to data privacy and educational technology standards can also pose challenges in certain markets.
Emerging Opportunities in Electronic Blackboard
The Electronic Blackboard market is rife with emerging opportunities. The burgeoning edtech market globally presents a vast landscape for growth, especially in underserved regions. The integration of advanced AI and machine learning capabilities for personalized learning and adaptive content delivery offers significant potential. The expansion of the "smart office" concept is creating new avenues for electronic blackboards in corporate meeting rooms and collaboration spaces. Furthermore, the development of more affordable and feature-rich models tailored for home education and small businesses can unlock new consumer segments. Cross-platform integration and interoperability with a wider ecosystem of educational software and devices will also be key differentiators.
Leading Players in the Electronic Blackboard Market
- HiSense
- Hitevision
- Seewo (CVTE)
- Jiangsu Daguan
- Jiangsu Oudi
- Createview
- Lighton
- Horion
- Hikvision
- Hanvon
- Odin Technology
- Thinkpanel
- STboard
- Guangzhou Yichuang Electronic Technology Co
- Guangdong Asano Technology Co
Key Developments in Electronic Blackboard Industry
- 2023 Q4: Launch of AI-powered interactive blackboards with advanced speech-to-text transcription capabilities by Hitevision.
- 2023 Q3: Seewo (CVTE) announces strategic partnerships with major educational content providers to enhance software integration.
- 2023 Q2: HiSense expands its electronic blackboard product line with a focus on ultra-thin bezel designs and improved energy efficiency.
- 2023 Q1: Hikvision introduces a new series of electronic blackboards with enhanced cybersecurity features for institutional use.
- 2022 Q4: Horion acquires a startup specializing in interactive whiteboard software, aiming to bolster its ecosystem.
- 2022 Q3: Creation of industry consortiums to standardize interoperability protocols among smart classroom devices, including electronic blackboards.
Future Outlook for Electronic Blackboard Market
The future outlook for the Electronic Blackboard market is exceptionally bright, poised for sustained and accelerated growth. The ongoing digital transformation in education, coupled with the increasing demand for interactive and collaborative learning experiences, will continue to be the primary growth accelerators. The integration of advanced AI and IoT technologies will further elevate the functionality and appeal of these devices, transforming them into intelligent hubs for learning and communication. Strategic opportunities lie in expanding into emerging markets, developing more specialized solutions for different educational levels and professional sectors, and fostering deeper integration with digital learning platforms. The market is expected to witness substantial growth, driven by innovation and an ever-increasing recognition of the indispensable role electronic blackboards play in modern pedagogy and professional collaboration, with market valuations reaching tens of billions in the coming years.
Electronic Blackboard Segmentation
-
1. Application
- 1.1. Home Use
- 1.2. K-12 Education
- 1.3. Higher Education
- 1.4. Others
-
2. Types
- 2.1. < 55 Inch
- 2.2. 56-65 Inch
- 2.3. 66-75 Inch
- 2.4. 76-85 Inch
- 2.5. > 85 Inch
Electronic Blackboard Segmentation By Geography
-
1. North America
- 1.1. United States
- 1.2. Canada
- 1.3. Mexico
-
2. South America
- 2.1. Brazil
- 2.2. Argentina
- 2.3. Rest of South America
-
3. Europe
- 3.1. United Kingdom
- 3.2. Germany
- 3.3. France
- 3.4. Italy
- 3.5. Spain
- 3.6. Russia
- 3.7. Benelux
- 3.8. Nordics
- 3.9. Rest of Europe
-
4. Middle East & Africa
- 4.1. Turkey
- 4.2. Israel
- 4.3. GCC
- 4.4. North Africa
- 4.5. South Africa
- 4.6. Rest of Middle East & Africa
-
5. Asia Pacific
- 5.1. China
- 5.2. India
- 5.3. Japan
- 5.4. South Korea
- 5.5. ASEAN
- 5.6. Oceania
- 5.7. Rest of Asia Pacific
Electronic Blackboard Regional Market Share
Geographic Coverage of Electronic Blackboard
Electronic Blackboard REPORT HIGHLIGHTS
| Aspects | Details |
|---|---|
| Study Period | 2020-2034 |
| Base Year | 2025 |
| Estimated Year | 2026 |
| Forecast Period | 2026-2034 |
| Historical Period | 2020-2025 |
| Growth Rate | CAGR of 6.6% from 2020-2034 |
| Segmentation |
|
Table of Contents
- 1. Introduction
- 1.1. Research Scope
- 1.2. Market Segmentation
- 1.3. Research Methodology
- 1.4. Definitions and Assumptions
- 2. Executive Summary
- 2.1. Introduction
- 3. Market Dynamics
- 3.1. Introduction
- 3.2. Market Drivers
- 3.3. Market Restrains
- 3.4. Market Trends
- 4. Market Factor Analysis
- 4.1. Porters Five Forces
- 4.2. Supply/Value Chain
- 4.3. PESTEL analysis
- 4.4. Market Entropy
- 4.5. Patent/Trademark Analysis
- 5. Global Electronic Blackboard Analysis, Insights and Forecast, 2020-2032
- 5.1. Market Analysis, Insights and Forecast - by Application
- 5.1.1. Home Use
- 5.1.2. K-12 Education
- 5.1.3. Higher Education
- 5.1.4. Others
- 5.2. Market Analysis, Insights and Forecast - by Types
- 5.2.1. < 55 Inch
- 5.2.2. 56-65 Inch
- 5.2.3. 66-75 Inch
- 5.2.4. 76-85 Inch
- 5.2.5. > 85 Inch
- 5.3. Market Analysis, Insights and Forecast - by Region
- 5.3.1. North America
- 5.3.2. South America
- 5.3.3. Europe
- 5.3.4. Middle East & Africa
- 5.3.5. Asia Pacific
- 5.1. Market Analysis, Insights and Forecast - by Application
- 6. North America Electronic Blackboard Analysis, Insights and Forecast, 2020-2032
- 6.1. Market Analysis, Insights and Forecast - by Application
- 6.1.1. Home Use
- 6.1.2. K-12 Education
- 6.1.3. Higher Education
- 6.1.4. Others
- 6.2. Market Analysis, Insights and Forecast - by Types
- 6.2.1. < 55 Inch
- 6.2.2. 56-65 Inch
- 6.2.3. 66-75 Inch
- 6.2.4. 76-85 Inch
- 6.2.5. > 85 Inch
- 6.1. Market Analysis, Insights and Forecast - by Application
- 7. South America Electronic Blackboard Analysis, Insights and Forecast, 2020-2032
- 7.1. Market Analysis, Insights and Forecast - by Application
- 7.1.1. Home Use
- 7.1.2. K-12 Education
- 7.1.3. Higher Education
- 7.1.4. Others
- 7.2. Market Analysis, Insights and Forecast - by Types
- 7.2.1. < 55 Inch
- 7.2.2. 56-65 Inch
- 7.2.3. 66-75 Inch
- 7.2.4. 76-85 Inch
- 7.2.5. > 85 Inch
- 7.1. Market Analysis, Insights and Forecast - by Application
- 8. Europe Electronic Blackboard Analysis, Insights and Forecast, 2020-2032
- 8.1. Market Analysis, Insights and Forecast - by Application
- 8.1.1. Home Use
- 8.1.2. K-12 Education
- 8.1.3. Higher Education
- 8.1.4. Others
- 8.2. Market Analysis, Insights and Forecast - by Types
- 8.2.1. < 55 Inch
- 8.2.2. 56-65 Inch
- 8.2.3. 66-75 Inch
- 8.2.4. 76-85 Inch
- 8.2.5. > 85 Inch
- 8.1. Market Analysis, Insights and Forecast - by Application
- 9. Middle East & Africa Electronic Blackboard Analysis, Insights and Forecast, 2020-2032
- 9.1. Market Analysis, Insights and Forecast - by Application
- 9.1.1. Home Use
- 9.1.2. K-12 Education
- 9.1.3. Higher Education
- 9.1.4. Others
- 9.2. Market Analysis, Insights and Forecast - by Types
- 9.2.1. < 55 Inch
- 9.2.2. 56-65 Inch
- 9.2.3. 66-75 Inch
- 9.2.4. 76-85 Inch
- 9.2.5. > 85 Inch
- 9.1. Market Analysis, Insights and Forecast - by Application
- 10. Asia Pacific Electronic Blackboard Analysis, Insights and Forecast, 2020-2032
- 10.1. Market Analysis, Insights and Forecast - by Application
- 10.1.1. Home Use
- 10.1.2. K-12 Education
- 10.1.3. Higher Education
- 10.1.4. Others
- 10.2. Market Analysis, Insights and Forecast - by Types
- 10.2.1. < 55 Inch
- 10.2.2. 56-65 Inch
- 10.2.3. 66-75 Inch
- 10.2.4. 76-85 Inch
- 10.2.5. > 85 Inch
- 10.1. Market Analysis, Insights and Forecast - by Application
- 11. Competitive Analysis
- 11.1. Global Market Share Analysis 2025
- 11.2. Company Profiles
- 11.2.1 HiSense
- 11.2.1.1. Overview
- 11.2.1.2. Products
- 11.2.1.3. SWOT Analysis
- 11.2.1.4. Recent Developments
- 11.2.1.5. Financials (Based on Availability)
- 11.2.2 Hitevision
- 11.2.2.1. Overview
- 11.2.2.2. Products
- 11.2.2.3. SWOT Analysis
- 11.2.2.4. Recent Developments
- 11.2.2.5. Financials (Based on Availability)
- 11.2.3 Seewo(CVTE)
- 11.2.3.1. Overview
- 11.2.3.2. Products
- 11.2.3.3. SWOT Analysis
- 11.2.3.4. Recent Developments
- 11.2.3.5. Financials (Based on Availability)
- 11.2.4 Jiangsu Daguan
- 11.2.4.1. Overview
- 11.2.4.2. Products
- 11.2.4.3. SWOT Analysis
- 11.2.4.4. Recent Developments
- 11.2.4.5. Financials (Based on Availability)
- 11.2.5 Jiangsu Oudi
- 11.2.5.1. Overview
- 11.2.5.2. Products
- 11.2.5.3. SWOT Analysis
- 11.2.5.4. Recent Developments
- 11.2.5.5. Financials (Based on Availability)
- 11.2.6 Createview
- 11.2.6.1. Overview
- 11.2.6.2. Products
- 11.2.6.3. SWOT Analysis
- 11.2.6.4. Recent Developments
- 11.2.6.5. Financials (Based on Availability)
- 11.2.7 Lighton
- 11.2.7.1. Overview
- 11.2.7.2. Products
- 11.2.7.3. SWOT Analysis
- 11.2.7.4. Recent Developments
- 11.2.7.5. Financials (Based on Availability)
- 11.2.8 Horion
- 11.2.8.1. Overview
- 11.2.8.2. Products
- 11.2.8.3. SWOT Analysis
- 11.2.8.4. Recent Developments
- 11.2.8.5. Financials (Based on Availability)
- 11.2.9 Hikvision
- 11.2.9.1. Overview
- 11.2.9.2. Products
- 11.2.9.3. SWOT Analysis
- 11.2.9.4. Recent Developments
- 11.2.9.5. Financials (Based on Availability)
- 11.2.10 Hanvon
- 11.2.10.1. Overview
- 11.2.10.2. Products
- 11.2.10.3. SWOT Analysis
- 11.2.10.4. Recent Developments
- 11.2.10.5. Financials (Based on Availability)
- 11.2.11 Odin Technology
- 11.2.11.1. Overview
- 11.2.11.2. Products
- 11.2.11.3. SWOT Analysis
- 11.2.11.4. Recent Developments
- 11.2.11.5. Financials (Based on Availability)
- 11.2.12 Thinkpanel
- 11.2.12.1. Overview
- 11.2.12.2. Products
- 11.2.12.3. SWOT Analysis
- 11.2.12.4. Recent Developments
- 11.2.12.5. Financials (Based on Availability)
- 11.2.13 STboard
- 11.2.13.1. Overview
- 11.2.13.2. Products
- 11.2.13.3. SWOT Analysis
- 11.2.13.4. Recent Developments
- 11.2.13.5. Financials (Based on Availability)
- 11.2.14 Guangzhou Yichuang Electronic Technology Co
- 11.2.14.1. Overview
- 11.2.14.2. Products
- 11.2.14.3. SWOT Analysis
- 11.2.14.4. Recent Developments
- 11.2.14.5. Financials (Based on Availability)
- 11.2.15 Guangdong Asano Technology Co
- 11.2.15.1. Overview
- 11.2.15.2. Products
- 11.2.15.3. SWOT Analysis
- 11.2.15.4. Recent Developments
- 11.2.15.5. Financials (Based on Availability)
- 11.2.1 HiSense
List of Figures
- Figure 1: Global Electronic Blackboard Revenue Breakdown (billion, %) by Region 2025 & 2033
- Figure 2: Global Electronic Blackboard Volume Breakdown (K, %) by Region 2025 & 2033
- Figure 3: North America Electronic Blackboard Revenue (billion), by Application 2025 & 2033
- Figure 4: North America Electronic Blackboard Volume (K), by Application 2025 & 2033
- Figure 5: North America Electronic Blackboard Revenue Share (%), by Application 2025 & 2033
- Figure 6: North America Electronic Blackboard Volume Share (%), by Application 2025 & 2033
- Figure 7: North America Electronic Blackboard Revenue (billion), by Types 2025 & 2033
- Figure 8: North America Electronic Blackboard Volume (K), by Types 2025 & 2033
- Figure 9: North America Electronic Blackboard Revenue Share (%), by Types 2025 & 2033
- Figure 10: North America Electronic Blackboard Volume Share (%), by Types 2025 & 2033
- Figure 11: North America Electronic Blackboard Revenue (billion), by Country 2025 & 2033
- Figure 12: North America Electronic Blackboard Volume (K), by Country 2025 & 2033
- Figure 13: North America Electronic Blackboard Revenue Share (%), by Country 2025 & 2033
- Figure 14: North America Electronic Blackboard Volume Share (%), by Country 2025 & 2033
- Figure 15: South America Electronic Blackboard Revenue (billion), by Application 2025 & 2033
- Figure 16: South America Electronic Blackboard Volume (K), by Application 2025 & 2033
- Figure 17: South America Electronic Blackboard Revenue Share (%), by Application 2025 & 2033
- Figure 18: South America Electronic Blackboard Volume Share (%), by Application 2025 & 2033
- Figure 19: South America Electronic Blackboard Revenue (billion), by Types 2025 & 2033
- Figure 20: South America Electronic Blackboard Volume (K), by Types 2025 & 2033
- Figure 21: South America Electronic Blackboard Revenue Share (%), by Types 2025 & 2033
- Figure 22: South America Electronic Blackboard Volume Share (%), by Types 2025 & 2033
- Figure 23: South America Electronic Blackboard Revenue (billion), by Country 2025 & 2033
- Figure 24: South America Electronic Blackboard Volume (K), by Country 2025 & 2033
- Figure 25: South America Electronic Blackboard Revenue Share (%), by Country 2025 & 2033
- Figure 26: South America Electronic Blackboard Volume Share (%), by Country 2025 & 2033
- Figure 27: Europe Electronic Blackboard Revenue (billion), by Application 2025 & 2033
- Figure 28: Europe Electronic Blackboard Volume (K), by Application 2025 & 2033
- Figure 29: Europe Electronic Blackboard Revenue Share (%), by Application 2025 & 2033
- Figure 30: Europe Electronic Blackboard Volume Share (%), by Application 2025 & 2033
- Figure 31: Europe Electronic Blackboard Revenue (billion), by Types 2025 & 2033
- Figure 32: Europe Electronic Blackboard Volume (K), by Types 2025 & 2033
- Figure 33: Europe Electronic Blackboard Revenue Share (%), by Types 2025 & 2033
- Figure 34: Europe Electronic Blackboard Volume Share (%), by Types 2025 & 2033
- Figure 35: Europe Electronic Blackboard Revenue (billion), by Country 2025 & 2033
- Figure 36: Europe Electronic Blackboard Volume (K), by Country 2025 & 2033
- Figure 37: Europe Electronic Blackboard Revenue Share (%), by Country 2025 & 2033
- Figure 38: Europe Electronic Blackboard Volume Share (%), by Country 2025 & 2033
- Figure 39: Middle East & Africa Electronic Blackboard Revenue (billion), by Application 2025 & 2033
- Figure 40: Middle East & Africa Electronic Blackboard Volume (K), by Application 2025 & 2033
- Figure 41: Middle East & Africa Electronic Blackboard Revenue Share (%), by Application 2025 & 2033
- Figure 42: Middle East & Africa Electronic Blackboard Volume Share (%), by Application 2025 & 2033
- Figure 43: Middle East & Africa Electronic Blackboard Revenue (billion), by Types 2025 & 2033
- Figure 44: Middle East & Africa Electronic Blackboard Volume (K), by Types 2025 & 2033
- Figure 45: Middle East & Africa Electronic Blackboard Revenue Share (%), by Types 2025 & 2033
- Figure 46: Middle East & Africa Electronic Blackboard Volume Share (%), by Types 2025 & 2033
- Figure 47: Middle East & Africa Electronic Blackboard Revenue (billion), by Country 2025 & 2033
- Figure 48: Middle East & Africa Electronic Blackboard Volume (K), by Country 2025 & 2033
- Figure 49: Middle East & Africa Electronic Blackboard Revenue Share (%), by Country 2025 & 2033
- Figure 50: Middle East & Africa Electronic Blackboard Volume Share (%), by Country 2025 & 2033
- Figure 51: Asia Pacific Electronic Blackboard Revenue (billion), by Application 2025 & 2033
- Figure 52: Asia Pacific Electronic Blackboard Volume (K), by Application 2025 & 2033
- Figure 53: Asia Pacific Electronic Blackboard Revenue Share (%), by Application 2025 & 2033
- Figure 54: Asia Pacific Electronic Blackboard Volume Share (%), by Application 2025 & 2033
- Figure 55: Asia Pacific Electronic Blackboard Revenue (billion), by Types 2025 & 2033
- Figure 56: Asia Pacific Electronic Blackboard Volume (K), by Types 2025 & 2033
- Figure 57: Asia Pacific Electronic Blackboard Revenue Share (%), by Types 2025 & 2033
- Figure 58: Asia Pacific Electronic Blackboard Volume Share (%), by Types 2025 & 2033
- Figure 59: Asia Pacific Electronic Blackboard Revenue (billion), by Country 2025 & 2033
- Figure 60: Asia Pacific Electronic Blackboard Volume (K), by Country 2025 & 2033
- Figure 61: Asia Pacific Electronic Blackboard Revenue Share (%), by Country 2025 & 2033
- Figure 62: Asia Pacific Electronic Blackboard Volume Share (%), by Country 2025 & 2033
List of Tables
- Table 1: Global Electronic Blackboard Revenue billion Forecast, by Application 2020 & 2033
- Table 2: Global Electronic Blackboard Volume K Forecast, by Application 2020 & 2033
- Table 3: Global Electronic Blackboard Revenue billion Forecast, by Types 2020 & 2033
- Table 4: Global Electronic Blackboard Volume K Forecast, by Types 2020 & 2033
- Table 5: Global Electronic Blackboard Revenue billion Forecast, by Region 2020 & 2033
- Table 6: Global Electronic Blackboard Volume K Forecast, by Region 2020 & 2033
- Table 7: Global Electronic Blackboard Revenue billion Forecast, by Application 2020 & 2033
- Table 8: Global Electronic Blackboard Volume K Forecast, by Application 2020 & 2033
- Table 9: Global Electronic Blackboard Revenue billion Forecast, by Types 2020 & 2033
- Table 10: Global Electronic Blackboard Volume K Forecast, by Types 2020 & 2033
- Table 11: Global Electronic Blackboard Revenue billion Forecast, by Country 2020 & 2033
- Table 12: Global Electronic Blackboard Volume K Forecast, by Country 2020 & 2033
- Table 13: United States Electronic Blackboard Revenue (billion) Forecast, by Application 2020 & 2033
- Table 14: United States Electronic Blackboard Volume (K) Forecast, by Application 2020 & 2033
- Table 15: Canada Electronic Blackboard Revenue (billion) Forecast, by Application 2020 & 2033
- Table 16: Canada Electronic Blackboard Volume (K) Forecast, by Application 2020 & 2033
- Table 17: Mexico Electronic Blackboard Revenue (billion) Forecast, by Application 2020 & 2033
- Table 18: Mexico Electronic Blackboard Volume (K) Forecast, by Application 2020 & 2033
- Table 19: Global Electronic Blackboard Revenue billion Forecast, by Application 2020 & 2033
- Table 20: Global Electronic Blackboard Volume K Forecast, by Application 2020 & 2033
- Table 21: Global Electronic Blackboard Revenue billion Forecast, by Types 2020 & 2033
- Table 22: Global Electronic Blackboard Volume K Forecast, by Types 2020 & 2033
- Table 23: Global Electronic Blackboard Revenue billion Forecast, by Country 2020 & 2033
- Table 24: Global Electronic Blackboard Volume K Forecast, by Country 2020 & 2033
- Table 25: Brazil Electronic Blackboard Revenue (billion) Forecast, by Application 2020 & 2033
- Table 26: Brazil Electronic Blackboard Volume (K) Forecast, by Application 2020 & 2033
- Table 27: Argentina Electronic Blackboard Revenue (billion) Forecast, by Application 2020 & 2033
- Table 28: Argentina Electronic Blackboard Volume (K) Forecast, by Application 2020 & 2033
- Table 29: Rest of South America Electronic Blackboard Revenue (billion) Forecast, by Application 2020 & 2033
- Table 30: Rest of South America Electronic Blackboard Volume (K) Forecast, by Application 2020 & 2033
- Table 31: Global Electronic Blackboard Revenue billion Forecast, by Application 2020 & 2033
- Table 32: Global Electronic Blackboard Volume K Forecast, by Application 2020 & 2033
- Table 33: Global Electronic Blackboard Revenue billion Forecast, by Types 2020 & 2033
- Table 34: Global Electronic Blackboard Volume K Forecast, by Types 2020 & 2033
- Table 35: Global Electronic Blackboard Revenue billion Forecast, by Country 2020 & 2033
- Table 36: Global Electronic Blackboard Volume K Forecast, by Country 2020 & 2033
- Table 37: United Kingdom Electronic Blackboard Revenue (billion) Forecast, by Application 2020 & 2033
- Table 38: United Kingdom Electronic Blackboard Volume (K) Forecast, by Application 2020 & 2033
- Table 39: Germany Electronic Blackboard Revenue (billion) Forecast, by Application 2020 & 2033
- Table 40: Germany Electronic Blackboard Volume (K) Forecast, by Application 2020 & 2033
- Table 41: France Electronic Blackboard Revenue (billion) Forecast, by Application 2020 & 2033
- Table 42: France Electronic Blackboard Volume (K) Forecast, by Application 2020 & 2033
- Table 43: Italy Electronic Blackboard Revenue (billion) Forecast, by Application 2020 & 2033
- Table 44: Italy Electronic Blackboard Volume (K) Forecast, by Application 2020 & 2033
- Table 45: Spain Electronic Blackboard Revenue (billion) Forecast, by Application 2020 & 2033
- Table 46: Spain Electronic Blackboard Volume (K) Forecast, by Application 2020 & 2033
- Table 47: Russia Electronic Blackboard Revenue (billion) Forecast, by Application 2020 & 2033
- Table 48: Russia Electronic Blackboard Volume (K) Forecast, by Application 2020 & 2033
- Table 49: Benelux Electronic Blackboard Revenue (billion) Forecast, by Application 2020 & 2033
- Table 50: Benelux Electronic Blackboard Volume (K) Forecast, by Application 2020 & 2033
- Table 51: Nordics Electronic Blackboard Revenue (billion) Forecast, by Application 2020 & 2033
- Table 52: Nordics Electronic Blackboard Volume (K) Forecast, by Application 2020 & 2033
- Table 53: Rest of Europe Electronic Blackboard Revenue (billion) Forecast, by Application 2020 & 2033
- Table 54: Rest of Europe Electronic Blackboard Volume (K) Forecast, by Application 2020 & 2033
- Table 55: Global Electronic Blackboard Revenue billion Forecast, by Application 2020 & 2033
- Table 56: Global Electronic Blackboard Volume K Forecast, by Application 2020 & 2033
- Table 57: Global Electronic Blackboard Revenue billion Forecast, by Types 2020 & 2033
- Table 58: Global Electronic Blackboard Volume K Forecast, by Types 2020 & 2033
- Table 59: Global Electronic Blackboard Revenue billion Forecast, by Country 2020 & 2033
- Table 60: Global Electronic Blackboard Volume K Forecast, by Country 2020 & 2033
- Table 61: Turkey Electronic Blackboard Revenue (billion) Forecast, by Application 2020 & 2033
- Table 62: Turkey Electronic Blackboard Volume (K) Forecast, by Application 2020 & 2033
- Table 63: Israel Electronic Blackboard Revenue (billion) Forecast, by Application 2020 & 2033
- Table 64: Israel Electronic Blackboard Volume (K) Forecast, by Application 2020 & 2033
- Table 65: GCC Electronic Blackboard Revenue (billion) Forecast, by Application 2020 & 2033
- Table 66: GCC Electronic Blackboard Volume (K) Forecast, by Application 2020 & 2033
- Table 67: North Africa Electronic Blackboard Revenue (billion) Forecast, by Application 2020 & 2033
- Table 68: North Africa Electronic Blackboard Volume (K) Forecast, by Application 2020 & 2033
- Table 69: South Africa Electronic Blackboard Revenue (billion) Forecast, by Application 2020 & 2033
- Table 70: South Africa Electronic Blackboard Volume (K) Forecast, by Application 2020 & 2033
- Table 71: Rest of Middle East & Africa Electronic Blackboard Revenue (billion) Forecast, by Application 2020 & 2033
- Table 72: Rest of Middle East & Africa Electronic Blackboard Volume (K) Forecast, by Application 2020 & 2033
- Table 73: Global Electronic Blackboard Revenue billion Forecast, by Application 2020 & 2033
- Table 74: Global Electronic Blackboard Volume K Forecast, by Application 2020 & 2033
- Table 75: Global Electronic Blackboard Revenue billion Forecast, by Types 2020 & 2033
- Table 76: Global Electronic Blackboard Volume K Forecast, by Types 2020 & 2033
- Table 77: Global Electronic Blackboard Revenue billion Forecast, by Country 2020 & 2033
- Table 78: Global Electronic Blackboard Volume K Forecast, by Country 2020 & 2033
- Table 79: China Electronic Blackboard Revenue (billion) Forecast, by Application 2020 & 2033
- Table 80: China Electronic Blackboard Volume (K) Forecast, by Application 2020 & 2033
- Table 81: India Electronic Blackboard Revenue (billion) Forecast, by Application 2020 & 2033
- Table 82: India Electronic Blackboard Volume (K) Forecast, by Application 2020 & 2033
- Table 83: Japan Electronic Blackboard Revenue (billion) Forecast, by Application 2020 & 2033
- Table 84: Japan Electronic Blackboard Volume (K) Forecast, by Application 2020 & 2033
- Table 85: South Korea Electronic Blackboard Revenue (billion) Forecast, by Application 2020 & 2033
- Table 86: South Korea Electronic Blackboard Volume (K) Forecast, by Application 2020 & 2033
- Table 87: ASEAN Electronic Blackboard Revenue (billion) Forecast, by Application 2020 & 2033
- Table 88: ASEAN Electronic Blackboard Volume (K) Forecast, by Application 2020 & 2033
- Table 89: Oceania Electronic Blackboard Revenue (billion) Forecast, by Application 2020 & 2033
- Table 90: Oceania Electronic Blackboard Volume (K) Forecast, by Application 2020 & 2033
- Table 91: Rest of Asia Pacific Electronic Blackboard Revenue (billion) Forecast, by Application 2020 & 2033
- Table 92: Rest of Asia Pacific Electronic Blackboard Volume (K) Forecast, by Application 2020 & 2033
Frequently Asked Questions
1. What is the projected Compound Annual Growth Rate (CAGR) of the Electronic Blackboard?
The projected CAGR is approximately 6.6%.
2. Which companies are prominent players in the Electronic Blackboard?
Key companies in the market include HiSense, Hitevision, Seewo(CVTE), Jiangsu Daguan, Jiangsu Oudi, Createview, Lighton, Horion, Hikvision, Hanvon, Odin Technology, Thinkpanel, STboard, Guangzhou Yichuang Electronic Technology Co, Guangdong Asano Technology Co.
3. What are the main segments of the Electronic Blackboard?
The market segments include Application, Types.
4. Can you provide details about the market size?
The market size is estimated to be USD 1.22 billion as of 2022.
5. What are some drivers contributing to market growth?
N/A
6. What are the notable trends driving market growth?
N/A
7. Are there any restraints impacting market growth?
N/A
8. Can you provide examples of recent developments in the market?
N/A
9. What pricing options are available for accessing the report?
Pricing options include single-user, multi-user, and enterprise licenses priced at USD 3350.00, USD 5025.00, and USD 6700.00 respectively.
10. Is the market size provided in terms of value or volume?
The market size is provided in terms of value, measured in billion and volume, measured in K.
11. Are there any specific market keywords associated with the report?
Yes, the market keyword associated with the report is "Electronic Blackboard," which aids in identifying and referencing the specific market segment covered.
12. How do I determine which pricing option suits my needs best?
The pricing options vary based on user requirements and access needs. Individual users may opt for single-user licenses, while businesses requiring broader access may choose multi-user or enterprise licenses for cost-effective access to the report.
13. Are there any additional resources or data provided in the Electronic Blackboard report?
While the report offers comprehensive insights, it's advisable to review the specific contents or supplementary materials provided to ascertain if additional resources or data are available.
14. How can I stay updated on further developments or reports in the Electronic Blackboard?
To stay informed about further developments, trends, and reports in the Electronic Blackboard, consider subscribing to industry newsletters, following relevant companies and organizations, or regularly checking reputable industry news sources and publications.
Methodology
Step 1 - Identification of Relevant Samples Size from Population Database


Step 2 - Approaches for Defining Global Market Size (Value, Volume* & Price*)

Note*: In applicable scenarios
Step 3 - Data Sources
Primary Research
- Web Analytics
- Survey Reports
- Research Institute
- Latest Research Reports
- Opinion Leaders
Secondary Research
- Annual Reports
- White Paper
- Latest Press Release
- Industry Association
- Paid Database
- Investor Presentations

Step 4 - Data Triangulation
Involves using different sources of information in order to increase the validity of a study
These sources are likely to be stakeholders in a program - participants, other researchers, program staff, other community members, and so on.
Then we put all data in single framework & apply various statistical tools to find out the dynamic on the market.
During the analysis stage, feedback from the stakeholder groups would be compared to determine areas of agreement as well as areas of divergence