

Key Insights
The global Electronic Tourniquet System market is poised for substantial growth, projected to reach USD 11.43 billion by 2025, with a robust Compound Annual Growth Rate (CAGR) of 12.4% during the forecast period of 2025-2033. This significant expansion is fueled by increasing healthcare expenditures worldwide, a rising prevalence of surgical procedures, and the growing adoption of advanced medical devices in both hospital and clinical settings. The demand for sophisticated and reliable hemostasis control is paramount in modern surgical environments, driving innovation and market penetration for electronic tourniquet systems. Furthermore, the expanding applications in home healthcare settings, particularly for post-operative recovery and management of chronic conditions requiring limb compression, are contributing to the market's upward trajectory. Key drivers include the inherent advantages of electronic systems over traditional methods, such as precise pressure control, reduced risk of nerve damage, and enhanced patient comfort, all of which are critical in optimizing surgical outcomes and patient safety.
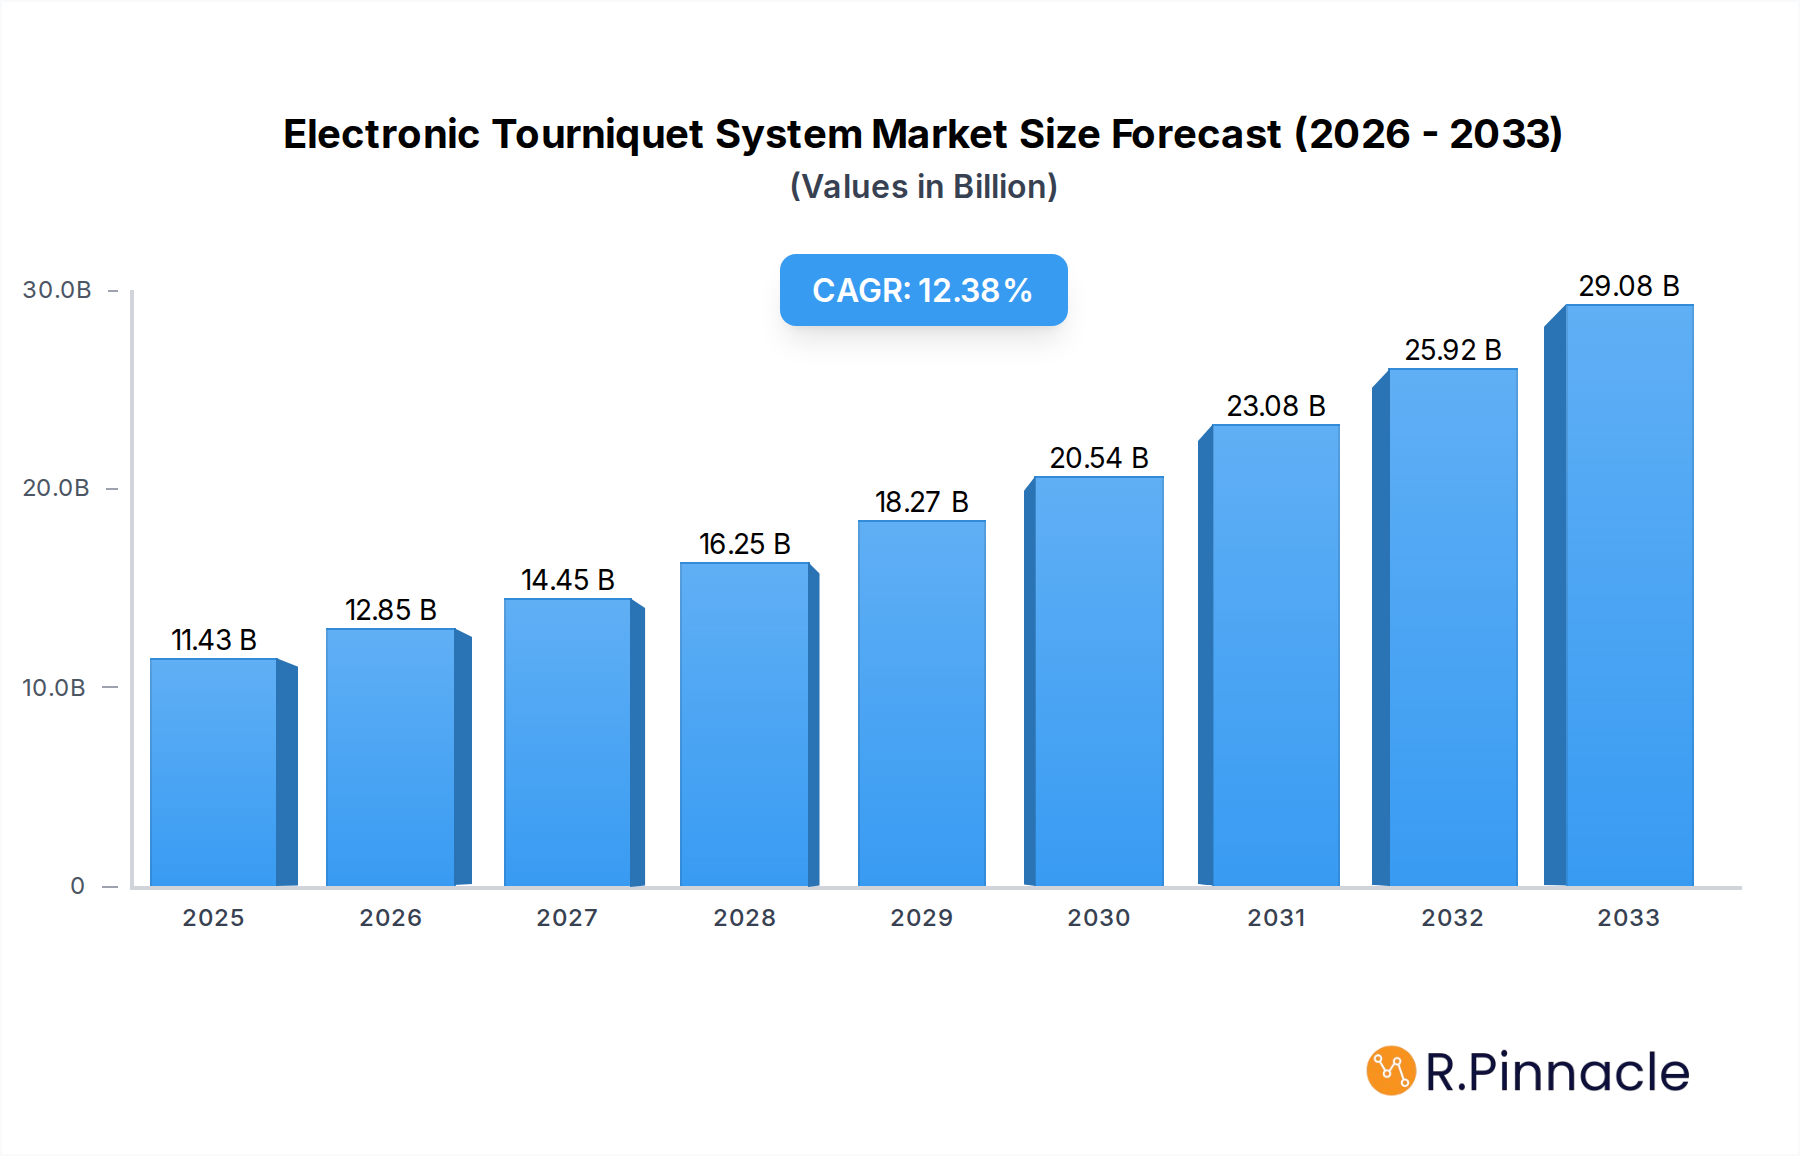
Electronic Tourniquet System Market Size (In Billion)
The market is characterized by a competitive landscape featuring prominent players like Zimmer Biomet, Delfi Medical, and Stryker, who are actively engaged in research and development to introduce technologically advanced solutions. The market segmentation by application highlights a strong reliance on hospital settings, followed by clinics and the burgeoning homecare segment, reflecting a broader trend towards decentralized healthcare delivery. The "Dual Channel" segment is expected to witness higher growth due to its ability to provide sequential cuff inflation and deflation, offering enhanced control and patient comfort during prolonged procedures. Geographically, North America and Europe currently dominate the market, driven by advanced healthcare infrastructure and high patient awareness. However, the Asia Pacific region, particularly China and India, is anticipated to exhibit the fastest growth due to increasing medical tourism, improving healthcare access, and a rapidly expanding patient base undergoing surgical interventions. Restrains such as the initial high cost of these advanced systems and the need for specialized training for healthcare professionals are being addressed through continuous product innovation and market education initiatives.

Electronic Tourniquet System Company Market Share
This in-depth report provides a definitive analysis of the global Electronic Tourniquet System market, covering the historical period from 2019–2024, a base year of 2025, and a forecast period extending to 2033. Leveraging advanced analytical methodologies, this report offers actionable insights for industry stakeholders, including manufacturers, suppliers, investors, and healthcare professionals. With an estimated market value projected to reach billions in the forecast period, this study delves into market structure, dynamics, regional dominance, product innovations, and future growth trajectories, identifying key drivers, challenges, and emerging opportunities within this vital medical device sector.
Electronic Tourniquet System Market Structure & Innovation Trends
The Electronic Tourniquet System market exhibits a moderately consolidated structure, with a few key players holding significant market share. Innovation is primarily driven by advancements in battery technology, user interface design, and enhanced safety features to minimize nerve damage. Regulatory frameworks, such as FDA approvals and CE marking, are crucial for market entry and product validation. The presence of product substitutes, like traditional pneumatic tourniquets, necessitates continuous innovation to maintain competitive advantage. End-user demographics are increasingly focused on perioperative care providers, including hospitals and specialized surgical clinics. Mergers and acquisitions (M&A) activities, with estimated deal values in the hundreds of millions, indicate a trend towards consolidation and expansion of product portfolios. Market share analysis reveals Zimmer Biomet and Stryker as leading entities.
- Market Concentration: Moderately consolidated with leading players.
- Innovation Drivers: Improved safety, portability, and data logging capabilities.
- Regulatory Landscape: Stringent approvals required from global health authorities.
- Product Substitutes: Traditional pneumatic systems and manual methods.
- End-User Focus: Hospitals, clinics, and emergency medical services.
- M&A Activity: Strategic acquisitions for market expansion and technology integration.
Electronic Tourniquet System Market Dynamics & Trends
The Electronic Tourniquet System market is experiencing robust growth, fueled by an increasing global demand for minimally invasive surgical procedures and a rising incidence of trauma cases requiring rapid hemorrhage control. Technological disruptions, such as the integration of wireless connectivity for data management and remote monitoring, are transforming the landscape. Consumer preferences are shifting towards devices offering enhanced patient safety, ease of use, and precise pressure control to mitigate the risk of complications like nerve damage and tissue ischemia. Competitive dynamics are characterized by intense product development, strategic partnerships, and aggressive marketing strategies among established players and emerging entrants. The market penetration is steadily increasing in developed economies, with significant growth potential in emerging markets due to improving healthcare infrastructure and increasing patient awareness. The Compound Annual Growth Rate (CAGR) is estimated to be in the range of xx% for the forecast period, driven by these evolving dynamics. The market is also influenced by the growing adoption of advanced surgical techniques and the emphasis on patient outcome improvement.
- Market Growth Drivers: Increasing surgical procedures, trauma care needs, and technological advancements.
- Technological Disruptions: IoT integration, AI-powered pressure management, and advanced battery solutions.
- Consumer Preferences: Emphasis on patient safety, ease of operation, and data-driven insights.
- Competitive Landscape: Innovation-driven competition, strategic alliances, and market entry of new players.
- Market Penetration: Expanding adoption in both developed and developing healthcare systems.
Dominant Regions & Segments in Electronic Tourniquet System
North America currently dominates the Electronic Tourniquet System market, driven by a well-established healthcare infrastructure, high per capita healthcare spending, and the early adoption of advanced medical technologies. The United States, in particular, is a key contributor due to its extensive network of hospitals and clinics performing a high volume of surgical procedures. Asia Pacific is emerging as a significant growth region, propelled by increasing healthcare investments, a burgeoning patient population, and a growing awareness of advanced medical devices. Within the Application segment, Hospitals represent the largest share, owing to their critical role in surgical interventions and trauma management. The Clinic segment is also witnessing steady growth, particularly in specialized surgical centers. In terms of Types, Dual Channel electronic tourniquet systems are gaining traction due to their ability to provide independent control and monitoring of both limbs, enhancing surgical flexibility and safety.
- Leading Region: North America, with the United States as a primary market.
- Emerging Region: Asia Pacific, driven by growing healthcare expenditures and infrastructure development.
- Dominant Application: Hospitals, due to high surgical volumes and trauma care.
- Growth Application: Clinics, especially specialized surgical centers.
- Dominant Type: Dual Channel systems, offering advanced control and safety features.
- Key Drivers of Regional Dominance: Healthcare expenditure, technological adoption rates, and regulatory support.
Electronic Tourniquet System Product Innovations
Recent product innovations in the Electronic Tourniquet System market focus on enhancing user experience, safety, and connectivity. Manufacturers are introducing lightweight, portable devices with intuitive interfaces and longer battery life. Advanced algorithms for precise pressure regulation and real-time monitoring are becoming standard, minimizing the risk of complications. The integration of data logging capabilities allows for better post-operative analysis and compliance tracking. These advancements offer significant competitive advantages by meeting the evolving demands for efficient and safe surgical practices.
Report Scope & Segmentation Analysis
This report comprehensively segments the Electronic Tourniquet System market across key parameters. The Application segment includes Hospitals, Clinics, and Homecare settings. The Type segment is divided into Single Channel and Dual Channel systems. Each segment is analyzed for its current market size, projected growth rates, and competitive landscape.
- Hospital Application: Expected to maintain the largest market share due to consistent demand for surgical procedures.
- Clinic Application: Shows promising growth, driven by the expansion of outpatient surgical centers.
- Home Application: A nascent but growing segment, particularly for post-operative rehabilitation.
- Single Channel Type: Remains a cost-effective option for specific procedures.
- Dual Channel Type: Forecasted to exhibit higher growth due to its advanced features and versatility.
Key Drivers of Electronic Tourniquet System Growth
The Electronic Tourniquet System market is propelled by several key drivers. The increasing global prevalence of surgical procedures, including orthopedic, cardiovascular, and general surgeries, directly fuels demand. Advancements in medical technology, leading to more sophisticated and user-friendly devices, also play a crucial role. Furthermore, a growing emphasis on patient safety and the reduction of surgical complications, such as nerve damage and reperfusion injuries, are driving the adoption of advanced tourniquet systems. The rising incidence of trauma cases, necessitating efficient and rapid hemorrhage control, further contributes to market expansion.
- Increasing Surgical Volume: A fundamental driver across various medical specialties.
- Technological Advancements: Innovations enhancing precision, safety, and ease of use.
- Patient Safety Focus: Minimizing tourniquet-related complications.
- Trauma Care Demand: Critical need for rapid bleeding control in emergency situations.
Challenges in the Electronic Tourniquet System Sector
Despite strong growth prospects, the Electronic Tourniquet System sector faces several challenges. High initial costs of advanced electronic systems can be a barrier to adoption, especially in resource-limited settings. Stringent regulatory approval processes in different countries can prolong time-to-market and increase development expenses. The availability of cheaper, traditional pneumatic tourniquets poses a competitive challenge. Furthermore, ensuring consistent product quality and reliability across a global supply chain can be complex, and potential cybersecurity risks associated with connected devices require careful management.
- High Initial Cost: A significant factor for budget-conscious healthcare facilities.
- Regulatory Hurdles: Complex and time-consuming approval pathways.
- Competition from Traditional Devices: Price sensitivity can favor older technologies.
- Supply Chain Complexity: Maintaining quality and availability globally.
Emerging Opportunities in Electronic Tourniquet System
The Electronic Tourniquet System market is ripe with emerging opportunities. The expansion of healthcare infrastructure in developing economies presents a substantial untapped market. The development of more compact, battery-efficient, and portable devices catering to remote or battlefield applications is a significant trend. Integration with advanced diagnostic and monitoring systems, potentially leveraging AI for predictive analytics, offers a pathway for future innovation. Furthermore, the growing demand for home healthcare solutions could open new avenues for minimally invasive patient care.
- Emerging Markets: Untapped potential in regions with developing healthcare systems.
- Portable and Ruggedized Devices: Demand for use in diverse environments.
- AI Integration: Predictive capabilities for optimal tourniquet application.
- Home Healthcare Applications: Expanding scope beyond traditional hospital settings.
Leading Players in the Electronic Tourniquet System Market
- Zimmer Biomet
- Delfi Medical
- Stryker
- RevMedx
- Komachine
- Raeen Sanat
- AneticAid
- Auxo Medical
- VBM Medical
- Avrasyamed Medikal
- Denyers
- Trimpeks Healthcare
- Hammarplast Medical AB
- SAM Medical
Key Developments in Electronic Tourniquet System Industry
- 2023: Launch of advanced dual-channel tourniquet systems with enhanced safety features by Stryker.
- 2022: Zimmer Biomet introduces a new portable electronic tourniquet with extended battery life.
- 2021: Delfi Medical receives FDA approval for its next-generation limb occlusion device.
- 2020: RevMedx expands its product offerings with a focus on battlefield trauma tourniquets.
- 2019: VBM Medical unveils an updated interface for its electronic tourniquet system, emphasizing user-friendliness.
Future Outlook for Electronic Tourniquet System Market
The future outlook for the Electronic Tourniquet System market is highly promising, driven by continued innovation and a growing global emphasis on improved patient outcomes. The increasing adoption of advanced surgical techniques, coupled with the rising incidence of trauma and chronic diseases requiring surgical intervention, will sustain robust demand. Technological advancements, such as miniaturization, wireless connectivity, and AI-driven features, will further enhance product offerings and market penetration. Strategic collaborations and potential acquisitions among key players are expected to shape the competitive landscape, leading to more integrated and comprehensive solutions for healthcare providers worldwide. The market is poised for significant expansion, with billions in projected value, making it a key area for investment and development in the medical device industry.
Electronic Tourniquet System Segmentation
-
1. Application
- 1.1. Hospital
- 1.2. Clinic
- 1.3. Home
-
2. Types
- 2.1. Single Channel
- 2.2. Dual Channel
Electronic Tourniquet System Segmentation By Geography
-
1. North America
- 1.1. United States
- 1.2. Canada
- 1.3. Mexico
-
2. South America
- 2.1. Brazil
- 2.2. Argentina
- 2.3. Rest of South America
-
3. Europe
- 3.1. United Kingdom
- 3.2. Germany
- 3.3. France
- 3.4. Italy
- 3.5. Spain
- 3.6. Russia
- 3.7. Benelux
- 3.8. Nordics
- 3.9. Rest of Europe
-
4. Middle East & Africa
- 4.1. Turkey
- 4.2. Israel
- 4.3. GCC
- 4.4. North Africa
- 4.5. South Africa
- 4.6. Rest of Middle East & Africa
-
5. Asia Pacific
- 5.1. China
- 5.2. India
- 5.3. Japan
- 5.4. South Korea
- 5.5. ASEAN
- 5.6. Oceania
- 5.7. Rest of Asia Pacific

Electronic Tourniquet System Regional Market Share
Geographic Coverage of Electronic Tourniquet System
Electronic Tourniquet System REPORT HIGHLIGHTS
| Aspects | Details |
|---|---|
| Study Period | 2020-2034 |
| Base Year | 2025 |
| Estimated Year | 2026 |
| Forecast Period | 2026-2034 |
| Historical Period | 2020-2025 |
| Growth Rate | CAGR of 12.4% from 2020-2034 |
| Segmentation |
|
Table of Contents
- 1. Introduction
- 1.1. Research Scope
- 1.2. Market Segmentation
- 1.3. Research Methodology
- 1.4. Definitions and Assumptions
- 2. Executive Summary
- 2.1. Introduction
- 3. Market Dynamics
- 3.1. Introduction
- 3.2. Market Drivers
- 3.3. Market Restrains
- 3.4. Market Trends
- 4. Market Factor Analysis
- 4.1. Porters Five Forces
- 4.2. Supply/Value Chain
- 4.3. PESTEL analysis
- 4.4. Market Entropy
- 4.5. Patent/Trademark Analysis
- 5. Global Electronic Tourniquet System Analysis, Insights and Forecast, 2020-2032
- 5.1. Market Analysis, Insights and Forecast - by Application
- 5.1.1. Hospital
- 5.1.2. Clinic
- 5.1.3. Home
- 5.2. Market Analysis, Insights and Forecast - by Types
- 5.2.1. Single Channel
- 5.2.2. Dual Channel
- 5.3. Market Analysis, Insights and Forecast - by Region
- 5.3.1. North America
- 5.3.2. South America
- 5.3.3. Europe
- 5.3.4. Middle East & Africa
- 5.3.5. Asia Pacific
- 5.1. Market Analysis, Insights and Forecast - by Application
- 6. North America Electronic Tourniquet System Analysis, Insights and Forecast, 2020-2032
- 6.1. Market Analysis, Insights and Forecast - by Application
- 6.1.1. Hospital
- 6.1.2. Clinic
- 6.1.3. Home
- 6.2. Market Analysis, Insights and Forecast - by Types
- 6.2.1. Single Channel
- 6.2.2. Dual Channel
- 6.1. Market Analysis, Insights and Forecast - by Application
- 7. South America Electronic Tourniquet System Analysis, Insights and Forecast, 2020-2032
- 7.1. Market Analysis, Insights and Forecast - by Application
- 7.1.1. Hospital
- 7.1.2. Clinic
- 7.1.3. Home
- 7.2. Market Analysis, Insights and Forecast - by Types
- 7.2.1. Single Channel
- 7.2.2. Dual Channel
- 7.1. Market Analysis, Insights and Forecast - by Application
- 8. Europe Electronic Tourniquet System Analysis, Insights and Forecast, 2020-2032
- 8.1. Market Analysis, Insights and Forecast - by Application
- 8.1.1. Hospital
- 8.1.2. Clinic
- 8.1.3. Home
- 8.2. Market Analysis, Insights and Forecast - by Types
- 8.2.1. Single Channel
- 8.2.2. Dual Channel
- 8.1. Market Analysis, Insights and Forecast - by Application
- 9. Middle East & Africa Electronic Tourniquet System Analysis, Insights and Forecast, 2020-2032
- 9.1. Market Analysis, Insights and Forecast - by Application
- 9.1.1. Hospital
- 9.1.2. Clinic
- 9.1.3. Home
- 9.2. Market Analysis, Insights and Forecast - by Types
- 9.2.1. Single Channel
- 9.2.2. Dual Channel
- 9.1. Market Analysis, Insights and Forecast - by Application
- 10. Asia Pacific Electronic Tourniquet System Analysis, Insights and Forecast, 2020-2032
- 10.1. Market Analysis, Insights and Forecast - by Application
- 10.1.1. Hospital
- 10.1.2. Clinic
- 10.1.3. Home
- 10.2. Market Analysis, Insights and Forecast - by Types
- 10.2.1. Single Channel
- 10.2.2. Dual Channel
- 10.1. Market Analysis, Insights and Forecast - by Application
- 11. Competitive Analysis
- 11.1. Global Market Share Analysis 2025
- 11.2. Company Profiles
- 11.2.1 Zimmer Biomet
- 11.2.1.1. Overview
- 11.2.1.2. Products
- 11.2.1.3. SWOT Analysis
- 11.2.1.4. Recent Developments
- 11.2.1.5. Financials (Based on Availability)
- 11.2.2 Delfi Medical
- 11.2.2.1. Overview
- 11.2.2.2. Products
- 11.2.2.3. SWOT Analysis
- 11.2.2.4. Recent Developments
- 11.2.2.5. Financials (Based on Availability)
- 11.2.3 Stryker
- 11.2.3.1. Overview
- 11.2.3.2. Products
- 11.2.3.3. SWOT Analysis
- 11.2.3.4. Recent Developments
- 11.2.3.5. Financials (Based on Availability)
- 11.2.4 RevMedx
- 11.2.4.1. Overview
- 11.2.4.2. Products
- 11.2.4.3. SWOT Analysis
- 11.2.4.4. Recent Developments
- 11.2.4.5. Financials (Based on Availability)
- 11.2.5 Komachine
- 11.2.5.1. Overview
- 11.2.5.2. Products
- 11.2.5.3. SWOT Analysis
- 11.2.5.4. Recent Developments
- 11.2.5.5. Financials (Based on Availability)
- 11.2.6 Raeen Sanat
- 11.2.6.1. Overview
- 11.2.6.2. Products
- 11.2.6.3. SWOT Analysis
- 11.2.6.4. Recent Developments
- 11.2.6.5. Financials (Based on Availability)
- 11.2.7 AneticAid
- 11.2.7.1. Overview
- 11.2.7.2. Products
- 11.2.7.3. SWOT Analysis
- 11.2.7.4. Recent Developments
- 11.2.7.5. Financials (Based on Availability)
- 11.2.8 Auxo Medical
- 11.2.8.1. Overview
- 11.2.8.2. Products
- 11.2.8.3. SWOT Analysis
- 11.2.8.4. Recent Developments
- 11.2.8.5. Financials (Based on Availability)
- 11.2.9 VBM Medical
- 11.2.9.1. Overview
- 11.2.9.2. Products
- 11.2.9.3. SWOT Analysis
- 11.2.9.4. Recent Developments
- 11.2.9.5. Financials (Based on Availability)
- 11.2.10 Avrasyamed Medikal
- 11.2.10.1. Overview
- 11.2.10.2. Products
- 11.2.10.3. SWOT Analysis
- 11.2.10.4. Recent Developments
- 11.2.10.5. Financials (Based on Availability)
- 11.2.11 Denyers
- 11.2.11.1. Overview
- 11.2.11.2. Products
- 11.2.11.3. SWOT Analysis
- 11.2.11.4. Recent Developments
- 11.2.11.5. Financials (Based on Availability)
- 11.2.12 Trimpeks Healthcare
- 11.2.12.1. Overview
- 11.2.12.2. Products
- 11.2.12.3. SWOT Analysis
- 11.2.12.4. Recent Developments
- 11.2.12.5. Financials (Based on Availability)
- 11.2.13 Hammarplast Medical AB
- 11.2.13.1. Overview
- 11.2.13.2. Products
- 11.2.13.3. SWOT Analysis
- 11.2.13.4. Recent Developments
- 11.2.13.5. Financials (Based on Availability)
- 11.2.14 SAM Medical
- 11.2.14.1. Overview
- 11.2.14.2. Products
- 11.2.14.3. SWOT Analysis
- 11.2.14.4. Recent Developments
- 11.2.14.5. Financials (Based on Availability)
- 11.2.1 Zimmer Biomet
List of Figures
- Figure 1: Global Electronic Tourniquet System Revenue Breakdown (billion, %) by Region 2025 & 2033
- Figure 2: Global Electronic Tourniquet System Volume Breakdown (K, %) by Region 2025 & 2033
- Figure 3: North America Electronic Tourniquet System Revenue (billion), by Application 2025 & 2033
- Figure 4: North America Electronic Tourniquet System Volume (K), by Application 2025 & 2033
- Figure 5: North America Electronic Tourniquet System Revenue Share (%), by Application 2025 & 2033
- Figure 6: North America Electronic Tourniquet System Volume Share (%), by Application 2025 & 2033
- Figure 7: North America Electronic Tourniquet System Revenue (billion), by Types 2025 & 2033
- Figure 8: North America Electronic Tourniquet System Volume (K), by Types 2025 & 2033
- Figure 9: North America Electronic Tourniquet System Revenue Share (%), by Types 2025 & 2033
- Figure 10: North America Electronic Tourniquet System Volume Share (%), by Types 2025 & 2033
- Figure 11: North America Electronic Tourniquet System Revenue (billion), by Country 2025 & 2033
- Figure 12: North America Electronic Tourniquet System Volume (K), by Country 2025 & 2033
- Figure 13: North America Electronic Tourniquet System Revenue Share (%), by Country 2025 & 2033
- Figure 14: North America Electronic Tourniquet System Volume Share (%), by Country 2025 & 2033
- Figure 15: South America Electronic Tourniquet System Revenue (billion), by Application 2025 & 2033
- Figure 16: South America Electronic Tourniquet System Volume (K), by Application 2025 & 2033
- Figure 17: South America Electronic Tourniquet System Revenue Share (%), by Application 2025 & 2033
- Figure 18: South America Electronic Tourniquet System Volume Share (%), by Application 2025 & 2033
- Figure 19: South America Electronic Tourniquet System Revenue (billion), by Types 2025 & 2033
- Figure 20: South America Electronic Tourniquet System Volume (K), by Types 2025 & 2033
- Figure 21: South America Electronic Tourniquet System Revenue Share (%), by Types 2025 & 2033
- Figure 22: South America Electronic Tourniquet System Volume Share (%), by Types 2025 & 2033
- Figure 23: South America Electronic Tourniquet System Revenue (billion), by Country 2025 & 2033
- Figure 24: South America Electronic Tourniquet System Volume (K), by Country 2025 & 2033
- Figure 25: South America Electronic Tourniquet System Revenue Share (%), by Country 2025 & 2033
- Figure 26: South America Electronic Tourniquet System Volume Share (%), by Country 2025 & 2033
- Figure 27: Europe Electronic Tourniquet System Revenue (billion), by Application 2025 & 2033
- Figure 28: Europe Electronic Tourniquet System Volume (K), by Application 2025 & 2033
- Figure 29: Europe Electronic Tourniquet System Revenue Share (%), by Application 2025 & 2033
- Figure 30: Europe Electronic Tourniquet System Volume Share (%), by Application 2025 & 2033
- Figure 31: Europe Electronic Tourniquet System Revenue (billion), by Types 2025 & 2033
- Figure 32: Europe Electronic Tourniquet System Volume (K), by Types 2025 & 2033
- Figure 33: Europe Electronic Tourniquet System Revenue Share (%), by Types 2025 & 2033
- Figure 34: Europe Electronic Tourniquet System Volume Share (%), by Types 2025 & 2033
- Figure 35: Europe Electronic Tourniquet System Revenue (billion), by Country 2025 & 2033
- Figure 36: Europe Electronic Tourniquet System Volume (K), by Country 2025 & 2033
- Figure 37: Europe Electronic Tourniquet System Revenue Share (%), by Country 2025 & 2033
- Figure 38: Europe Electronic Tourniquet System Volume Share (%), by Country 2025 & 2033
- Figure 39: Middle East & Africa Electronic Tourniquet System Revenue (billion), by Application 2025 & 2033
- Figure 40: Middle East & Africa Electronic Tourniquet System Volume (K), by Application 2025 & 2033
- Figure 41: Middle East & Africa Electronic Tourniquet System Revenue Share (%), by Application 2025 & 2033
- Figure 42: Middle East & Africa Electronic Tourniquet System Volume Share (%), by Application 2025 & 2033
- Figure 43: Middle East & Africa Electronic Tourniquet System Revenue (billion), by Types 2025 & 2033
- Figure 44: Middle East & Africa Electronic Tourniquet System Volume (K), by Types 2025 & 2033
- Figure 45: Middle East & Africa Electronic Tourniquet System Revenue Share (%), by Types 2025 & 2033
- Figure 46: Middle East & Africa Electronic Tourniquet System Volume Share (%), by Types 2025 & 2033
- Figure 47: Middle East & Africa Electronic Tourniquet System Revenue (billion), by Country 2025 & 2033
- Figure 48: Middle East & Africa Electronic Tourniquet System Volume (K), by Country 2025 & 2033
- Figure 49: Middle East & Africa Electronic Tourniquet System Revenue Share (%), by Country 2025 & 2033
- Figure 50: Middle East & Africa Electronic Tourniquet System Volume Share (%), by Country 2025 & 2033
- Figure 51: Asia Pacific Electronic Tourniquet System Revenue (billion), by Application 2025 & 2033
- Figure 52: Asia Pacific Electronic Tourniquet System Volume (K), by Application 2025 & 2033
- Figure 53: Asia Pacific Electronic Tourniquet System Revenue Share (%), by Application 2025 & 2033
- Figure 54: Asia Pacific Electronic Tourniquet System Volume Share (%), by Application 2025 & 2033
- Figure 55: Asia Pacific Electronic Tourniquet System Revenue (billion), by Types 2025 & 2033
- Figure 56: Asia Pacific Electronic Tourniquet System Volume (K), by Types 2025 & 2033
- Figure 57: Asia Pacific Electronic Tourniquet System Revenue Share (%), by Types 2025 & 2033
- Figure 58: Asia Pacific Electronic Tourniquet System Volume Share (%), by Types 2025 & 2033
- Figure 59: Asia Pacific Electronic Tourniquet System Revenue (billion), by Country 2025 & 2033
- Figure 60: Asia Pacific Electronic Tourniquet System Volume (K), by Country 2025 & 2033
- Figure 61: Asia Pacific Electronic Tourniquet System Revenue Share (%), by Country 2025 & 2033
- Figure 62: Asia Pacific Electronic Tourniquet System Volume Share (%), by Country 2025 & 2033
List of Tables
- Table 1: Global Electronic Tourniquet System Revenue billion Forecast, by Application 2020 & 2033
- Table 2: Global Electronic Tourniquet System Volume K Forecast, by Application 2020 & 2033
- Table 3: Global Electronic Tourniquet System Revenue billion Forecast, by Types 2020 & 2033
- Table 4: Global Electronic Tourniquet System Volume K Forecast, by Types 2020 & 2033
- Table 5: Global Electronic Tourniquet System Revenue billion Forecast, by Region 2020 & 2033
- Table 6: Global Electronic Tourniquet System Volume K Forecast, by Region 2020 & 2033
- Table 7: Global Electronic Tourniquet System Revenue billion Forecast, by Application 2020 & 2033
- Table 8: Global Electronic Tourniquet System Volume K Forecast, by Application 2020 & 2033
- Table 9: Global Electronic Tourniquet System Revenue billion Forecast, by Types 2020 & 2033
- Table 10: Global Electronic Tourniquet System Volume K Forecast, by Types 2020 & 2033
- Table 11: Global Electronic Tourniquet System Revenue billion Forecast, by Country 2020 & 2033
- Table 12: Global Electronic Tourniquet System Volume K Forecast, by Country 2020 & 2033
- Table 13: United States Electronic Tourniquet System Revenue (billion) Forecast, by Application 2020 & 2033
- Table 14: United States Electronic Tourniquet System Volume (K) Forecast, by Application 2020 & 2033
- Table 15: Canada Electronic Tourniquet System Revenue (billion) Forecast, by Application 2020 & 2033
- Table 16: Canada Electronic Tourniquet System Volume (K) Forecast, by Application 2020 & 2033
- Table 17: Mexico Electronic Tourniquet System Revenue (billion) Forecast, by Application 2020 & 2033
- Table 18: Mexico Electronic Tourniquet System Volume (K) Forecast, by Application 2020 & 2033
- Table 19: Global Electronic Tourniquet System Revenue billion Forecast, by Application 2020 & 2033
- Table 20: Global Electronic Tourniquet System Volume K Forecast, by Application 2020 & 2033
- Table 21: Global Electronic Tourniquet System Revenue billion Forecast, by Types 2020 & 2033
- Table 22: Global Electronic Tourniquet System Volume K Forecast, by Types 2020 & 2033
- Table 23: Global Electronic Tourniquet System Revenue billion Forecast, by Country 2020 & 2033
- Table 24: Global Electronic Tourniquet System Volume K Forecast, by Country 2020 & 2033
- Table 25: Brazil Electronic Tourniquet System Revenue (billion) Forecast, by Application 2020 & 2033
- Table 26: Brazil Electronic Tourniquet System Volume (K) Forecast, by Application 2020 & 2033
- Table 27: Argentina Electronic Tourniquet System Revenue (billion) Forecast, by Application 2020 & 2033
- Table 28: Argentina Electronic Tourniquet System Volume (K) Forecast, by Application 2020 & 2033
- Table 29: Rest of South America Electronic Tourniquet System Revenue (billion) Forecast, by Application 2020 & 2033
- Table 30: Rest of South America Electronic Tourniquet System Volume (K) Forecast, by Application 2020 & 2033
- Table 31: Global Electronic Tourniquet System Revenue billion Forecast, by Application 2020 & 2033
- Table 32: Global Electronic Tourniquet System Volume K Forecast, by Application 2020 & 2033
- Table 33: Global Electronic Tourniquet System Revenue billion Forecast, by Types 2020 & 2033
- Table 34: Global Electronic Tourniquet System Volume K Forecast, by Types 2020 & 2033
- Table 35: Global Electronic Tourniquet System Revenue billion Forecast, by Country 2020 & 2033
- Table 36: Global Electronic Tourniquet System Volume K Forecast, by Country 2020 & 2033
- Table 37: United Kingdom Electronic Tourniquet System Revenue (billion) Forecast, by Application 2020 & 2033
- Table 38: United Kingdom Electronic Tourniquet System Volume (K) Forecast, by Application 2020 & 2033
- Table 39: Germany Electronic Tourniquet System Revenue (billion) Forecast, by Application 2020 & 2033
- Table 40: Germany Electronic Tourniquet System Volume (K) Forecast, by Application 2020 & 2033
- Table 41: France Electronic Tourniquet System Revenue (billion) Forecast, by Application 2020 & 2033
- Table 42: France Electronic Tourniquet System Volume (K) Forecast, by Application 2020 & 2033
- Table 43: Italy Electronic Tourniquet System Revenue (billion) Forecast, by Application 2020 & 2033
- Table 44: Italy Electronic Tourniquet System Volume (K) Forecast, by Application 2020 & 2033
- Table 45: Spain Electronic Tourniquet System Revenue (billion) Forecast, by Application 2020 & 2033
- Table 46: Spain Electronic Tourniquet System Volume (K) Forecast, by Application 2020 & 2033
- Table 47: Russia Electronic Tourniquet System Revenue (billion) Forecast, by Application 2020 & 2033
- Table 48: Russia Electronic Tourniquet System Volume (K) Forecast, by Application 2020 & 2033
- Table 49: Benelux Electronic Tourniquet System Revenue (billion) Forecast, by Application 2020 & 2033
- Table 50: Benelux Electronic Tourniquet System Volume (K) Forecast, by Application 2020 & 2033
- Table 51: Nordics Electronic Tourniquet System Revenue (billion) Forecast, by Application 2020 & 2033
- Table 52: Nordics Electronic Tourniquet System Volume (K) Forecast, by Application 2020 & 2033
- Table 53: Rest of Europe Electronic Tourniquet System Revenue (billion) Forecast, by Application 2020 & 2033
- Table 54: Rest of Europe Electronic Tourniquet System Volume (K) Forecast, by Application 2020 & 2033
- Table 55: Global Electronic Tourniquet System Revenue billion Forecast, by Application 2020 & 2033
- Table 56: Global Electronic Tourniquet System Volume K Forecast, by Application 2020 & 2033
- Table 57: Global Electronic Tourniquet System Revenue billion Forecast, by Types 2020 & 2033
- Table 58: Global Electronic Tourniquet System Volume K Forecast, by Types 2020 & 2033
- Table 59: Global Electronic Tourniquet System Revenue billion Forecast, by Country 2020 & 2033
- Table 60: Global Electronic Tourniquet System Volume K Forecast, by Country 2020 & 2033
- Table 61: Turkey Electronic Tourniquet System Revenue (billion) Forecast, by Application 2020 & 2033
- Table 62: Turkey Electronic Tourniquet System Volume (K) Forecast, by Application 2020 & 2033
- Table 63: Israel Electronic Tourniquet System Revenue (billion) Forecast, by Application 2020 & 2033
- Table 64: Israel Electronic Tourniquet System Volume (K) Forecast, by Application 2020 & 2033
- Table 65: GCC Electronic Tourniquet System Revenue (billion) Forecast, by Application 2020 & 2033
- Table 66: GCC Electronic Tourniquet System Volume (K) Forecast, by Application 2020 & 2033
- Table 67: North Africa Electronic Tourniquet System Revenue (billion) Forecast, by Application 2020 & 2033
- Table 68: North Africa Electronic Tourniquet System Volume (K) Forecast, by Application 2020 & 2033
- Table 69: South Africa Electronic Tourniquet System Revenue (billion) Forecast, by Application 2020 & 2033
- Table 70: South Africa Electronic Tourniquet System Volume (K) Forecast, by Application 2020 & 2033
- Table 71: Rest of Middle East & Africa Electronic Tourniquet System Revenue (billion) Forecast, by Application 2020 & 2033
- Table 72: Rest of Middle East & Africa Electronic Tourniquet System Volume (K) Forecast, by Application 2020 & 2033
- Table 73: Global Electronic Tourniquet System Revenue billion Forecast, by Application 2020 & 2033
- Table 74: Global Electronic Tourniquet System Volume K Forecast, by Application 2020 & 2033
- Table 75: Global Electronic Tourniquet System Revenue billion Forecast, by Types 2020 & 2033
- Table 76: Global Electronic Tourniquet System Volume K Forecast, by Types 2020 & 2033
- Table 77: Global Electronic Tourniquet System Revenue billion Forecast, by Country 2020 & 2033
- Table 78: Global Electronic Tourniquet System Volume K Forecast, by Country 2020 & 2033
- Table 79: China Electronic Tourniquet System Revenue (billion) Forecast, by Application 2020 & 2033
- Table 80: China Electronic Tourniquet System Volume (K) Forecast, by Application 2020 & 2033
- Table 81: India Electronic Tourniquet System Revenue (billion) Forecast, by Application 2020 & 2033
- Table 82: India Electronic Tourniquet System Volume (K) Forecast, by Application 2020 & 2033
- Table 83: Japan Electronic Tourniquet System Revenue (billion) Forecast, by Application 2020 & 2033
- Table 84: Japan Electronic Tourniquet System Volume (K) Forecast, by Application 2020 & 2033
- Table 85: South Korea Electronic Tourniquet System Revenue (billion) Forecast, by Application 2020 & 2033
- Table 86: South Korea Electronic Tourniquet System Volume (K) Forecast, by Application 2020 & 2033
- Table 87: ASEAN Electronic Tourniquet System Revenue (billion) Forecast, by Application 2020 & 2033
- Table 88: ASEAN Electronic Tourniquet System Volume (K) Forecast, by Application 2020 & 2033
- Table 89: Oceania Electronic Tourniquet System Revenue (billion) Forecast, by Application 2020 & 2033
- Table 90: Oceania Electronic Tourniquet System Volume (K) Forecast, by Application 2020 & 2033
- Table 91: Rest of Asia Pacific Electronic Tourniquet System Revenue (billion) Forecast, by Application 2020 & 2033
- Table 92: Rest of Asia Pacific Electronic Tourniquet System Volume (K) Forecast, by Application 2020 & 2033
Frequently Asked Questions
1. What is the projected Compound Annual Growth Rate (CAGR) of the Electronic Tourniquet System?
The projected CAGR is approximately 12.4%.
2. Which companies are prominent players in the Electronic Tourniquet System?
Key companies in the market include Zimmer Biomet, Delfi Medical, Stryker, RevMedx, Komachine, Raeen Sanat, AneticAid, Auxo Medical, VBM Medical, Avrasyamed Medikal, Denyers, Trimpeks Healthcare, Hammarplast Medical AB, SAM Medical.
3. What are the main segments of the Electronic Tourniquet System?
The market segments include Application, Types.
4. Can you provide details about the market size?
The market size is estimated to be USD 11.43 billion as of 2022.
5. What are some drivers contributing to market growth?
N/A
6. What are the notable trends driving market growth?
N/A
7. Are there any restraints impacting market growth?
N/A
8. Can you provide examples of recent developments in the market?
N/A
9. What pricing options are available for accessing the report?
Pricing options include single-user, multi-user, and enterprise licenses priced at USD 3350.00, USD 5025.00, and USD 6700.00 respectively.
10. Is the market size provided in terms of value or volume?
The market size is provided in terms of value, measured in billion and volume, measured in K.
11. Are there any specific market keywords associated with the report?
Yes, the market keyword associated with the report is "Electronic Tourniquet System," which aids in identifying and referencing the specific market segment covered.
12. How do I determine which pricing option suits my needs best?
The pricing options vary based on user requirements and access needs. Individual users may opt for single-user licenses, while businesses requiring broader access may choose multi-user or enterprise licenses for cost-effective access to the report.
13. Are there any additional resources or data provided in the Electronic Tourniquet System report?
While the report offers comprehensive insights, it's advisable to review the specific contents or supplementary materials provided to ascertain if additional resources or data are available.
14. How can I stay updated on further developments or reports in the Electronic Tourniquet System?
To stay informed about further developments, trends, and reports in the Electronic Tourniquet System, consider subscribing to industry newsletters, following relevant companies and organizations, or regularly checking reputable industry news sources and publications.
Methodology
Step 1 - Identification of Relevant Samples Size from Population Database


Step 2 - Approaches for Defining Global Market Size (Value, Volume* & Price*)

Note*: In applicable scenarios
Step 3 - Data Sources
Primary Research
- Web Analytics
- Survey Reports
- Research Institute
- Latest Research Reports
- Opinion Leaders
Secondary Research
- Annual Reports
- White Paper
- Latest Press Release
- Industry Association
- Paid Database
- Investor Presentations

Step 4 - Data Triangulation
Involves using different sources of information in order to increase the validity of a study
These sources are likely to be stakeholders in a program - participants, other researchers, program staff, other community members, and so on.
Then we put all data in single framework & apply various statistical tools to find out the dynamic on the market.
During the analysis stage, feedback from the stakeholder groups would be compared to determine areas of agreement as well as areas of divergence