

Key Insights
The Electronically Scanned Array (ESA) radar market is poised for significant expansion, driven by escalating demand for advanced surveillance and defense solutions. Our analysis forecasts a Compound Annual Growth Rate (CAGR) of 9.7%, with the market projected to reach 12.35 billion by 2025. This robust growth is attributed to several key drivers. The imperative for enhanced situational awareness in both military and civilian operations is propelling the adoption of ESA radars, which offer superior performance over traditional mechanically scanned systems. Furthermore, ongoing technological innovations are yielding smaller, lighter, and more energy-efficient ESA radar systems, expanding their deployment across diverse platforms. The integration of ESA technology with autonomous systems and advancements in Artificial Intelligence (AI) for signal processing are also key contributors to market expansion. In terms of segmentation, active ESA systems command a substantial market share due to their advanced capabilities, while passive ESA technology is gaining traction for its cost-effectiveness in specific applications. The land-based segment currently leads the market, with rapid growth anticipated in the air and sea segments, driven by increased investments in aerospace and naval defense. Retrofit applications represent a considerable opportunity for upgrading existing systems with ESA technology. Leading players are spearheading innovation and market consolidation.
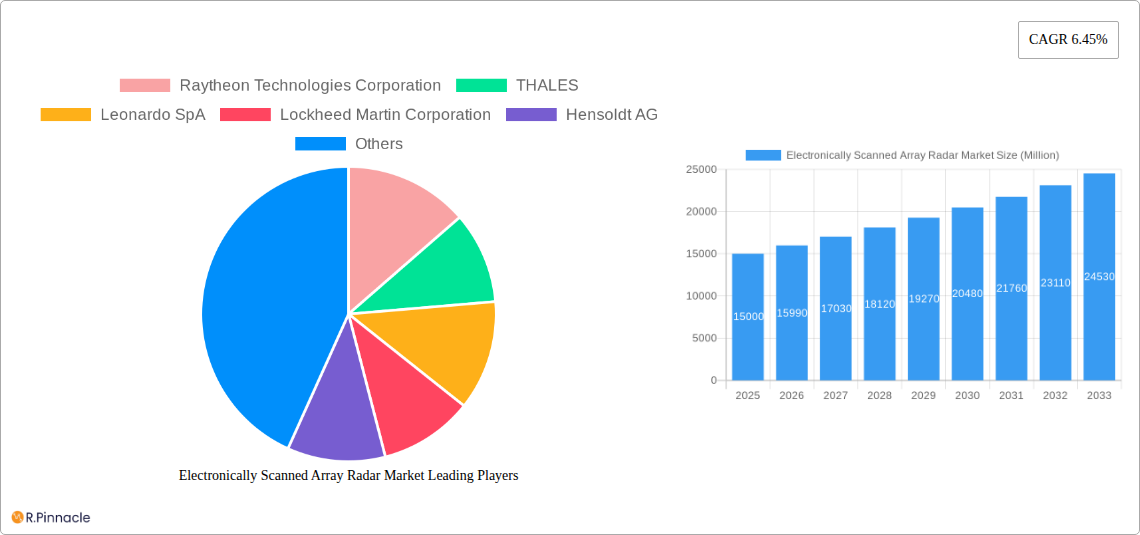
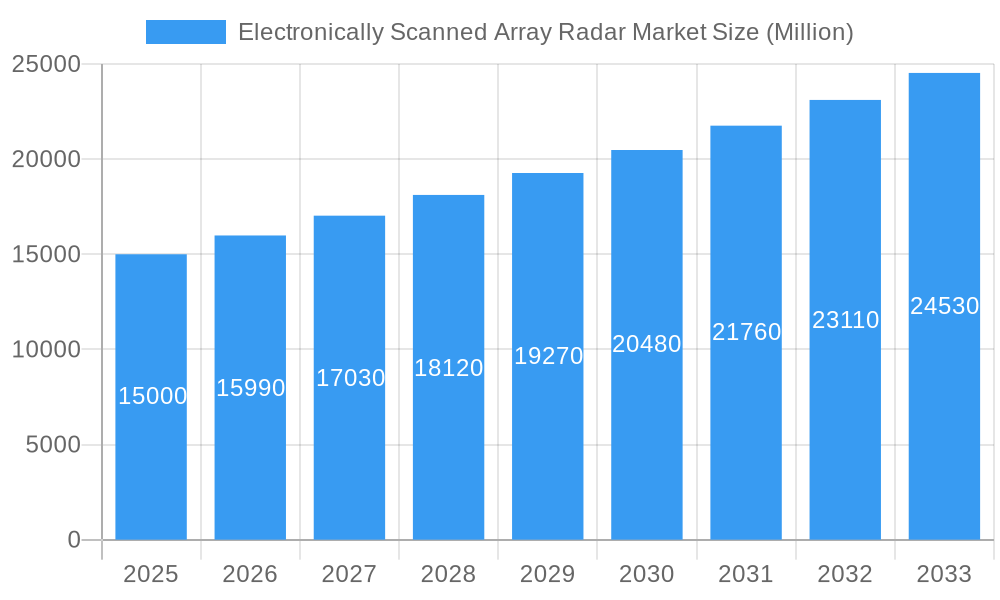
Electronically Scanned Array Radar Market Market Size (In Billion)
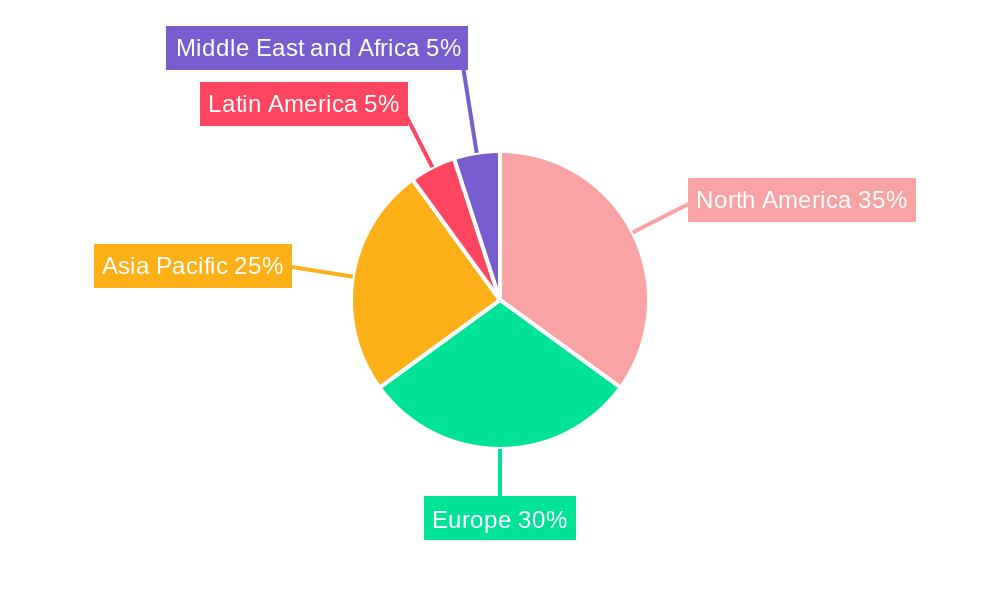
Geographically, the ESA radar market mirrors global defense spending trends. North America and Europe currently dominate, supported by substantial government investments in defense modernization. The Asia-Pacific region is emerging as a significant growth engine, fueled by escalating military expenditures and infrastructure development in key nations. While high initial investment costs and integration complexities present challenges, the overall market outlook remains highly positive. This optimism is underpinned by continuous technological advancements, burgeoning demand for superior surveillance capabilities, and strong governmental support across numerous regions.
Electronically Scanned Array Radar Market Company Market Share
Electronically Scanned Array Radar Market: A Comprehensive Report (2019-2033)
This in-depth report provides a comprehensive analysis of the Electronically Scanned Array (ESA) Radar market, offering valuable insights for industry professionals, investors, and strategists. Covering the period from 2019 to 2033, with a focus on 2025, this report unveils market dynamics, key players, and future growth potential. The market is segmented by type (Active and Passive ESA), platform (Land, Air, Sea), and fit (Line Fit, Retrofit), providing granular analysis for strategic decision-making.
Electronically Scanned Array Radar Market Market Structure & Innovation Trends
The Electronically Scanned Array Radar market exhibits a moderately concentrated structure, with key players such as Raytheon Technologies Corporation, THALES, Leonardo SpA, and Lockheed Martin Corporation holding significant market share. Precise market share figures are unavailable, but estimates suggest that the top five players collectively account for approximately xx% of the total market revenue. Innovation is a key driver, with ongoing advancements in AESA technology, miniaturization, and improved signal processing capabilities. Regulatory frameworks, particularly those concerning defense spending and export controls, significantly influence market growth. Product substitutes, such as traditional phased array radars, pose some competitive pressure but are increasingly being replaced by ESA radars due to superior performance. The end-user demographics are primarily government agencies (military and defense) and commercial entities (air traffic control, maritime surveillance). M&A activities have been moderate, with deal values averaging approximately USD xx Million in recent years, showcasing consolidation and strategic partnerships among industry players.
Electronically Scanned Array Radar Market Market Dynamics & Trends
The Electronically Scanned Array Radar market is experiencing robust growth, driven by increasing defense budgets globally, rising demand for advanced surveillance systems, and technological advancements leading to enhanced radar performance. The Compound Annual Growth Rate (CAGR) for the forecast period (2025-2033) is estimated at xx%. This growth is further fueled by technological disruptions, including the development of GaN-based ESA radars and the integration of AI and machine learning algorithms for improved target detection and tracking. Consumer preferences, particularly within the defense sector, emphasize improved accuracy, range, and multi-functionality, driving adoption of ESA radar systems. Competitive dynamics are intense, with established players focusing on technological innovation and strategic partnerships to maintain their market position. Market penetration for ESA radars is increasing in both military and commercial applications, with a forecasted xx% penetration by 2033.
Dominant Regions & Segments in Electronically Scanned Array Radar Market
The North American region currently holds the dominant position in the Electronically Scanned Array Radar market, driven by substantial defense spending and a strong technological base. However, the Asia-Pacific region is expected to exhibit the highest growth rate during the forecast period, fueled by rising defense modernization initiatives and increasing investment in surveillance infrastructure.
- Key Drivers for North America: Strong defense budgets, advanced technological capabilities, and a well-established aerospace and defense industry.
- Key Drivers for Asia-Pacific: Rising defense expenditure, modernization of armed forces, and increasing demand for improved border security.
Within the segments:
- Type: The Active Electronically Scanned Array segment dominates due to superior performance capabilities.
- Platform: The Air segment currently holds the largest market share, followed by Land and Sea.
- Fit: Line Fit installations account for a larger share than Retrofits due to the integration during initial equipment production.
Electronically Scanned Array Radar Market Product Innovations
Recent product developments have focused on miniaturization, improved signal processing, and enhanced multi-functionality. This includes the integration of advanced materials such as GaN for higher power efficiency and the incorporation of AI for improved target recognition. These innovations provide competitive advantages by enhancing radar accuracy, range, and overall performance, leading to increased market adoption and driving market growth.
Report Scope & Segmentation Analysis
This report comprehensively segments the Electronically Scanned Array Radar market into:
Type: Active Electronically Scanned Array (market size USD xx Million in 2025, projected CAGR xx%), Passive Electronically Scanned Array (market size USD xx Million in 2025, projected CAGR xx%). Active ESA exhibits faster growth due to superior capabilities. Competitive dynamics are marked by technological advancements and ongoing R&D.
Platform: Land (market size USD xx Million in 2025, projected CAGR xx%), Air (market size USD xx Million in 2025, projected CAGR xx%), Sea (market size USD xx Million in 2025, projected CAGR xx%). The Air segment dominates due to high demand from military aviation. Competitive dynamics are highly intense, driven by technological innovation and government contracts.
Fit: Line Fit (market size USD xx Million in 2025, projected CAGR xx%), Retrofit (market size USD xx Million in 2025, projected CAGR xx%). Line Fit installations dominate, but Retrofit is a significant growth area, driven by modernization efforts.
Key Drivers of Electronically Scanned Array Radar Market Growth
Technological advancements in AESA technology, such as GaN-based transistors, are significantly driving market growth. Increased defense spending globally, particularly in regions like Asia-Pacific, fuels demand. Furthermore, the rising need for enhanced surveillance and security systems across various sectors contributes to market expansion. Government regulations supporting defense modernization further stimulate market growth.
Challenges in the Electronically Scanned Array Radar Market Sector
High development and production costs represent a significant barrier to entry and widespread adoption. Supply chain disruptions impacting component availability can affect production timelines and costs. Intense competition among established players and emerging entrants poses a challenge to maintaining market share and profitability. Strict regulatory frameworks for export and technology transfer can also limit market access in certain regions. These challenges collectively impact the overall market growth, but innovation and technological advancement are expected to mitigate these risks over the long term.
Emerging Opportunities in Electronically Scanned Array Radar Market
The integration of AI and machine learning in ESA radars offers significant opportunities for enhanced target recognition and tracking. The expanding application of ESA radars in commercial sectors like air traffic management and maritime surveillance presents lucrative opportunities. Emerging markets in developing economies with increasing defense budgets offer significant growth potential. The development of compact and cost-effective ESA radar systems for unmanned aerial vehicles (UAVs) and other platforms is a key emerging opportunity.
Leading Players in the Electronically Scanned Array Radar Market Market
- Raytheon Technologies Corporation (https://www.raytheon.com/)
- THALES (https://www.thalesgroup.com/)
- Leonardo SpA (https://www.leonardocompany.com/en/)
- Lockheed Martin Corporation (https://www.lockheedmartin.com/)
- Hensoldt AG
- RADA Electronic Industries Ltd
- Mitsubishi Electric Corporation (https://www.mitsubishielectric.com/)
- Israel Aerospace Industries
- ASELSAN A
- CEA Technologies
- Northrop Grumman Corporation (https://www.northropgrumman.com/)
- Saab AB (https://www.saab.com/)
Key Developments in Electronically Scanned Array Radar Industry
March 2023: The Indian Ministry of Defence signed two contracts worth USD 448.44 Million with Bharat Electronics Limited (BEL) for radar and warning receivers. This signifies a significant boost for the market in the Asia-Pacific region.
September 2022: Raytheon secured a USD 19.4 Million contract to supply components for the APG-79 AESA radar system. This contract highlights the ongoing demand for AESA technology within the defense sector.
Future Outlook for Electronically Scanned Array Radar Market Market
The Electronically Scanned Array Radar market is poised for continued growth, driven by technological innovation, increasing defense spending, and expansion into new commercial applications. The development of more affordable and compact systems will further enhance market penetration. Strategic partnerships and collaborations among key players will shape the competitive landscape. The market's future outlook remains highly positive, with significant growth potential across various regions and segments.
Electronically Scanned Array Radar Market Segmentation
- 1. Production Analysis
- 2. Consumption Analysis
- 3. Import Market Analysis (Value & Volume)
- 4. Export Market Analysis (Value & Volume)
- 5. Price Trend Analysis
Electronically Scanned Array Radar Market Segmentation By Geography
-
1. North America
- 1.1. United States
- 1.2. Canada
- 1.3. Mexico
-
2. South America
- 2.1. Brazil
- 2.2. Argentina
- 2.3. Rest of South America
-
3. Europe
- 3.1. United Kingdom
- 3.2. Germany
- 3.3. France
- 3.4. Italy
- 3.5. Spain
- 3.6. Russia
- 3.7. Benelux
- 3.8. Nordics
- 3.9. Rest of Europe
-
4. Middle East & Africa
- 4.1. Turkey
- 4.2. Israel
- 4.3. GCC
- 4.4. North Africa
- 4.5. South Africa
- 4.6. Rest of Middle East & Africa
-
5. Asia Pacific
- 5.1. China
- 5.2. India
- 5.3. Japan
- 5.4. South Korea
- 5.5. ASEAN
- 5.6. Oceania
- 5.7. Rest of Asia Pacific
Electronically Scanned Array Radar Market Regional Market Share
Geographic Coverage of Electronically Scanned Array Radar Market
Electronically Scanned Array Radar Market REPORT HIGHLIGHTS
| Aspects | Details |
|---|---|
| Study Period | 2020-2034 |
| Base Year | 2025 |
| Estimated Year | 2026 |
| Forecast Period | 2026-2034 |
| Historical Period | 2020-2025 |
| Growth Rate | CAGR of 9.7% from 2020-2034 |
| Segmentation |
|
Table of Contents
- 1. Introduction
- 1.1. Research Scope
- 1.2. Market Segmentation
- 1.3. Research Objective
- 1.4. Definitions and Assumptions
- 2. Executive Summary
- 2.1. Market Snapshot
- 3. Market Dynamics
- 3.1. Market Drivers
- 3.2. Market Restrains
- 3.3. Market Trends
- 3.4. Market Opportunities
- 4. Market Factor Analysis
- 4.1. Porters Five Forces
- 4.1.1. Bargaining Power of Suppliers
- 4.1.2. Bargaining Power of Buyers
- 4.1.3. Threat of New Entrants
- 4.1.4. Threat of Substitutes
- 4.1.5. Competitive Rivalry
- 4.2. PESTEL analysis
- 4.3. BCG Analysis
- 4.3.1. Stars (High Growth, High Market Share)
- 4.3.2. Cash Cows (Low Growth, High Market Share)
- 4.3.3. Question Mark (High Growth, Low Market Share)
- 4.3.4. Dogs (Low Growth, Low Market Share)
- 4.4. Ansoff Matrix Analysis
- 4.5. Supply Chain Analysis
- 4.6. Regulatory Landscape
- 4.7. Current Market Potential and Opportunity Assessment (TAM–SAM–SOM Framework)
- 4.8. PRI Analyst Note
- 4.1. Porters Five Forces
- 5. Market Analysis, Insights and Forecast 2021-2033
- 5.1. Market Analysis, Insights and Forecast - by Production Analysis
- 5.2. Market Analysis, Insights and Forecast - by Consumption Analysis
- 5.3. Market Analysis, Insights and Forecast - by Import Market Analysis (Value & Volume)
- 5.4. Market Analysis, Insights and Forecast - by Export Market Analysis (Value & Volume)
- 5.5. Market Analysis, Insights and Forecast - by Price Trend Analysis
- 5.6. Market Analysis, Insights and Forecast - by Region
- 5.6.1. North America
- 5.6.2. South America
- 5.6.3. Europe
- 5.6.4. Middle East & Africa
- 5.6.5. Asia Pacific
- 6. Global Electronically Scanned Array Radar Market Analysis, Insights and Forecast, 2021-2033
- 6.1. Market Analysis, Insights and Forecast - by Production Analysis
- 6.2. Market Analysis, Insights and Forecast - by Consumption Analysis
- 6.3. Market Analysis, Insights and Forecast - by Import Market Analysis (Value & Volume)
- 6.4. Market Analysis, Insights and Forecast - by Export Market Analysis (Value & Volume)
- 6.5. Market Analysis, Insights and Forecast - by Price Trend Analysis
- 7. North America Electronically Scanned Array Radar Market Analysis, Insights and Forecast, 2020-2032
- 7.1. Market Analysis, Insights and Forecast - by Production Analysis
- 7.2. Market Analysis, Insights and Forecast - by Consumption Analysis
- 7.3. Market Analysis, Insights and Forecast - by Import Market Analysis (Value & Volume)
- 7.4. Market Analysis, Insights and Forecast - by Export Market Analysis (Value & Volume)
- 7.5. Market Analysis, Insights and Forecast - by Price Trend Analysis
- 8. South America Electronically Scanned Array Radar Market Analysis, Insights and Forecast, 2020-2032
- 8.1. Market Analysis, Insights and Forecast - by Production Analysis
- 8.2. Market Analysis, Insights and Forecast - by Consumption Analysis
- 8.3. Market Analysis, Insights and Forecast - by Import Market Analysis (Value & Volume)
- 8.4. Market Analysis, Insights and Forecast - by Export Market Analysis (Value & Volume)
- 8.5. Market Analysis, Insights and Forecast - by Price Trend Analysis
- 9. Europe Electronically Scanned Array Radar Market Analysis, Insights and Forecast, 2020-2032
- 9.1. Market Analysis, Insights and Forecast - by Production Analysis
- 9.2. Market Analysis, Insights and Forecast - by Consumption Analysis
- 9.3. Market Analysis, Insights and Forecast - by Import Market Analysis (Value & Volume)
- 9.4. Market Analysis, Insights and Forecast - by Export Market Analysis (Value & Volume)
- 9.5. Market Analysis, Insights and Forecast - by Price Trend Analysis
- 10. Middle East & Africa Electronically Scanned Array Radar Market Analysis, Insights and Forecast, 2020-2032
- 10.1. Market Analysis, Insights and Forecast - by Production Analysis
- 10.2. Market Analysis, Insights and Forecast - by Consumption Analysis
- 10.3. Market Analysis, Insights and Forecast - by Import Market Analysis (Value & Volume)
- 10.4. Market Analysis, Insights and Forecast - by Export Market Analysis (Value & Volume)
- 10.5. Market Analysis, Insights and Forecast - by Price Trend Analysis
- 11. Asia Pacific Electronically Scanned Array Radar Market Analysis, Insights and Forecast, 2020-2032
- 11.1. Market Analysis, Insights and Forecast - by Production Analysis
- 11.2. Market Analysis, Insights and Forecast - by Consumption Analysis
- 11.3. Market Analysis, Insights and Forecast - by Import Market Analysis (Value & Volume)
- 11.4. Market Analysis, Insights and Forecast - by Export Market Analysis (Value & Volume)
- 11.5. Market Analysis, Insights and Forecast - by Price Trend Analysis
- 12. Competitive Analysis
- 12.1. Company Profiles
- 12.1.1 Raytheon Technologies Corporation
- 12.1.1.1. Company Overview
- 12.1.1.2. Products
- 12.1.1.3. Company Financials
- 12.1.1.4. SWOT Analysis
- 12.1.2 THALES
- 12.1.2.1. Company Overview
- 12.1.2.2. Products
- 12.1.2.3. Company Financials
- 12.1.2.4. SWOT Analysis
- 12.1.3 Leonardo SpA
- 12.1.3.1. Company Overview
- 12.1.3.2. Products
- 12.1.3.3. Company Financials
- 12.1.3.4. SWOT Analysis
- 12.1.4 Lockheed Martin Corporation
- 12.1.4.1. Company Overview
- 12.1.4.2. Products
- 12.1.4.3. Company Financials
- 12.1.4.4. SWOT Analysis
- 12.1.5 Hensoldt AG
- 12.1.5.1. Company Overview
- 12.1.5.2. Products
- 12.1.5.3. Company Financials
- 12.1.5.4. SWOT Analysis
- 12.1.6 RADA Electronic Industries Ltd
- 12.1.6.1. Company Overview
- 12.1.6.2. Products
- 12.1.6.3. Company Financials
- 12.1.6.4. SWOT Analysis
- 12.1.7 Mitsubishi Electric Corporation
- 12.1.7.1. Company Overview
- 12.1.7.2. Products
- 12.1.7.3. Company Financials
- 12.1.7.4. SWOT Analysis
- 12.1.8 Israel Aerospace Industries
- 12.1.8.1. Company Overview
- 12.1.8.2. Products
- 12.1.8.3. Company Financials
- 12.1.8.4. SWOT Analysis
- 12.1.9 ASELSAN A
- 12.1.9.1. Company Overview
- 12.1.9.2. Products
- 12.1.9.3. Company Financials
- 12.1.9.4. SWOT Analysis
- 12.1.10 CEA Technologies
- 12.1.10.1. Company Overview
- 12.1.10.2. Products
- 12.1.10.3. Company Financials
- 12.1.10.4. SWOT Analysis
- 12.1.11 Northrop Grumman Corporation
- 12.1.11.1. Company Overview
- 12.1.11.2. Products
- 12.1.11.3. Company Financials
- 12.1.11.4. SWOT Analysis
- 12.1.12 Saab AB
- 12.1.12.1. Company Overview
- 12.1.12.2. Products
- 12.1.12.3. Company Financials
- 12.1.12.4. SWOT Analysis
- 12.1.1 Raytheon Technologies Corporation
- 12.2. Market Entropy
- 12.2.1 Company's Key Areas Served
- 12.2.2 Recent Developments
- 12.3. Company Market Share Analysis 2025
- 12.3.1 Top 5 Companies Market Share Analysis
- 12.3.2 Top 3 Companies Market Share Analysis
- 12.4. List of Potential Customers
- 13. Research Methodology
List of Figures
- Figure 1: Global Electronically Scanned Array Radar Market Revenue Breakdown (billion, %) by Region 2025 & 2033
- Figure 2: North America Electronically Scanned Array Radar Market Revenue (billion), by Production Analysis 2025 & 2033
- Figure 3: North America Electronically Scanned Array Radar Market Revenue Share (%), by Production Analysis 2025 & 2033
- Figure 4: North America Electronically Scanned Array Radar Market Revenue (billion), by Consumption Analysis 2025 & 2033
- Figure 5: North America Electronically Scanned Array Radar Market Revenue Share (%), by Consumption Analysis 2025 & 2033
- Figure 6: North America Electronically Scanned Array Radar Market Revenue (billion), by Import Market Analysis (Value & Volume) 2025 & 2033
- Figure 7: North America Electronically Scanned Array Radar Market Revenue Share (%), by Import Market Analysis (Value & Volume) 2025 & 2033
- Figure 8: North America Electronically Scanned Array Radar Market Revenue (billion), by Export Market Analysis (Value & Volume) 2025 & 2033
- Figure 9: North America Electronically Scanned Array Radar Market Revenue Share (%), by Export Market Analysis (Value & Volume) 2025 & 2033
- Figure 10: North America Electronically Scanned Array Radar Market Revenue (billion), by Price Trend Analysis 2025 & 2033
- Figure 11: North America Electronically Scanned Array Radar Market Revenue Share (%), by Price Trend Analysis 2025 & 2033
- Figure 12: North America Electronically Scanned Array Radar Market Revenue (billion), by Country 2025 & 2033
- Figure 13: North America Electronically Scanned Array Radar Market Revenue Share (%), by Country 2025 & 2033
- Figure 14: South America Electronically Scanned Array Radar Market Revenue (billion), by Production Analysis 2025 & 2033
- Figure 15: South America Electronically Scanned Array Radar Market Revenue Share (%), by Production Analysis 2025 & 2033
- Figure 16: South America Electronically Scanned Array Radar Market Revenue (billion), by Consumption Analysis 2025 & 2033
- Figure 17: South America Electronically Scanned Array Radar Market Revenue Share (%), by Consumption Analysis 2025 & 2033
- Figure 18: South America Electronically Scanned Array Radar Market Revenue (billion), by Import Market Analysis (Value & Volume) 2025 & 2033
- Figure 19: South America Electronically Scanned Array Radar Market Revenue Share (%), by Import Market Analysis (Value & Volume) 2025 & 2033
- Figure 20: South America Electronically Scanned Array Radar Market Revenue (billion), by Export Market Analysis (Value & Volume) 2025 & 2033
- Figure 21: South America Electronically Scanned Array Radar Market Revenue Share (%), by Export Market Analysis (Value & Volume) 2025 & 2033
- Figure 22: South America Electronically Scanned Array Radar Market Revenue (billion), by Price Trend Analysis 2025 & 2033
- Figure 23: South America Electronically Scanned Array Radar Market Revenue Share (%), by Price Trend Analysis 2025 & 2033
- Figure 24: South America Electronically Scanned Array Radar Market Revenue (billion), by Country 2025 & 2033
- Figure 25: South America Electronically Scanned Array Radar Market Revenue Share (%), by Country 2025 & 2033
- Figure 26: Europe Electronically Scanned Array Radar Market Revenue (billion), by Production Analysis 2025 & 2033
- Figure 27: Europe Electronically Scanned Array Radar Market Revenue Share (%), by Production Analysis 2025 & 2033
- Figure 28: Europe Electronically Scanned Array Radar Market Revenue (billion), by Consumption Analysis 2025 & 2033
- Figure 29: Europe Electronically Scanned Array Radar Market Revenue Share (%), by Consumption Analysis 2025 & 2033
- Figure 30: Europe Electronically Scanned Array Radar Market Revenue (billion), by Import Market Analysis (Value & Volume) 2025 & 2033
- Figure 31: Europe Electronically Scanned Array Radar Market Revenue Share (%), by Import Market Analysis (Value & Volume) 2025 & 2033
- Figure 32: Europe Electronically Scanned Array Radar Market Revenue (billion), by Export Market Analysis (Value & Volume) 2025 & 2033
- Figure 33: Europe Electronically Scanned Array Radar Market Revenue Share (%), by Export Market Analysis (Value & Volume) 2025 & 2033
- Figure 34: Europe Electronically Scanned Array Radar Market Revenue (billion), by Price Trend Analysis 2025 & 2033
- Figure 35: Europe Electronically Scanned Array Radar Market Revenue Share (%), by Price Trend Analysis 2025 & 2033
- Figure 36: Europe Electronically Scanned Array Radar Market Revenue (billion), by Country 2025 & 2033
- Figure 37: Europe Electronically Scanned Array Radar Market Revenue Share (%), by Country 2025 & 2033
- Figure 38: Middle East & Africa Electronically Scanned Array Radar Market Revenue (billion), by Production Analysis 2025 & 2033
- Figure 39: Middle East & Africa Electronically Scanned Array Radar Market Revenue Share (%), by Production Analysis 2025 & 2033
- Figure 40: Middle East & Africa Electronically Scanned Array Radar Market Revenue (billion), by Consumption Analysis 2025 & 2033
- Figure 41: Middle East & Africa Electronically Scanned Array Radar Market Revenue Share (%), by Consumption Analysis 2025 & 2033
- Figure 42: Middle East & Africa Electronically Scanned Array Radar Market Revenue (billion), by Import Market Analysis (Value & Volume) 2025 & 2033
- Figure 43: Middle East & Africa Electronically Scanned Array Radar Market Revenue Share (%), by Import Market Analysis (Value & Volume) 2025 & 2033
- Figure 44: Middle East & Africa Electronically Scanned Array Radar Market Revenue (billion), by Export Market Analysis (Value & Volume) 2025 & 2033
- Figure 45: Middle East & Africa Electronically Scanned Array Radar Market Revenue Share (%), by Export Market Analysis (Value & Volume) 2025 & 2033
- Figure 46: Middle East & Africa Electronically Scanned Array Radar Market Revenue (billion), by Price Trend Analysis 2025 & 2033
- Figure 47: Middle East & Africa Electronically Scanned Array Radar Market Revenue Share (%), by Price Trend Analysis 2025 & 2033
- Figure 48: Middle East & Africa Electronically Scanned Array Radar Market Revenue (billion), by Country 2025 & 2033
- Figure 49: Middle East & Africa Electronically Scanned Array Radar Market Revenue Share (%), by Country 2025 & 2033
- Figure 50: Asia Pacific Electronically Scanned Array Radar Market Revenue (billion), by Production Analysis 2025 & 2033
- Figure 51: Asia Pacific Electronically Scanned Array Radar Market Revenue Share (%), by Production Analysis 2025 & 2033
- Figure 52: Asia Pacific Electronically Scanned Array Radar Market Revenue (billion), by Consumption Analysis 2025 & 2033
- Figure 53: Asia Pacific Electronically Scanned Array Radar Market Revenue Share (%), by Consumption Analysis 2025 & 2033
- Figure 54: Asia Pacific Electronically Scanned Array Radar Market Revenue (billion), by Import Market Analysis (Value & Volume) 2025 & 2033
- Figure 55: Asia Pacific Electronically Scanned Array Radar Market Revenue Share (%), by Import Market Analysis (Value & Volume) 2025 & 2033
- Figure 56: Asia Pacific Electronically Scanned Array Radar Market Revenue (billion), by Export Market Analysis (Value & Volume) 2025 & 2033
- Figure 57: Asia Pacific Electronically Scanned Array Radar Market Revenue Share (%), by Export Market Analysis (Value & Volume) 2025 & 2033
- Figure 58: Asia Pacific Electronically Scanned Array Radar Market Revenue (billion), by Price Trend Analysis 2025 & 2033
- Figure 59: Asia Pacific Electronically Scanned Array Radar Market Revenue Share (%), by Price Trend Analysis 2025 & 2033
- Figure 60: Asia Pacific Electronically Scanned Array Radar Market Revenue (billion), by Country 2025 & 2033
- Figure 61: Asia Pacific Electronically Scanned Array Radar Market Revenue Share (%), by Country 2025 & 2033
List of Tables
- Table 1: Global Electronically Scanned Array Radar Market Revenue billion Forecast, by Production Analysis 2020 & 2033
- Table 2: Global Electronically Scanned Array Radar Market Revenue billion Forecast, by Consumption Analysis 2020 & 2033
- Table 3: Global Electronically Scanned Array Radar Market Revenue billion Forecast, by Import Market Analysis (Value & Volume) 2020 & 2033
- Table 4: Global Electronically Scanned Array Radar Market Revenue billion Forecast, by Export Market Analysis (Value & Volume) 2020 & 2033
- Table 5: Global Electronically Scanned Array Radar Market Revenue billion Forecast, by Price Trend Analysis 2020 & 2033
- Table 6: Global Electronically Scanned Array Radar Market Revenue billion Forecast, by Region 2020 & 2033
- Table 7: Global Electronically Scanned Array Radar Market Revenue billion Forecast, by Production Analysis 2020 & 2033
- Table 8: Global Electronically Scanned Array Radar Market Revenue billion Forecast, by Consumption Analysis 2020 & 2033
- Table 9: Global Electronically Scanned Array Radar Market Revenue billion Forecast, by Import Market Analysis (Value & Volume) 2020 & 2033
- Table 10: Global Electronically Scanned Array Radar Market Revenue billion Forecast, by Export Market Analysis (Value & Volume) 2020 & 2033
- Table 11: Global Electronically Scanned Array Radar Market Revenue billion Forecast, by Price Trend Analysis 2020 & 2033
- Table 12: Global Electronically Scanned Array Radar Market Revenue billion Forecast, by Country 2020 & 2033
- Table 13: United States Electronically Scanned Array Radar Market Revenue (billion) Forecast, by Application 2020 & 2033
- Table 14: Canada Electronically Scanned Array Radar Market Revenue (billion) Forecast, by Application 2020 & 2033
- Table 15: Mexico Electronically Scanned Array Radar Market Revenue (billion) Forecast, by Application 2020 & 2033
- Table 16: Global Electronically Scanned Array Radar Market Revenue billion Forecast, by Production Analysis 2020 & 2033
- Table 17: Global Electronically Scanned Array Radar Market Revenue billion Forecast, by Consumption Analysis 2020 & 2033
- Table 18: Global Electronically Scanned Array Radar Market Revenue billion Forecast, by Import Market Analysis (Value & Volume) 2020 & 2033
- Table 19: Global Electronically Scanned Array Radar Market Revenue billion Forecast, by Export Market Analysis (Value & Volume) 2020 & 2033
- Table 20: Global Electronically Scanned Array Radar Market Revenue billion Forecast, by Price Trend Analysis 2020 & 2033
- Table 21: Global Electronically Scanned Array Radar Market Revenue billion Forecast, by Country 2020 & 2033
- Table 22: Brazil Electronically Scanned Array Radar Market Revenue (billion) Forecast, by Application 2020 & 2033
- Table 23: Argentina Electronically Scanned Array Radar Market Revenue (billion) Forecast, by Application 2020 & 2033
- Table 24: Rest of South America Electronically Scanned Array Radar Market Revenue (billion) Forecast, by Application 2020 & 2033
- Table 25: Global Electronically Scanned Array Radar Market Revenue billion Forecast, by Production Analysis 2020 & 2033
- Table 26: Global Electronically Scanned Array Radar Market Revenue billion Forecast, by Consumption Analysis 2020 & 2033
- Table 27: Global Electronically Scanned Array Radar Market Revenue billion Forecast, by Import Market Analysis (Value & Volume) 2020 & 2033
- Table 28: Global Electronically Scanned Array Radar Market Revenue billion Forecast, by Export Market Analysis (Value & Volume) 2020 & 2033
- Table 29: Global Electronically Scanned Array Radar Market Revenue billion Forecast, by Price Trend Analysis 2020 & 2033
- Table 30: Global Electronically Scanned Array Radar Market Revenue billion Forecast, by Country 2020 & 2033
- Table 31: United Kingdom Electronically Scanned Array Radar Market Revenue (billion) Forecast, by Application 2020 & 2033
- Table 32: Germany Electronically Scanned Array Radar Market Revenue (billion) Forecast, by Application 2020 & 2033
- Table 33: France Electronically Scanned Array Radar Market Revenue (billion) Forecast, by Application 2020 & 2033
- Table 34: Italy Electronically Scanned Array Radar Market Revenue (billion) Forecast, by Application 2020 & 2033
- Table 35: Spain Electronically Scanned Array Radar Market Revenue (billion) Forecast, by Application 2020 & 2033
- Table 36: Russia Electronically Scanned Array Radar Market Revenue (billion) Forecast, by Application 2020 & 2033
- Table 37: Benelux Electronically Scanned Array Radar Market Revenue (billion) Forecast, by Application 2020 & 2033
- Table 38: Nordics Electronically Scanned Array Radar Market Revenue (billion) Forecast, by Application 2020 & 2033
- Table 39: Rest of Europe Electronically Scanned Array Radar Market Revenue (billion) Forecast, by Application 2020 & 2033
- Table 40: Global Electronically Scanned Array Radar Market Revenue billion Forecast, by Production Analysis 2020 & 2033
- Table 41: Global Electronically Scanned Array Radar Market Revenue billion Forecast, by Consumption Analysis 2020 & 2033
- Table 42: Global Electronically Scanned Array Radar Market Revenue billion Forecast, by Import Market Analysis (Value & Volume) 2020 & 2033
- Table 43: Global Electronically Scanned Array Radar Market Revenue billion Forecast, by Export Market Analysis (Value & Volume) 2020 & 2033
- Table 44: Global Electronically Scanned Array Radar Market Revenue billion Forecast, by Price Trend Analysis 2020 & 2033
- Table 45: Global Electronically Scanned Array Radar Market Revenue billion Forecast, by Country 2020 & 2033
- Table 46: Turkey Electronically Scanned Array Radar Market Revenue (billion) Forecast, by Application 2020 & 2033
- Table 47: Israel Electronically Scanned Array Radar Market Revenue (billion) Forecast, by Application 2020 & 2033
- Table 48: GCC Electronically Scanned Array Radar Market Revenue (billion) Forecast, by Application 2020 & 2033
- Table 49: North Africa Electronically Scanned Array Radar Market Revenue (billion) Forecast, by Application 2020 & 2033
- Table 50: South Africa Electronically Scanned Array Radar Market Revenue (billion) Forecast, by Application 2020 & 2033
- Table 51: Rest of Middle East & Africa Electronically Scanned Array Radar Market Revenue (billion) Forecast, by Application 2020 & 2033
- Table 52: Global Electronically Scanned Array Radar Market Revenue billion Forecast, by Production Analysis 2020 & 2033
- Table 53: Global Electronically Scanned Array Radar Market Revenue billion Forecast, by Consumption Analysis 2020 & 2033
- Table 54: Global Electronically Scanned Array Radar Market Revenue billion Forecast, by Import Market Analysis (Value & Volume) 2020 & 2033
- Table 55: Global Electronically Scanned Array Radar Market Revenue billion Forecast, by Export Market Analysis (Value & Volume) 2020 & 2033
- Table 56: Global Electronically Scanned Array Radar Market Revenue billion Forecast, by Price Trend Analysis 2020 & 2033
- Table 57: Global Electronically Scanned Array Radar Market Revenue billion Forecast, by Country 2020 & 2033
- Table 58: China Electronically Scanned Array Radar Market Revenue (billion) Forecast, by Application 2020 & 2033
- Table 59: India Electronically Scanned Array Radar Market Revenue (billion) Forecast, by Application 2020 & 2033
- Table 60: Japan Electronically Scanned Array Radar Market Revenue (billion) Forecast, by Application 2020 & 2033
- Table 61: South Korea Electronically Scanned Array Radar Market Revenue (billion) Forecast, by Application 2020 & 2033
- Table 62: ASEAN Electronically Scanned Array Radar Market Revenue (billion) Forecast, by Application 2020 & 2033
- Table 63: Oceania Electronically Scanned Array Radar Market Revenue (billion) Forecast, by Application 2020 & 2033
- Table 64: Rest of Asia Pacific Electronically Scanned Array Radar Market Revenue (billion) Forecast, by Application 2020 & 2033
Frequently Asked Questions
1. What is the projected Compound Annual Growth Rate (CAGR) of the Electronically Scanned Array Radar Market?
The projected CAGR is approximately 9.7%.
2. Which companies are prominent players in the Electronically Scanned Array Radar Market?
Key companies in the market include Raytheon Technologies Corporation, THALES, Leonardo SpA, Lockheed Martin Corporation, Hensoldt AG, RADA Electronic Industries Ltd, Mitsubishi Electric Corporation, Israel Aerospace Industries, ASELSAN A, CEA Technologies, Northrop Grumman Corporation, Saab AB.
3. What are the main segments of the Electronically Scanned Array Radar Market?
The market segments include Production Analysis, Consumption Analysis, Import Market Analysis (Value & Volume), Export Market Analysis (Value & Volume), Price Trend Analysis.
4. Can you provide details about the market size?
The market size is estimated to be USD 12.35 billion as of 2022.
5. What are some drivers contributing to market growth?
; Increasing Number Of Air Passengers; Use Of Portable Electronic Devices.
6. What are the notable trends driving market growth?
Active Electronically Scanned Array Segment to Dominate the Market During the Forecast Period.
7. Are there any restraints impacting market growth?
; High Cost Of Connectivity Equipments.
8. Can you provide examples of recent developments in the market?
In March 2023, The Indian Ministry of Defence (MoD) signed two contracts worth USD448.44m with the government-owned aerospace and defense electronics company Bharat Electronics Limited (BEL) to provide radar and warning receivers for Indian Air Force.
9. What pricing options are available for accessing the report?
Pricing options include single-user, multi-user, and enterprise licenses priced at USD 4750, USD 5250, and USD 8750 respectively.
10. Is the market size provided in terms of value or volume?
The market size is provided in terms of value, measured in billion.
11. Are there any specific market keywords associated with the report?
Yes, the market keyword associated with the report is "Electronically Scanned Array Radar Market," which aids in identifying and referencing the specific market segment covered.
12. How do I determine which pricing option suits my needs best?
The pricing options vary based on user requirements and access needs. Individual users may opt for single-user licenses, while businesses requiring broader access may choose multi-user or enterprise licenses for cost-effective access to the report.
13. Are there any additional resources or data provided in the Electronically Scanned Array Radar Market report?
While the report offers comprehensive insights, it's advisable to review the specific contents or supplementary materials provided to ascertain if additional resources or data are available.
14. How can I stay updated on further developments or reports in the Electronically Scanned Array Radar Market?
To stay informed about further developments, trends, and reports in the Electronically Scanned Array Radar Market, consider subscribing to industry newsletters, following relevant companies and organizations, or regularly checking reputable industry news sources and publications.
Methodology
Step 1 - Identification of Relevant Samples Size from Population Database


Step 2 - Approaches for Defining Global Market Size (Value, Volume* & Price*)

Note*: In applicable scenarios
Step 3 - Data Sources
Primary Research
- Web Analytics
- Survey Reports
- Research Institute
- Latest Research Reports
- Opinion Leaders
Secondary Research
- Annual Reports
- White Paper
- Latest Press Release
- Industry Association
- Paid Database
- Investor Presentations

Step 4 - Data Triangulation
Involves using different sources of information in order to increase the validity of a study
These sources are likely to be stakeholders in a program - participants, other researchers, program staff, other community members, and so on.
Then we put all data in single framework & apply various statistical tools to find out the dynamic on the market.
During the analysis stage, feedback from the stakeholder groups would be compared to determine areas of agreement as well as areas of divergence