

Key Insights
The global Employee Discounts Scheme market is projected to expand significantly, reaching an estimated $4.81 billion by 2025, with a Compound Annual Growth Rate (CAGR) of 10.6%. This robust growth is driven by increasing organizational recognition of employee well-being and satisfaction as key drivers of productivity and retention. In a competitive talent market, companies are adopting cost-effective benefits like discount programs to enhance employee morale and loyalty, offering tangible savings and contributing to a positive work environment. The proliferation of digital platforms and mobile applications further enhances the accessibility and appeal of these schemes.
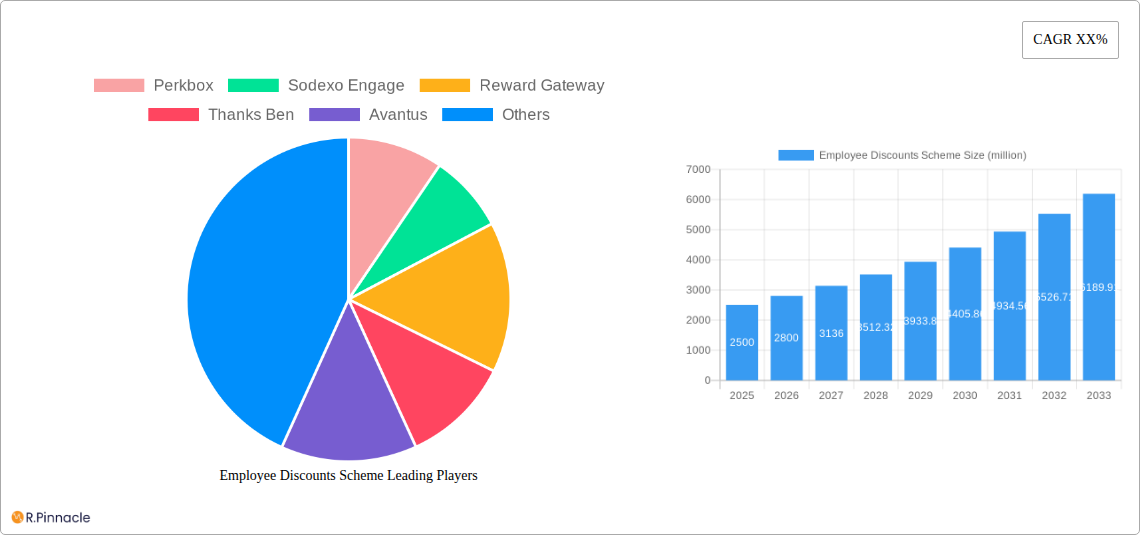
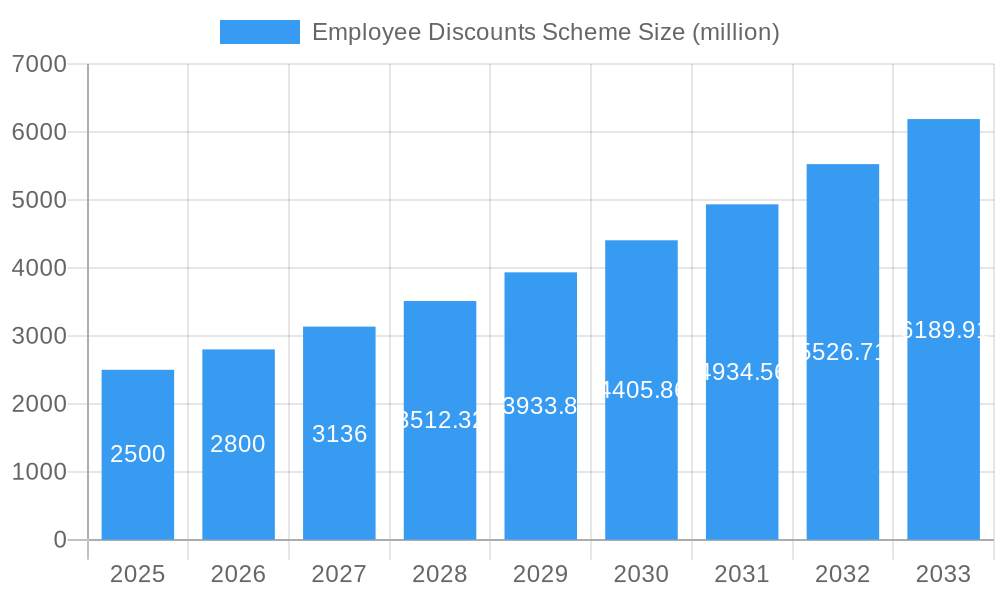
Employee Discounts Scheme Market Size (In Billion)
The market encompasses diverse applications and types, serving both Small and Medium-sized Enterprises (SMEs) and Large Enterprises. While traditional cash and shopping card discounts remain prevalent, there is a growing demand for specialized offerings such as holiday and leisure discounts, aligning with broader employee engagement and work-life balance initiatives. Key market players, including Sodexo Engage, Reward Gateway, and Blackhawk Network, are driving innovation through tailored solutions and advanced technologies. North America and Europe currently lead the market due to established employee benefit cultures, while the Asia Pacific region is emerging as a high-growth market fueled by economic development and increased demand for comprehensive engagement strategies. Initial implementation costs and the need for continuous program updates are being mitigated by the adoption of flexible and scalable digital solutions.
Employee Discounts Scheme Company Market Share
This report offers an in-depth analysis of the global Employee Discounts Scheme market, a vital element of modern HR and employee engagement strategies. Covering the historical period of 2019–2024 and projecting to 2033, with a base year of 2025, this study provides critical insights for industry professionals, HR leaders, and strategic decision-makers focused on leveraging employee benefits to improve productivity and retention.
Employee Discounts Scheme Market Structure & Innovation Trends
The global Employee Discounts Scheme market exhibits a dynamic structure, characterized by a moderate level of concentration with several key players vying for market share. Innovation remains a primary driver, fueled by the increasing demand for personalized and flexible employee benefit programs. Leading companies are investing heavily in digital platforms, AI-driven personalization, and integrated wellness solutions. Regulatory frameworks are evolving to support data privacy and fair benefit provision, influencing scheme design and implementation. Product substitutes, while present in the form of ad-hoc perks, are generally outmaneuvered by the structured value proposition of dedicated discount schemes. End-user demographics span across all employee levels, with a growing emphasis on catering to the diverse needs of a multi-generational workforce. Mergers and acquisitions (M&A) are a significant feature of the market landscape, with strategic consolidations aimed at expanding service offerings and geographic reach. Recent M&A deal values are estimated to be in the billions of dollars, reflecting the increasing strategic importance of this sector. Market share is distributed among a mix of large established players and agile niche providers, with the top ten companies holding approximately 60% of the market share.
Employee Discounts Scheme Market Dynamics & Trends
The Employee Discounts Scheme market is experiencing robust growth, driven by a confluence of economic, technological, and societal factors. The increasing recognition of employee well-being as a strategic imperative for business success is a primary growth driver. Companies are actively seeking ways to attract and retain top talent in a competitive labor market, and comprehensive discount schemes are proving to be an effective tool. Technological disruptions, particularly the advent of sophisticated digital platforms and mobile applications, have revolutionized the delivery and accessibility of these schemes. This has led to a significant enhancement in user experience and the ability to offer real-time, personalized discounts. Consumer preferences are shifting towards experiential benefits and savings on everyday essentials, pushing providers to diversify their offerings beyond traditional retail discounts. This includes a growing demand for discounts on travel, leisure activities, health and wellness services, and educational opportunities. Competitive dynamics are intense, with providers differentiating themselves through unique partnerships, innovative features, and superior customer service. The market penetration of employee discount schemes is steadily increasing, with an estimated CAGR of 12.5% expected over the forecast period. Companies are increasingly integrating these schemes into their broader employee engagement and total rewards strategies, recognizing their substantial impact on employee morale and organizational culture. The average market penetration for large enterprises is estimated to be around 75%, while SMEs are showing a rapid adoption rate, reaching approximately 40% in the base year and projected to grow significantly.
Dominant Regions & Segments in Employee Discounts Scheme
North America currently dominates the Employee Discounts Scheme market, driven by a mature economy, a strong emphasis on employee welfare, and high adoption rates of technology. Within North America, the United States leads, supported by robust corporate investment in HR technology and a diverse business landscape. The segment of Large Enterprises is the most dominant application, accounting for an estimated 70% of the market value. This is attributed to their substantial employee bases, larger budgets for benefits, and a greater need for scalable and comprehensive solutions. Key drivers for this dominance include the ability of large enterprises to negotiate bulk discounts, implement sophisticated integration with HRIS systems, and the regulatory pressures that encourage robust employee benefits.
The Shopping Card type of discount scheme holds a significant share, valued at over $10 million, due to its broad appeal and direct impact on employee savings for everyday purchases. This type is particularly popular across all segments due to its tangibility and ease of use. Economic policies that support consumer spending and the widespread availability of retail partnerships further bolster its position.
Employee Discounts Scheme Product Innovations
Product innovations in the Employee Discounts Scheme sector are primarily focused on personalization and integration. Companies are leveraging AI and data analytics to offer highly tailored discount recommendations based on individual employee preferences and spending habits. Mobile-first platforms are becoming standard, providing seamless access to discounts on-the-go. Integration with existing HR systems and payroll providers is enhancing efficiency and user experience. Competitive advantages are being gained through exclusive partnerships with brands, gamified reward structures, and features that promote employee well-being and financial literacy.
Report Scope & Segmentation Analysis
The Employee Discounts Scheme market is segmented across various applications and types to cater to diverse business needs.
- Application: SMEs: This segment, representing approximately 25% of the market, is experiencing rapid growth. SMEs are increasingly recognizing the value of employee discounts for talent attraction and retention, often seeking cost-effective and easily implementable solutions. Growth projections for SMEs are around 15% CAGR.
- Application: Large Enterprises: This segment, holding approximately 75% of the market, continues to be the largest. Large enterprises demand comprehensive, scalable, and customizable solutions that integrate seamlessly with their existing HR infrastructure. Growth in this segment is projected at 10% CAGR.
- Type: Cash: While a straightforward option, cash-back schemes are often integrated into broader reward platforms. This segment contributes to the overall market value by offering direct financial savings.
- Type: Shopping Card: This is a highly popular segment, expected to grow at a CAGR of 13%, due to its wide applicability and direct impact on employee spending power.
- Type: Holiday: Schemes offering discounts on travel and leisure are gaining traction as employees prioritize work-life balance. This segment is poised for significant expansion.
- Type: Other: This broad category includes discounts on health and wellness, education, and various lifestyle services, reflecting the evolving needs of the workforce. This segment is projected to grow at 14% CAGR.
Key Drivers of Employee Discounts Scheme Growth
The growth of the Employee Discounts Scheme market is propelled by several interconnected factors. Technological advancements in digital platforms and mobile accessibility have made these schemes more user-friendly and pervasive. The increasing focus on employee well-being and mental health by organizations is a significant driver, as discount schemes contribute to reduced financial stress and enhanced quality of life. Economic policies that stimulate consumer spending indirectly benefit the discount scheme market. Furthermore, the growing awareness among SMEs about the importance of talent acquisition and retention in a competitive job market is pushing them to adopt these beneficial programs.
Challenges in the Employee Discounts Scheme Sector
Despite its promising growth, the Employee Discounts Scheme sector faces several challenges. Regulatory hurdles, particularly concerning data privacy and compliance with varying regional employment laws, can complicate scheme implementation. Supply chain issues and the ability of providers to secure consistent and attractive discounts from a diverse range of merchants can impact the value proposition. Competitive pressures from a crowded market necessitate continuous innovation and differentiation, which can be resource-intensive. The perceived complexity of some advanced platforms can also be a barrier to adoption for smaller businesses.
Emerging Opportunities in Employee Discounts Scheme
Emerging opportunities in the Employee Discounts Scheme market are abundant, driven by evolving employee expectations and technological capabilities. The expansion into new geographic markets with growing disposable incomes presents a significant avenue for growth. The increasing demand for personalized and holistic wellness programs offers opportunities to integrate discounts on fitness, mental health services, and healthy lifestyle choices. The rise of the gig economy creates a need for flexible discount solutions catering to a contingent workforce. Furthermore, the development of AI-powered recommendation engines will further enhance the relevance and value of discount schemes for individual employees.
Leading Players in the Employee Discounts Scheme Market
- Perkbox
- Sodexo Engage
- Reward Gateway
- Thanks Ben
- Avantus
- Edenred Savings
- Staff Treats
- HighStreetVouchers
- Caboodle
- Drewberry
- People Value
- Blackhawk Network
- perkpal
- Hapi
- LifeWorks
- Xexec
- Petaurum Solutions
- Vivup
- Digital Perks
- Openreach
- Harrods
Key Developments in Employee Discounts Scheme Industry
- 2023/04: Reward Gateway acquires benefit platform provider, expanding its service portfolio and market reach.
- 2023/07: Sodexo Engage launches AI-powered personalized discount recommendations, enhancing user engagement.
- 2024/01: Thanks Ben partners with a leading grocery retailer to offer exclusive discounts, increasing its appeal to a wider audience.
- 2024/03: LifeWorks integrates new financial wellness tools into its discount platform, addressing a growing employee need.
- 2024/06: Vivup announces expansion into the education sector, offering discounts on professional development courses.
Future Outlook for Employee Discounts Scheme Market
The future outlook for the Employee Discounts Scheme market is exceptionally bright, poised for continued substantial growth. The increasing recognition of employee benefits as a critical component of a strong employer brand will drive further adoption across all business sizes. Technological advancements, particularly in personalization and AI, will create more engaging and impactful discount experiences. The ongoing focus on employee well-being and financial security will further cement the role of discount schemes as an indispensable tool for organizations aiming to cultivate a motivated and loyal workforce. Strategic partnerships and innovative service offerings will be key to navigating the evolving competitive landscape and capturing future market potential, with an estimated market size of over $20 million by 2033.
Employee Discounts Scheme Segmentation
-
1. Application
- 1.1. SMEs
- 1.2. Large Enterprises
-
2. Types
- 2.1. Cash
- 2.2. Shopping Card
- 2.3. Holiday
- 2.4. Other
Employee Discounts Scheme Segmentation By Geography
-
1. North America
- 1.1. United States
- 1.2. Canada
- 1.3. Mexico
-
2. South America
- 2.1. Brazil
- 2.2. Argentina
- 2.3. Rest of South America
-
3. Europe
- 3.1. United Kingdom
- 3.2. Germany
- 3.3. France
- 3.4. Italy
- 3.5. Spain
- 3.6. Russia
- 3.7. Benelux
- 3.8. Nordics
- 3.9. Rest of Europe
-
4. Middle East & Africa
- 4.1. Turkey
- 4.2. Israel
- 4.3. GCC
- 4.4. North Africa
- 4.5. South Africa
- 4.6. Rest of Middle East & Africa
-
5. Asia Pacific
- 5.1. China
- 5.2. India
- 5.3. Japan
- 5.4. South Korea
- 5.5. ASEAN
- 5.6. Oceania
- 5.7. Rest of Asia Pacific
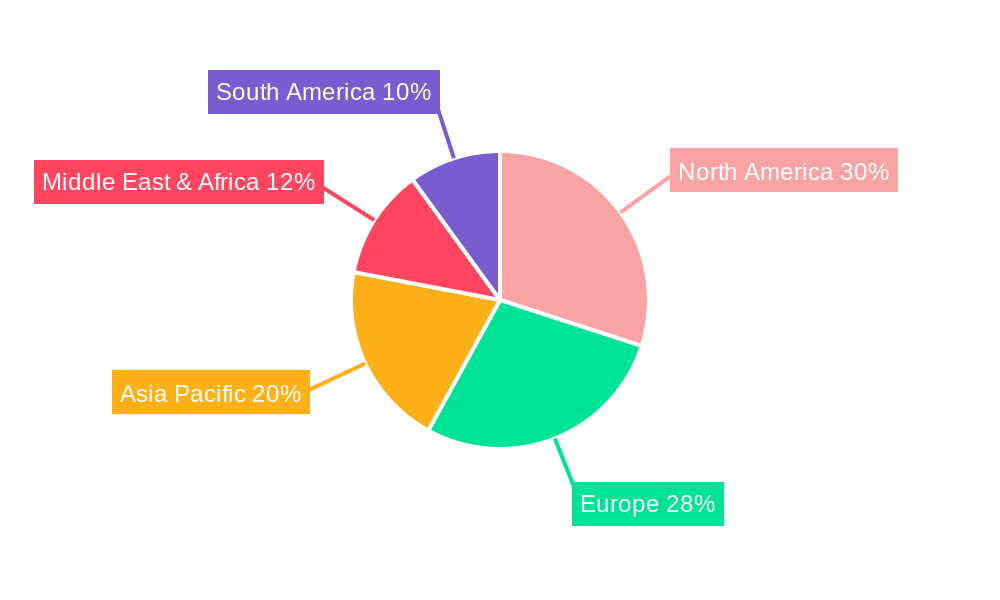
Employee Discounts Scheme Regional Market Share
Geographic Coverage of Employee Discounts Scheme
Employee Discounts Scheme REPORT HIGHLIGHTS
| Aspects | Details |
|---|---|
| Study Period | 2020-2034 |
| Base Year | 2025 |
| Estimated Year | 2026 |
| Forecast Period | 2026-2034 |
| Historical Period | 2020-2025 |
| Growth Rate | CAGR of 10.6% from 2020-2034 |
| Segmentation |
|
Table of Contents
- 1. Introduction
- 1.1. Research Scope
- 1.2. Market Segmentation
- 1.3. Research Methodology
- 1.4. Definitions and Assumptions
- 2. Executive Summary
- 2.1. Introduction
- 3. Market Dynamics
- 3.1. Introduction
- 3.2. Market Drivers
- 3.3. Market Restrains
- 3.4. Market Trends
- 4. Market Factor Analysis
- 4.1. Porters Five Forces
- 4.2. Supply/Value Chain
- 4.3. PESTEL analysis
- 4.4. Market Entropy
- 4.5. Patent/Trademark Analysis
- 5. Global Employee Discounts Scheme Analysis, Insights and Forecast, 2020-2032
- 5.1. Market Analysis, Insights and Forecast - by Application
- 5.1.1. SMEs
- 5.1.2. Large Enterprises
- 5.2. Market Analysis, Insights and Forecast - by Types
- 5.2.1. Cash
- 5.2.2. Shopping Card
- 5.2.3. Holiday
- 5.2.4. Other
- 5.3. Market Analysis, Insights and Forecast - by Region
- 5.3.1. North America
- 5.3.2. South America
- 5.3.3. Europe
- 5.3.4. Middle East & Africa
- 5.3.5. Asia Pacific
- 5.1. Market Analysis, Insights and Forecast - by Application
- 6. North America Employee Discounts Scheme Analysis, Insights and Forecast, 2020-2032
- 6.1. Market Analysis, Insights and Forecast - by Application
- 6.1.1. SMEs
- 6.1.2. Large Enterprises
- 6.2. Market Analysis, Insights and Forecast - by Types
- 6.2.1. Cash
- 6.2.2. Shopping Card
- 6.2.3. Holiday
- 6.2.4. Other
- 6.1. Market Analysis, Insights and Forecast - by Application
- 7. South America Employee Discounts Scheme Analysis, Insights and Forecast, 2020-2032
- 7.1. Market Analysis, Insights and Forecast - by Application
- 7.1.1. SMEs
- 7.1.2. Large Enterprises
- 7.2. Market Analysis, Insights and Forecast - by Types
- 7.2.1. Cash
- 7.2.2. Shopping Card
- 7.2.3. Holiday
- 7.2.4. Other
- 7.1. Market Analysis, Insights and Forecast - by Application
- 8. Europe Employee Discounts Scheme Analysis, Insights and Forecast, 2020-2032
- 8.1. Market Analysis, Insights and Forecast - by Application
- 8.1.1. SMEs
- 8.1.2. Large Enterprises
- 8.2. Market Analysis, Insights and Forecast - by Types
- 8.2.1. Cash
- 8.2.2. Shopping Card
- 8.2.3. Holiday
- 8.2.4. Other
- 8.1. Market Analysis, Insights and Forecast - by Application
- 9. Middle East & Africa Employee Discounts Scheme Analysis, Insights and Forecast, 2020-2032
- 9.1. Market Analysis, Insights and Forecast - by Application
- 9.1.1. SMEs
- 9.1.2. Large Enterprises
- 9.2. Market Analysis, Insights and Forecast - by Types
- 9.2.1. Cash
- 9.2.2. Shopping Card
- 9.2.3. Holiday
- 9.2.4. Other
- 9.1. Market Analysis, Insights and Forecast - by Application
- 10. Asia Pacific Employee Discounts Scheme Analysis, Insights and Forecast, 2020-2032
- 10.1. Market Analysis, Insights and Forecast - by Application
- 10.1.1. SMEs
- 10.1.2. Large Enterprises
- 10.2. Market Analysis, Insights and Forecast - by Types
- 10.2.1. Cash
- 10.2.2. Shopping Card
- 10.2.3. Holiday
- 10.2.4. Other
- 10.1. Market Analysis, Insights and Forecast - by Application
- 11. Competitive Analysis
- 11.1. Global Market Share Analysis 2025
- 11.2. Company Profiles
- 11.2.1 Perkbox
- 11.2.1.1. Overview
- 11.2.1.2. Products
- 11.2.1.3. SWOT Analysis
- 11.2.1.4. Recent Developments
- 11.2.1.5. Financials (Based on Availability)
- 11.2.2 Sodexo Engage
- 11.2.2.1. Overview
- 11.2.2.2. Products
- 11.2.2.3. SWOT Analysis
- 11.2.2.4. Recent Developments
- 11.2.2.5. Financials (Based on Availability)
- 11.2.3 Reward Gateway
- 11.2.3.1. Overview
- 11.2.3.2. Products
- 11.2.3.3. SWOT Analysis
- 11.2.3.4. Recent Developments
- 11.2.3.5. Financials (Based on Availability)
- 11.2.4 Thanks Ben
- 11.2.4.1. Overview
- 11.2.4.2. Products
- 11.2.4.3. SWOT Analysis
- 11.2.4.4. Recent Developments
- 11.2.4.5. Financials (Based on Availability)
- 11.2.5 Avantus
- 11.2.5.1. Overview
- 11.2.5.2. Products
- 11.2.5.3. SWOT Analysis
- 11.2.5.4. Recent Developments
- 11.2.5.5. Financials (Based on Availability)
- 11.2.6 Edenred Savings
- 11.2.6.1. Overview
- 11.2.6.2. Products
- 11.2.6.3. SWOT Analysis
- 11.2.6.4. Recent Developments
- 11.2.6.5. Financials (Based on Availability)
- 11.2.7 Staff Treats
- 11.2.7.1. Overview
- 11.2.7.2. Products
- 11.2.7.3. SWOT Analysis
- 11.2.7.4. Recent Developments
- 11.2.7.5. Financials (Based on Availability)
- 11.2.8 HighStreetVouchers
- 11.2.8.1. Overview
- 11.2.8.2. Products
- 11.2.8.3. SWOT Analysis
- 11.2.8.4. Recent Developments
- 11.2.8.5. Financials (Based on Availability)
- 11.2.9 Caboodle
- 11.2.9.1. Overview
- 11.2.9.2. Products
- 11.2.9.3. SWOT Analysis
- 11.2.9.4. Recent Developments
- 11.2.9.5. Financials (Based on Availability)
- 11.2.10 Drewberry
- 11.2.10.1. Overview
- 11.2.10.2. Products
- 11.2.10.3. SWOT Analysis
- 11.2.10.4. Recent Developments
- 11.2.10.5. Financials (Based on Availability)
- 11.2.11 People Value
- 11.2.11.1. Overview
- 11.2.11.2. Products
- 11.2.11.3. SWOT Analysis
- 11.2.11.4. Recent Developments
- 11.2.11.5. Financials (Based on Availability)
- 11.2.12 Blackhawk Network
- 11.2.12.1. Overview
- 11.2.12.2. Products
- 11.2.12.3. SWOT Analysis
- 11.2.12.4. Recent Developments
- 11.2.12.5. Financials (Based on Availability)
- 11.2.13 perkpal
- 11.2.13.1. Overview
- 11.2.13.2. Products
- 11.2.13.3. SWOT Analysis
- 11.2.13.4. Recent Developments
- 11.2.13.5. Financials (Based on Availability)
- 11.2.14 Hapi
- 11.2.14.1. Overview
- 11.2.14.2. Products
- 11.2.14.3. SWOT Analysis
- 11.2.14.4. Recent Developments
- 11.2.14.5. Financials (Based on Availability)
- 11.2.15 LifeWorks
- 11.2.15.1. Overview
- 11.2.15.2. Products
- 11.2.15.3. SWOT Analysis
- 11.2.15.4. Recent Developments
- 11.2.15.5. Financials (Based on Availability)
- 11.2.16 Xexec
- 11.2.16.1. Overview
- 11.2.16.2. Products
- 11.2.16.3. SWOT Analysis
- 11.2.16.4. Recent Developments
- 11.2.16.5. Financials (Based on Availability)
- 11.2.17 PetaurumSolutions
- 11.2.17.1. Overview
- 11.2.17.2. Products
- 11.2.17.3. SWOT Analysis
- 11.2.17.4. Recent Developments
- 11.2.17.5. Financials (Based on Availability)
- 11.2.18 Vivup
- 11.2.18.1. Overview
- 11.2.18.2. Products
- 11.2.18.3. SWOT Analysis
- 11.2.18.4. Recent Developments
- 11.2.18.5. Financials (Based on Availability)
- 11.2.19 DigitalPerks
- 11.2.19.1. Overview
- 11.2.19.2. Products
- 11.2.19.3. SWOT Analysis
- 11.2.19.4. Recent Developments
- 11.2.19.5. Financials (Based on Availability)
- 11.2.20 Openreach
- 11.2.20.1. Overview
- 11.2.20.2. Products
- 11.2.20.3. SWOT Analysis
- 11.2.20.4. Recent Developments
- 11.2.20.5. Financials (Based on Availability)
- 11.2.21 Harrods
- 11.2.21.1. Overview
- 11.2.21.2. Products
- 11.2.21.3. SWOT Analysis
- 11.2.21.4. Recent Developments
- 11.2.21.5. Financials (Based on Availability)
- 11.2.1 Perkbox
List of Figures
- Figure 1: Global Employee Discounts Scheme Revenue Breakdown (billion, %) by Region 2025 & 2033
- Figure 2: North America Employee Discounts Scheme Revenue (billion), by Application 2025 & 2033
- Figure 3: North America Employee Discounts Scheme Revenue Share (%), by Application 2025 & 2033
- Figure 4: North America Employee Discounts Scheme Revenue (billion), by Types 2025 & 2033
- Figure 5: North America Employee Discounts Scheme Revenue Share (%), by Types 2025 & 2033
- Figure 6: North America Employee Discounts Scheme Revenue (billion), by Country 2025 & 2033
- Figure 7: North America Employee Discounts Scheme Revenue Share (%), by Country 2025 & 2033
- Figure 8: South America Employee Discounts Scheme Revenue (billion), by Application 2025 & 2033
- Figure 9: South America Employee Discounts Scheme Revenue Share (%), by Application 2025 & 2033
- Figure 10: South America Employee Discounts Scheme Revenue (billion), by Types 2025 & 2033
- Figure 11: South America Employee Discounts Scheme Revenue Share (%), by Types 2025 & 2033
- Figure 12: South America Employee Discounts Scheme Revenue (billion), by Country 2025 & 2033
- Figure 13: South America Employee Discounts Scheme Revenue Share (%), by Country 2025 & 2033
- Figure 14: Europe Employee Discounts Scheme Revenue (billion), by Application 2025 & 2033
- Figure 15: Europe Employee Discounts Scheme Revenue Share (%), by Application 2025 & 2033
- Figure 16: Europe Employee Discounts Scheme Revenue (billion), by Types 2025 & 2033
- Figure 17: Europe Employee Discounts Scheme Revenue Share (%), by Types 2025 & 2033
- Figure 18: Europe Employee Discounts Scheme Revenue (billion), by Country 2025 & 2033
- Figure 19: Europe Employee Discounts Scheme Revenue Share (%), by Country 2025 & 2033
- Figure 20: Middle East & Africa Employee Discounts Scheme Revenue (billion), by Application 2025 & 2033
- Figure 21: Middle East & Africa Employee Discounts Scheme Revenue Share (%), by Application 2025 & 2033
- Figure 22: Middle East & Africa Employee Discounts Scheme Revenue (billion), by Types 2025 & 2033
- Figure 23: Middle East & Africa Employee Discounts Scheme Revenue Share (%), by Types 2025 & 2033
- Figure 24: Middle East & Africa Employee Discounts Scheme Revenue (billion), by Country 2025 & 2033
- Figure 25: Middle East & Africa Employee Discounts Scheme Revenue Share (%), by Country 2025 & 2033
- Figure 26: Asia Pacific Employee Discounts Scheme Revenue (billion), by Application 2025 & 2033
- Figure 27: Asia Pacific Employee Discounts Scheme Revenue Share (%), by Application 2025 & 2033
- Figure 28: Asia Pacific Employee Discounts Scheme Revenue (billion), by Types 2025 & 2033
- Figure 29: Asia Pacific Employee Discounts Scheme Revenue Share (%), by Types 2025 & 2033
- Figure 30: Asia Pacific Employee Discounts Scheme Revenue (billion), by Country 2025 & 2033
- Figure 31: Asia Pacific Employee Discounts Scheme Revenue Share (%), by Country 2025 & 2033
List of Tables
- Table 1: Global Employee Discounts Scheme Revenue billion Forecast, by Application 2020 & 2033
- Table 2: Global Employee Discounts Scheme Revenue billion Forecast, by Types 2020 & 2033
- Table 3: Global Employee Discounts Scheme Revenue billion Forecast, by Region 2020 & 2033
- Table 4: Global Employee Discounts Scheme Revenue billion Forecast, by Application 2020 & 2033
- Table 5: Global Employee Discounts Scheme Revenue billion Forecast, by Types 2020 & 2033
- Table 6: Global Employee Discounts Scheme Revenue billion Forecast, by Country 2020 & 2033
- Table 7: United States Employee Discounts Scheme Revenue (billion) Forecast, by Application 2020 & 2033
- Table 8: Canada Employee Discounts Scheme Revenue (billion) Forecast, by Application 2020 & 2033
- Table 9: Mexico Employee Discounts Scheme Revenue (billion) Forecast, by Application 2020 & 2033
- Table 10: Global Employee Discounts Scheme Revenue billion Forecast, by Application 2020 & 2033
- Table 11: Global Employee Discounts Scheme Revenue billion Forecast, by Types 2020 & 2033
- Table 12: Global Employee Discounts Scheme Revenue billion Forecast, by Country 2020 & 2033
- Table 13: Brazil Employee Discounts Scheme Revenue (billion) Forecast, by Application 2020 & 2033
- Table 14: Argentina Employee Discounts Scheme Revenue (billion) Forecast, by Application 2020 & 2033
- Table 15: Rest of South America Employee Discounts Scheme Revenue (billion) Forecast, by Application 2020 & 2033
- Table 16: Global Employee Discounts Scheme Revenue billion Forecast, by Application 2020 & 2033
- Table 17: Global Employee Discounts Scheme Revenue billion Forecast, by Types 2020 & 2033
- Table 18: Global Employee Discounts Scheme Revenue billion Forecast, by Country 2020 & 2033
- Table 19: United Kingdom Employee Discounts Scheme Revenue (billion) Forecast, by Application 2020 & 2033
- Table 20: Germany Employee Discounts Scheme Revenue (billion) Forecast, by Application 2020 & 2033
- Table 21: France Employee Discounts Scheme Revenue (billion) Forecast, by Application 2020 & 2033
- Table 22: Italy Employee Discounts Scheme Revenue (billion) Forecast, by Application 2020 & 2033
- Table 23: Spain Employee Discounts Scheme Revenue (billion) Forecast, by Application 2020 & 2033
- Table 24: Russia Employee Discounts Scheme Revenue (billion) Forecast, by Application 2020 & 2033
- Table 25: Benelux Employee Discounts Scheme Revenue (billion) Forecast, by Application 2020 & 2033
- Table 26: Nordics Employee Discounts Scheme Revenue (billion) Forecast, by Application 2020 & 2033
- Table 27: Rest of Europe Employee Discounts Scheme Revenue (billion) Forecast, by Application 2020 & 2033
- Table 28: Global Employee Discounts Scheme Revenue billion Forecast, by Application 2020 & 2033
- Table 29: Global Employee Discounts Scheme Revenue billion Forecast, by Types 2020 & 2033
- Table 30: Global Employee Discounts Scheme Revenue billion Forecast, by Country 2020 & 2033
- Table 31: Turkey Employee Discounts Scheme Revenue (billion) Forecast, by Application 2020 & 2033
- Table 32: Israel Employee Discounts Scheme Revenue (billion) Forecast, by Application 2020 & 2033
- Table 33: GCC Employee Discounts Scheme Revenue (billion) Forecast, by Application 2020 & 2033
- Table 34: North Africa Employee Discounts Scheme Revenue (billion) Forecast, by Application 2020 & 2033
- Table 35: South Africa Employee Discounts Scheme Revenue (billion) Forecast, by Application 2020 & 2033
- Table 36: Rest of Middle East & Africa Employee Discounts Scheme Revenue (billion) Forecast, by Application 2020 & 2033
- Table 37: Global Employee Discounts Scheme Revenue billion Forecast, by Application 2020 & 2033
- Table 38: Global Employee Discounts Scheme Revenue billion Forecast, by Types 2020 & 2033
- Table 39: Global Employee Discounts Scheme Revenue billion Forecast, by Country 2020 & 2033
- Table 40: China Employee Discounts Scheme Revenue (billion) Forecast, by Application 2020 & 2033
- Table 41: India Employee Discounts Scheme Revenue (billion) Forecast, by Application 2020 & 2033
- Table 42: Japan Employee Discounts Scheme Revenue (billion) Forecast, by Application 2020 & 2033
- Table 43: South Korea Employee Discounts Scheme Revenue (billion) Forecast, by Application 2020 & 2033
- Table 44: ASEAN Employee Discounts Scheme Revenue (billion) Forecast, by Application 2020 & 2033
- Table 45: Oceania Employee Discounts Scheme Revenue (billion) Forecast, by Application 2020 & 2033
- Table 46: Rest of Asia Pacific Employee Discounts Scheme Revenue (billion) Forecast, by Application 2020 & 2033
Frequently Asked Questions
1. What is the projected Compound Annual Growth Rate (CAGR) of the Employee Discounts Scheme?
The projected CAGR is approximately 10.6%.
2. Which companies are prominent players in the Employee Discounts Scheme?
Key companies in the market include Perkbox, Sodexo Engage, Reward Gateway, Thanks Ben, Avantus, Edenred Savings, Staff Treats, HighStreetVouchers, Caboodle, Drewberry, People Value, Blackhawk Network, perkpal, Hapi, LifeWorks, Xexec, PetaurumSolutions, Vivup, DigitalPerks, Openreach, Harrods.
3. What are the main segments of the Employee Discounts Scheme?
The market segments include Application, Types.
4. Can you provide details about the market size?
The market size is estimated to be USD 4.81 billion as of 2022.
5. What are some drivers contributing to market growth?
N/A
6. What are the notable trends driving market growth?
N/A
7. Are there any restraints impacting market growth?
N/A
8. Can you provide examples of recent developments in the market?
N/A
9. What pricing options are available for accessing the report?
Pricing options include single-user, multi-user, and enterprise licenses priced at USD 4900.00, USD 7350.00, and USD 9800.00 respectively.
10. Is the market size provided in terms of value or volume?
The market size is provided in terms of value, measured in billion.
11. Are there any specific market keywords associated with the report?
Yes, the market keyword associated with the report is "Employee Discounts Scheme," which aids in identifying and referencing the specific market segment covered.
12. How do I determine which pricing option suits my needs best?
The pricing options vary based on user requirements and access needs. Individual users may opt for single-user licenses, while businesses requiring broader access may choose multi-user or enterprise licenses for cost-effective access to the report.
13. Are there any additional resources or data provided in the Employee Discounts Scheme report?
While the report offers comprehensive insights, it's advisable to review the specific contents or supplementary materials provided to ascertain if additional resources or data are available.
14. How can I stay updated on further developments or reports in the Employee Discounts Scheme?
To stay informed about further developments, trends, and reports in the Employee Discounts Scheme, consider subscribing to industry newsletters, following relevant companies and organizations, or regularly checking reputable industry news sources and publications.
Methodology
Step 1 - Identification of Relevant Samples Size from Population Database


Step 2 - Approaches for Defining Global Market Size (Value, Volume* & Price*)

Note*: In applicable scenarios
Step 3 - Data Sources
Primary Research
- Web Analytics
- Survey Reports
- Research Institute
- Latest Research Reports
- Opinion Leaders
Secondary Research
- Annual Reports
- White Paper
- Latest Press Release
- Industry Association
- Paid Database
- Investor Presentations

Step 4 - Data Triangulation
Involves using different sources of information in order to increase the validity of a study
These sources are likely to be stakeholders in a program - participants, other researchers, program staff, other community members, and so on.
Then we put all data in single framework & apply various statistical tools to find out the dynamic on the market.
During the analysis stage, feedback from the stakeholder groups would be compared to determine areas of agreement as well as areas of divergence