

Key Insights
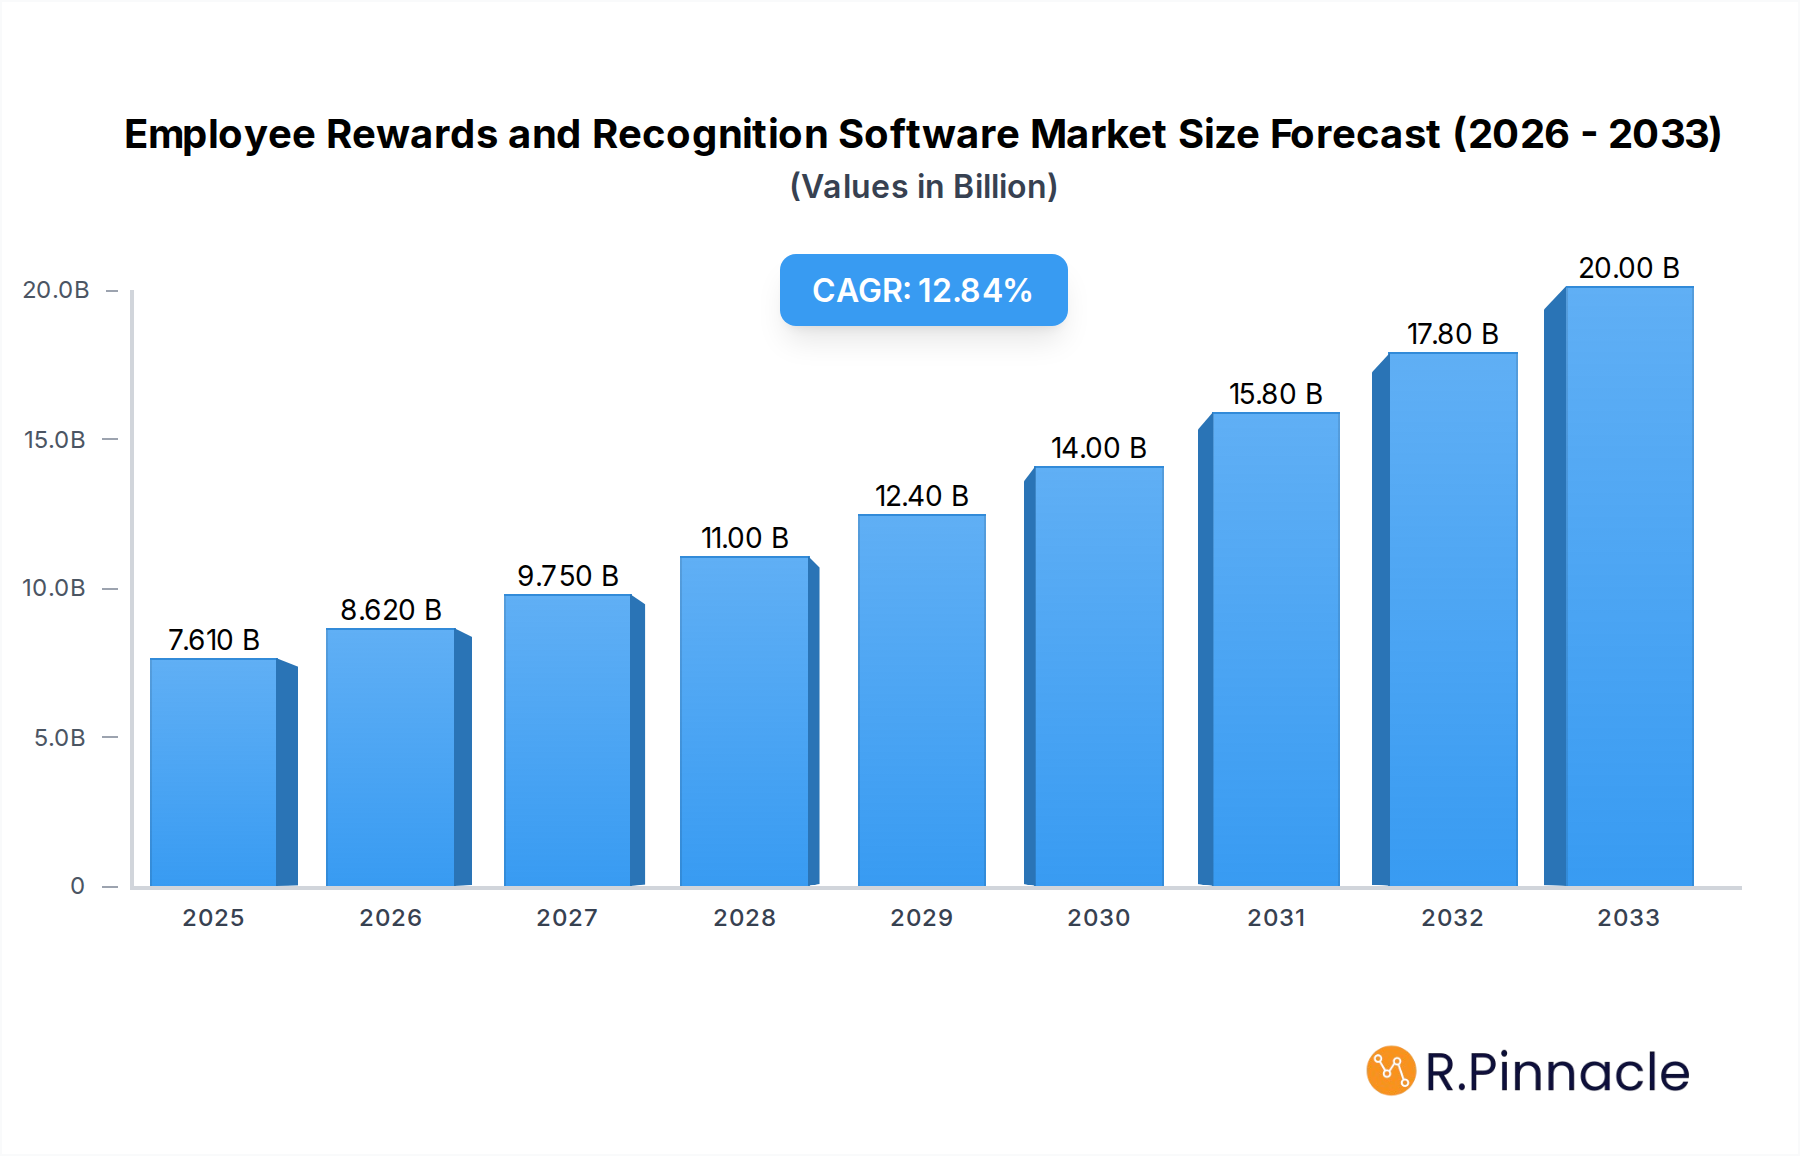
The global Employee Rewards and Recognition Software market is poised for significant expansion, projected to reach $7.61 billion in 2025 with a robust Compound Annual Growth Rate (CAGR) of 13.37% through 2033. This surge is primarily fueled by a growing corporate understanding of the critical role employee recognition plays in boosting engagement, productivity, and retention. Businesses are increasingly investing in sophisticated software solutions to streamline and personalize recognition programs, moving beyond traditional, often ad-hoc, methods. The adoption of cloud-based solutions is a dominant trend, offering scalability, accessibility, and cost-effectiveness for organizations of all sizes, particularly for Small and Medium-sized Enterprises (SMEs) seeking competitive HR tools. Furthermore, the shift towards a more employee-centric work culture, amplified by remote and hybrid work models, necessitates continuous and effective ways to acknowledge employee contributions, thereby driving demand for these specialized platforms. The market is witnessing innovation in features such as social recognition, peer-to-peer awards, and integration with performance management systems, all contributing to a more holistic and impactful employee experience.

Employee Rewards and Recognition Software Market Size (In Billion)
Key market drivers include the escalating need to combat employee burnout and attrition in a competitive talent landscape. Companies are recognizing that effective recognition programs are not just a perk but a strategic imperative for talent management and organizational success. This is further supported by the evolving expectations of the modern workforce, who value appreciation and acknowledgement alongside compensation and benefits. The software solutions are evolving to offer more personalized and timely recognition, fostering a culture of appreciation that resonates with employees. Geographically, North America and Europe are leading the charge in adoption due to established HR best practices and a mature corporate environment. However, the Asia Pacific region is emerging as a high-growth market, driven by rapid economic development and a burgeoning awareness of employee engagement strategies among businesses. The increasing focus on diversity, equity, and inclusion within organizations is also influencing recognition programs, with platforms offering features to ensure equitable distribution of recognition and rewards across all employee demographics.
Employee Rewards and Recognition Software Company Market Share
This comprehensive report offers a definitive analysis of the global Employee Rewards and Recognition Software market, a critical component for fostering positive workplace cultures and enhancing employee engagement. Spanning from 2019 to 2033, with a base year of 2025 and an extensive forecast period of 2025-2033, this study delves into the intricate market structure, dynamics, and future trajectory of this rapidly evolving sector. Leveraging a robust methodology, the report provides actionable insights for stakeholders, including Large Enterprises and SMEs, across Cloud Based and On-premise deployment types.
Employee Rewards and Recognition Software Market Structure & Innovation Trends
The Employee Rewards and Recognition Software market exhibits a moderate to high concentration, with leading players like Reward Gateway, Motivosity, and Bonusly commanding significant market share. Innovation is primarily driven by advancements in AI-powered personalization, gamification, and social recognition features, aiming to create more engaging and impactful employee experiences. Regulatory frameworks are relatively nascent but are evolving to address data privacy and fair labor practices. Product substitutes include manual recognition programs and generic HR platforms, though specialized software offers superior functionality and scalability. End-user demographics span a broad range, with a growing emphasis on millennial and Gen Z workforces who prioritize recognition and appreciation. Mergers and Acquisitions (M&A) activity has been robust, with an estimated M&A deal value of over 10 billion in the past five years, indicating a trend towards consolidation and strategic partnerships to expand service offerings and market reach. Key M&A targets often include companies with innovative technologies or strong customer bases in specific industry verticals.
Employee Rewards and Recognition Software Market Dynamics & Trends
The Employee Rewards and Recognition Software market is poised for substantial growth, driven by a confluence of factors that underscore the increasing recognition of employee well-being and engagement as strategic imperatives for organizational success. The Compound Annual Growth Rate (CAGR) is projected to be in the range of 15-20% throughout the forecast period. This robust growth is fueled by a burgeoning understanding among businesses of all sizes that effective recognition programs are not merely an HR initiative but a fundamental driver of productivity, retention, and overall organizational performance. The shift towards hybrid and remote work models has further amplified the need for digital solutions that can bridge geographical divides and ensure consistent recognition across dispersed teams. Technological disruptions, including the integration of AI for personalized reward suggestions, advanced analytics for measuring program impact, and seamless integration with existing HRIS systems, are continually reshaping the competitive landscape.
Consumer preferences are increasingly leaning towards flexible and personalized reward options. Employees desire recognition that is meaningful to them, ranging from monetary bonuses and gift cards to experiential rewards and professional development opportunities. This demand for customization pushes software providers to offer diverse reward catalogs and flexible redemption options. The competitive dynamics within the market are characterized by intense innovation, with players like WorkTango, Awardco, and Terryberry continuously introducing new features and functionalities to differentiate themselves. The market penetration of these specialized software solutions is expected to rise significantly as more organizations prioritize employee experience. Furthermore, the growing emphasis on company culture and employer branding makes robust recognition programs a key differentiator in attracting and retaining top talent, thereby solidifying their indispensable role in modern business operations. The market is also witnessing increased adoption by SMEs, who are realizing the cost-effectiveness and impact of these platforms in fostering a positive work environment and boosting employee morale.
Dominant Regions & Segments in Employee Rewards and Recognition Software
North America currently holds the dominant position in the Employee Rewards and Recognition Software market, driven by a mature business environment, high adoption rates of HR technology, and a strong organizational culture that values employee appreciation. The United States, in particular, represents a significant market share due to the presence of numerous large enterprises and a strong startup ecosystem that embraces innovative HR solutions. Economic policies that favor employee welfare and robust digital infrastructure further bolster its leadership.
- Application: Large Enterprises: This segment is a major contributor to market revenue due to the sheer volume of employees and the complexity of managing recognition programs across diverse departments and geographies. Large enterprises often have dedicated budgets for HR technology and a strategic focus on employee engagement to mitigate high turnover rates and enhance productivity. The demand for advanced features, scalability, and robust reporting capabilities is particularly high in this segment.
- Application: SMEs: The Small and Medium-sized Enterprises (SMEs) segment is exhibiting a rapidly growing adoption rate. As awareness of the benefits of employee recognition grows, SMEs are increasingly investing in affordable and user-friendly platforms. The ability of these software solutions to foster a close-knit team environment and boost morale without substantial budget outlays makes them an attractive option.
- Types: Cloud Based: Cloud-based solutions dominate the market due to their inherent flexibility, scalability, and cost-effectiveness. They offer easy accessibility from anywhere, reduced IT overhead, and faster deployment times, making them the preferred choice for a majority of organizations.
- Types: On-premise: While gradually declining in market share, on-premise solutions still cater to organizations with stringent data security requirements or specific regulatory compliance needs that necessitate localized data storage and control.
Employee Rewards and Recognition Software Product Innovations
Product innovation in the Employee Rewards and Recognition Software market is characterized by an increasing focus on hyper-personalization and data-driven insights. Companies like Guusto, Kudos, and Cooleaf are integrating AI to offer tailored reward suggestions based on employee preferences, performance, and company values. The incorporation of social recognition features, peer-to-peer nominations, and gamification elements enhances employee engagement and fosters a positive organizational culture. These advancements not only streamline the reward and recognition process but also provide valuable data for HR leaders to measure program effectiveness and identify engagement trends. The competitive advantage lies in creating intuitive, integrated platforms that seamlessly fit into existing workflows.
Report Scope & Segmentation Analysis
This report encompasses a detailed analysis of the Employee Rewards and Recognition Software market, segmented by application and deployment type.
- Application: Large Enterprises: This segment is characterized by high market value due to the extensive need for sophisticated, scalable, and customizable recognition solutions. These organizations seek platforms that can manage diverse reward types, integrate with multiple HR systems, and provide comprehensive analytics to measure ROI and employee sentiment. Growth projections are robust, driven by ongoing investments in employee experience initiatives.
- Application: SMEs: This segment represents a rapidly expanding market with significant growth potential. SMEs are increasingly adopting these solutions to foster a positive work environment, improve retention, and enhance employee motivation. The demand is for cost-effective, user-friendly platforms that can be easily implemented and managed.
- Types: Cloud Based: This segment is projected to continue its dominance, driven by its inherent scalability, accessibility, and cost-efficiency. Cloud solutions offer rapid deployment and continuous updates, making them ideal for businesses of all sizes.
- Types: On-premise: While a smaller segment, on-premise solutions cater to organizations with specific security or regulatory compliance needs, requiring localized data control. This segment's growth is more moderate, as cloud adoption continues to outpace.
Key Drivers of Employee Rewards and Recognition Software Growth
The growth of the Employee Rewards and Recognition Software market is primarily propelled by several key factors. Firstly, the increasing recognition among organizations of the direct correlation between employee engagement and business success, including enhanced productivity, reduced turnover, and improved customer satisfaction. Secondly, the evolving nature of the workforce, with a greater emphasis on employee well-being, work-life balance, and a desire for meaningful appreciation, particularly among younger generations. Thirdly, technological advancements, such as AI-powered personalization, gamification, and seamless integration with existing HR systems, are making these software solutions more effective and accessible. Finally, the rising adoption of hybrid and remote work models necessitates digital platforms to maintain consistent employee recognition and foster a cohesive organizational culture, regardless of physical location.
Challenges in the Employee Rewards and Recognition Software Sector
Despite the significant growth potential, the Employee Rewards and Recognition Software sector faces several challenges. One significant barrier is the initial cost of implementation and integration for some businesses, particularly smaller organizations with limited IT budgets. Ensuring widespread employee adoption and overcoming potential resistance to new technology or recognition programs can also be a hurdle. Furthermore, maintaining the perceived fairness and impartiality of recognition systems across diverse employee groups is crucial to prevent demotivation. The constant need for software providers to innovate and stay ahead of evolving employee expectations and technological trends also presents a competitive pressure. Quantifiable impacts include potential delays in ROI realization if adoption is low or if programs are not aligned with organizational goals.
Emerging Opportunities in Employee Rewards and Recognition Software
The Employee Rewards and Recognition Software market is ripe with emerging opportunities. The increasing demand for personalized and experiential rewards presents a significant avenue for growth, moving beyond traditional monetary bonuses. The integration of these platforms with broader employee experience management (EXM) suites offers a holistic approach to employee well-being and engagement. Furthermore, the expanding global market, particularly in emerging economies where the adoption of such software is still in its nascent stages, presents substantial untapped potential. The growing trend of using recognition data to inform talent management strategies and identify high-potential employees is another key opportunity. Technological advancements, such as the use of blockchain for transparent reward distribution or advanced analytics for predictive engagement, will further shape the future of this market.
Leading Players in the Employee Rewards and Recognition Software Market
- Reward Gateway
- Motivosity
- Bucketlist
- Bonusly
- WorkTango
- Awardco
- Terryberry
- Guusto
- Kudos
- Cooleaf
- Nectar
- Assembly
- Workstars
- Blueboard
Key Developments in Employee Rewards and Recognition Software Industry
- 2023/Q3: Bonusly launches an AI-powered feature for personalized reward suggestions, enhancing employee relevance.
- 2023/Q4: Awardco announces a strategic partnership with a leading global HR consulting firm to expand its market reach.
- 2024/Q1: WorkTango introduces enhanced analytics dashboards for deeper insights into employee engagement and recognition program effectiveness.
- 2024/Q2: Guusto expands its reward catalog with a focus on sustainable and experiential options to cater to evolving employee preferences.
- 2024/Q3: Kudos rolls out new gamification features to increase user participation and engagement on its platform.
- 2024/Q4: Reward Gateway acquires a smaller competitor, strengthening its market position in specific industry verticals.
Future Outlook for Employee Rewards and Recognition Software Market
The future outlook for the Employee Rewards and Recognition Software market is exceptionally promising, driven by an intensifying focus on employee experience as a key differentiator for organizational success. The market is expected to witness sustained high growth as more companies, across all segments and industries, recognize the critical role of effective recognition in boosting morale, productivity, and retention. Strategic opportunities lie in further integrating AI for hyper-personalized rewards and sophisticated predictive analytics. The expansion into new geographical markets and the development of more comprehensive employee experience platforms that seamlessly blend recognition with other HR functions will be key growth accelerators. The industry is poised to become an indispensable tool for building resilient, engaged, and high-performing workforces in the years to come.
Employee Rewards and Recognition Software Segmentation
-
1. Application
- 1.1. Large Enterprises
- 1.2. SMEs
-
2. Types
- 2.1. Cloud Based
- 2.2. On-premise
Employee Rewards and Recognition Software Segmentation By Geography
-
1. North America
- 1.1. United States
- 1.2. Canada
- 1.3. Mexico
-
2. South America
- 2.1. Brazil
- 2.2. Argentina
- 2.3. Rest of South America
-
3. Europe
- 3.1. United Kingdom
- 3.2. Germany
- 3.3. France
- 3.4. Italy
- 3.5. Spain
- 3.6. Russia
- 3.7. Benelux
- 3.8. Nordics
- 3.9. Rest of Europe
-
4. Middle East & Africa
- 4.1. Turkey
- 4.2. Israel
- 4.3. GCC
- 4.4. North Africa
- 4.5. South Africa
- 4.6. Rest of Middle East & Africa
-
5. Asia Pacific
- 5.1. China
- 5.2. India
- 5.3. Japan
- 5.4. South Korea
- 5.5. ASEAN
- 5.6. Oceania
- 5.7. Rest of Asia Pacific

Employee Rewards and Recognition Software Regional Market Share
Geographic Coverage of Employee Rewards and Recognition Software
Employee Rewards and Recognition Software REPORT HIGHLIGHTS
| Aspects | Details |
|---|---|
| Study Period | 2020-2034 |
| Base Year | 2025 |
| Estimated Year | 2026 |
| Forecast Period | 2026-2034 |
| Historical Period | 2020-2025 |
| Growth Rate | CAGR of 13.37% from 2020-2034 |
| Segmentation |
|
Table of Contents
- 1. Introduction
- 1.1. Research Scope
- 1.2. Market Segmentation
- 1.3. Research Methodology
- 1.4. Definitions and Assumptions
- 2. Executive Summary
- 2.1. Introduction
- 3. Market Dynamics
- 3.1. Introduction
- 3.2. Market Drivers
- 3.3. Market Restrains
- 3.4. Market Trends
- 4. Market Factor Analysis
- 4.1. Porters Five Forces
- 4.2. Supply/Value Chain
- 4.3. PESTEL analysis
- 4.4. Market Entropy
- 4.5. Patent/Trademark Analysis
- 5. Global Employee Rewards and Recognition Software Analysis, Insights and Forecast, 2020-2032
- 5.1. Market Analysis, Insights and Forecast - by Application
- 5.1.1. Large Enterprises
- 5.1.2. SMEs
- 5.2. Market Analysis, Insights and Forecast - by Types
- 5.2.1. Cloud Based
- 5.2.2. On-premise
- 5.3. Market Analysis, Insights and Forecast - by Region
- 5.3.1. North America
- 5.3.2. South America
- 5.3.3. Europe
- 5.3.4. Middle East & Africa
- 5.3.5. Asia Pacific
- 5.1. Market Analysis, Insights and Forecast - by Application
- 6. North America Employee Rewards and Recognition Software Analysis, Insights and Forecast, 2020-2032
- 6.1. Market Analysis, Insights and Forecast - by Application
- 6.1.1. Large Enterprises
- 6.1.2. SMEs
- 6.2. Market Analysis, Insights and Forecast - by Types
- 6.2.1. Cloud Based
- 6.2.2. On-premise
- 6.1. Market Analysis, Insights and Forecast - by Application
- 7. South America Employee Rewards and Recognition Software Analysis, Insights and Forecast, 2020-2032
- 7.1. Market Analysis, Insights and Forecast - by Application
- 7.1.1. Large Enterprises
- 7.1.2. SMEs
- 7.2. Market Analysis, Insights and Forecast - by Types
- 7.2.1. Cloud Based
- 7.2.2. On-premise
- 7.1. Market Analysis, Insights and Forecast - by Application
- 8. Europe Employee Rewards and Recognition Software Analysis, Insights and Forecast, 2020-2032
- 8.1. Market Analysis, Insights and Forecast - by Application
- 8.1.1. Large Enterprises
- 8.1.2. SMEs
- 8.2. Market Analysis, Insights and Forecast - by Types
- 8.2.1. Cloud Based
- 8.2.2. On-premise
- 8.1. Market Analysis, Insights and Forecast - by Application
- 9. Middle East & Africa Employee Rewards and Recognition Software Analysis, Insights and Forecast, 2020-2032
- 9.1. Market Analysis, Insights and Forecast - by Application
- 9.1.1. Large Enterprises
- 9.1.2. SMEs
- 9.2. Market Analysis, Insights and Forecast - by Types
- 9.2.1. Cloud Based
- 9.2.2. On-premise
- 9.1. Market Analysis, Insights and Forecast - by Application
- 10. Asia Pacific Employee Rewards and Recognition Software Analysis, Insights and Forecast, 2020-2032
- 10.1. Market Analysis, Insights and Forecast - by Application
- 10.1.1. Large Enterprises
- 10.1.2. SMEs
- 10.2. Market Analysis, Insights and Forecast - by Types
- 10.2.1. Cloud Based
- 10.2.2. On-premise
- 10.1. Market Analysis, Insights and Forecast - by Application
- 11. Competitive Analysis
- 11.1. Global Market Share Analysis 2025
- 11.2. Company Profiles
- 11.2.1 Reward Gateway
- 11.2.1.1. Overview
- 11.2.1.2. Products
- 11.2.1.3. SWOT Analysis
- 11.2.1.4. Recent Developments
- 11.2.1.5. Financials (Based on Availability)
- 11.2.2 Motivosity
- 11.2.2.1. Overview
- 11.2.2.2. Products
- 11.2.2.3. SWOT Analysis
- 11.2.2.4. Recent Developments
- 11.2.2.5. Financials (Based on Availability)
- 11.2.3 Bucketlist
- 11.2.3.1. Overview
- 11.2.3.2. Products
- 11.2.3.3. SWOT Analysis
- 11.2.3.4. Recent Developments
- 11.2.3.5. Financials (Based on Availability)
- 11.2.4 Bonusly
- 11.2.4.1. Overview
- 11.2.4.2. Products
- 11.2.4.3. SWOT Analysis
- 11.2.4.4. Recent Developments
- 11.2.4.5. Financials (Based on Availability)
- 11.2.5 WorkTango
- 11.2.5.1. Overview
- 11.2.5.2. Products
- 11.2.5.3. SWOT Analysis
- 11.2.5.4. Recent Developments
- 11.2.5.5. Financials (Based on Availability)
- 11.2.6 Awardco
- 11.2.6.1. Overview
- 11.2.6.2. Products
- 11.2.6.3. SWOT Analysis
- 11.2.6.4. Recent Developments
- 11.2.6.5. Financials (Based on Availability)
- 11.2.7 Terryberry
- 11.2.7.1. Overview
- 11.2.7.2. Products
- 11.2.7.3. SWOT Analysis
- 11.2.7.4. Recent Developments
- 11.2.7.5. Financials (Based on Availability)
- 11.2.8 Guusto
- 11.2.8.1. Overview
- 11.2.8.2. Products
- 11.2.8.3. SWOT Analysis
- 11.2.8.4. Recent Developments
- 11.2.8.5. Financials (Based on Availability)
- 11.2.9 Kudos
- 11.2.9.1. Overview
- 11.2.9.2. Products
- 11.2.9.3. SWOT Analysis
- 11.2.9.4. Recent Developments
- 11.2.9.5. Financials (Based on Availability)
- 11.2.10 Cooleaf
- 11.2.10.1. Overview
- 11.2.10.2. Products
- 11.2.10.3. SWOT Analysis
- 11.2.10.4. Recent Developments
- 11.2.10.5. Financials (Based on Availability)
- 11.2.11 Nectar
- 11.2.11.1. Overview
- 11.2.11.2. Products
- 11.2.11.3. SWOT Analysis
- 11.2.11.4. Recent Developments
- 11.2.11.5. Financials (Based on Availability)
- 11.2.12 Assembly
- 11.2.12.1. Overview
- 11.2.12.2. Products
- 11.2.12.3. SWOT Analysis
- 11.2.12.4. Recent Developments
- 11.2.12.5. Financials (Based on Availability)
- 11.2.13 Workstars
- 11.2.13.1. Overview
- 11.2.13.2. Products
- 11.2.13.3. SWOT Analysis
- 11.2.13.4. Recent Developments
- 11.2.13.5. Financials (Based on Availability)
- 11.2.14 Blueboard
- 11.2.14.1. Overview
- 11.2.14.2. Products
- 11.2.14.3. SWOT Analysis
- 11.2.14.4. Recent Developments
- 11.2.14.5. Financials (Based on Availability)
- 11.2.1 Reward Gateway
List of Figures
- Figure 1: Global Employee Rewards and Recognition Software Revenue Breakdown (undefined, %) by Region 2025 & 2033
- Figure 2: North America Employee Rewards and Recognition Software Revenue (undefined), by Application 2025 & 2033
- Figure 3: North America Employee Rewards and Recognition Software Revenue Share (%), by Application 2025 & 2033
- Figure 4: North America Employee Rewards and Recognition Software Revenue (undefined), by Types 2025 & 2033
- Figure 5: North America Employee Rewards and Recognition Software Revenue Share (%), by Types 2025 & 2033
- Figure 6: North America Employee Rewards and Recognition Software Revenue (undefined), by Country 2025 & 2033
- Figure 7: North America Employee Rewards and Recognition Software Revenue Share (%), by Country 2025 & 2033
- Figure 8: South America Employee Rewards and Recognition Software Revenue (undefined), by Application 2025 & 2033
- Figure 9: South America Employee Rewards and Recognition Software Revenue Share (%), by Application 2025 & 2033
- Figure 10: South America Employee Rewards and Recognition Software Revenue (undefined), by Types 2025 & 2033
- Figure 11: South America Employee Rewards and Recognition Software Revenue Share (%), by Types 2025 & 2033
- Figure 12: South America Employee Rewards and Recognition Software Revenue (undefined), by Country 2025 & 2033
- Figure 13: South America Employee Rewards and Recognition Software Revenue Share (%), by Country 2025 & 2033
- Figure 14: Europe Employee Rewards and Recognition Software Revenue (undefined), by Application 2025 & 2033
- Figure 15: Europe Employee Rewards and Recognition Software Revenue Share (%), by Application 2025 & 2033
- Figure 16: Europe Employee Rewards and Recognition Software Revenue (undefined), by Types 2025 & 2033
- Figure 17: Europe Employee Rewards and Recognition Software Revenue Share (%), by Types 2025 & 2033
- Figure 18: Europe Employee Rewards and Recognition Software Revenue (undefined), by Country 2025 & 2033
- Figure 19: Europe Employee Rewards and Recognition Software Revenue Share (%), by Country 2025 & 2033
- Figure 20: Middle East & Africa Employee Rewards and Recognition Software Revenue (undefined), by Application 2025 & 2033
- Figure 21: Middle East & Africa Employee Rewards and Recognition Software Revenue Share (%), by Application 2025 & 2033
- Figure 22: Middle East & Africa Employee Rewards and Recognition Software Revenue (undefined), by Types 2025 & 2033
- Figure 23: Middle East & Africa Employee Rewards and Recognition Software Revenue Share (%), by Types 2025 & 2033
- Figure 24: Middle East & Africa Employee Rewards and Recognition Software Revenue (undefined), by Country 2025 & 2033
- Figure 25: Middle East & Africa Employee Rewards and Recognition Software Revenue Share (%), by Country 2025 & 2033
- Figure 26: Asia Pacific Employee Rewards and Recognition Software Revenue (undefined), by Application 2025 & 2033
- Figure 27: Asia Pacific Employee Rewards and Recognition Software Revenue Share (%), by Application 2025 & 2033
- Figure 28: Asia Pacific Employee Rewards and Recognition Software Revenue (undefined), by Types 2025 & 2033
- Figure 29: Asia Pacific Employee Rewards and Recognition Software Revenue Share (%), by Types 2025 & 2033
- Figure 30: Asia Pacific Employee Rewards and Recognition Software Revenue (undefined), by Country 2025 & 2033
- Figure 31: Asia Pacific Employee Rewards and Recognition Software Revenue Share (%), by Country 2025 & 2033
List of Tables
- Table 1: Global Employee Rewards and Recognition Software Revenue undefined Forecast, by Application 2020 & 2033
- Table 2: Global Employee Rewards and Recognition Software Revenue undefined Forecast, by Types 2020 & 2033
- Table 3: Global Employee Rewards and Recognition Software Revenue undefined Forecast, by Region 2020 & 2033
- Table 4: Global Employee Rewards and Recognition Software Revenue undefined Forecast, by Application 2020 & 2033
- Table 5: Global Employee Rewards and Recognition Software Revenue undefined Forecast, by Types 2020 & 2033
- Table 6: Global Employee Rewards and Recognition Software Revenue undefined Forecast, by Country 2020 & 2033
- Table 7: United States Employee Rewards and Recognition Software Revenue (undefined) Forecast, by Application 2020 & 2033
- Table 8: Canada Employee Rewards and Recognition Software Revenue (undefined) Forecast, by Application 2020 & 2033
- Table 9: Mexico Employee Rewards and Recognition Software Revenue (undefined) Forecast, by Application 2020 & 2033
- Table 10: Global Employee Rewards and Recognition Software Revenue undefined Forecast, by Application 2020 & 2033
- Table 11: Global Employee Rewards and Recognition Software Revenue undefined Forecast, by Types 2020 & 2033
- Table 12: Global Employee Rewards and Recognition Software Revenue undefined Forecast, by Country 2020 & 2033
- Table 13: Brazil Employee Rewards and Recognition Software Revenue (undefined) Forecast, by Application 2020 & 2033
- Table 14: Argentina Employee Rewards and Recognition Software Revenue (undefined) Forecast, by Application 2020 & 2033
- Table 15: Rest of South America Employee Rewards and Recognition Software Revenue (undefined) Forecast, by Application 2020 & 2033
- Table 16: Global Employee Rewards and Recognition Software Revenue undefined Forecast, by Application 2020 & 2033
- Table 17: Global Employee Rewards and Recognition Software Revenue undefined Forecast, by Types 2020 & 2033
- Table 18: Global Employee Rewards and Recognition Software Revenue undefined Forecast, by Country 2020 & 2033
- Table 19: United Kingdom Employee Rewards and Recognition Software Revenue (undefined) Forecast, by Application 2020 & 2033
- Table 20: Germany Employee Rewards and Recognition Software Revenue (undefined) Forecast, by Application 2020 & 2033
- Table 21: France Employee Rewards and Recognition Software Revenue (undefined) Forecast, by Application 2020 & 2033
- Table 22: Italy Employee Rewards and Recognition Software Revenue (undefined) Forecast, by Application 2020 & 2033
- Table 23: Spain Employee Rewards and Recognition Software Revenue (undefined) Forecast, by Application 2020 & 2033
- Table 24: Russia Employee Rewards and Recognition Software Revenue (undefined) Forecast, by Application 2020 & 2033
- Table 25: Benelux Employee Rewards and Recognition Software Revenue (undefined) Forecast, by Application 2020 & 2033
- Table 26: Nordics Employee Rewards and Recognition Software Revenue (undefined) Forecast, by Application 2020 & 2033
- Table 27: Rest of Europe Employee Rewards and Recognition Software Revenue (undefined) Forecast, by Application 2020 & 2033
- Table 28: Global Employee Rewards and Recognition Software Revenue undefined Forecast, by Application 2020 & 2033
- Table 29: Global Employee Rewards and Recognition Software Revenue undefined Forecast, by Types 2020 & 2033
- Table 30: Global Employee Rewards and Recognition Software Revenue undefined Forecast, by Country 2020 & 2033
- Table 31: Turkey Employee Rewards and Recognition Software Revenue (undefined) Forecast, by Application 2020 & 2033
- Table 32: Israel Employee Rewards and Recognition Software Revenue (undefined) Forecast, by Application 2020 & 2033
- Table 33: GCC Employee Rewards and Recognition Software Revenue (undefined) Forecast, by Application 2020 & 2033
- Table 34: North Africa Employee Rewards and Recognition Software Revenue (undefined) Forecast, by Application 2020 & 2033
- Table 35: South Africa Employee Rewards and Recognition Software Revenue (undefined) Forecast, by Application 2020 & 2033
- Table 36: Rest of Middle East & Africa Employee Rewards and Recognition Software Revenue (undefined) Forecast, by Application 2020 & 2033
- Table 37: Global Employee Rewards and Recognition Software Revenue undefined Forecast, by Application 2020 & 2033
- Table 38: Global Employee Rewards and Recognition Software Revenue undefined Forecast, by Types 2020 & 2033
- Table 39: Global Employee Rewards and Recognition Software Revenue undefined Forecast, by Country 2020 & 2033
- Table 40: China Employee Rewards and Recognition Software Revenue (undefined) Forecast, by Application 2020 & 2033
- Table 41: India Employee Rewards and Recognition Software Revenue (undefined) Forecast, by Application 2020 & 2033
- Table 42: Japan Employee Rewards and Recognition Software Revenue (undefined) Forecast, by Application 2020 & 2033
- Table 43: South Korea Employee Rewards and Recognition Software Revenue (undefined) Forecast, by Application 2020 & 2033
- Table 44: ASEAN Employee Rewards and Recognition Software Revenue (undefined) Forecast, by Application 2020 & 2033
- Table 45: Oceania Employee Rewards and Recognition Software Revenue (undefined) Forecast, by Application 2020 & 2033
- Table 46: Rest of Asia Pacific Employee Rewards and Recognition Software Revenue (undefined) Forecast, by Application 2020 & 2033
Frequently Asked Questions
1. What is the projected Compound Annual Growth Rate (CAGR) of the Employee Rewards and Recognition Software?
The projected CAGR is approximately 13.37%.
2. Which companies are prominent players in the Employee Rewards and Recognition Software?
Key companies in the market include Reward Gateway, Motivosity, Bucketlist, Bonusly, WorkTango, Awardco, Terryberry, Guusto, Kudos, Cooleaf, Nectar, Assembly, Workstars, Blueboard.
3. What are the main segments of the Employee Rewards and Recognition Software?
The market segments include Application, Types.
4. Can you provide details about the market size?
The market size is estimated to be USD XXX N/A as of 2022.
5. What are some drivers contributing to market growth?
N/A
6. What are the notable trends driving market growth?
N/A
7. Are there any restraints impacting market growth?
N/A
8. Can you provide examples of recent developments in the market?
N/A
9. What pricing options are available for accessing the report?
Pricing options include single-user, multi-user, and enterprise licenses priced at USD 2900.00, USD 4350.00, and USD 5800.00 respectively.
10. Is the market size provided in terms of value or volume?
The market size is provided in terms of value, measured in N/A.
11. Are there any specific market keywords associated with the report?
Yes, the market keyword associated with the report is "Employee Rewards and Recognition Software," which aids in identifying and referencing the specific market segment covered.
12. How do I determine which pricing option suits my needs best?
The pricing options vary based on user requirements and access needs. Individual users may opt for single-user licenses, while businesses requiring broader access may choose multi-user or enterprise licenses for cost-effective access to the report.
13. Are there any additional resources or data provided in the Employee Rewards and Recognition Software report?
While the report offers comprehensive insights, it's advisable to review the specific contents or supplementary materials provided to ascertain if additional resources or data are available.
14. How can I stay updated on further developments or reports in the Employee Rewards and Recognition Software?
To stay informed about further developments, trends, and reports in the Employee Rewards and Recognition Software, consider subscribing to industry newsletters, following relevant companies and organizations, or regularly checking reputable industry news sources and publications.
Methodology
Step 1 - Identification of Relevant Samples Size from Population Database


Step 2 - Approaches for Defining Global Market Size (Value, Volume* & Price*)

Note*: In applicable scenarios
Step 3 - Data Sources
Primary Research
- Web Analytics
- Survey Reports
- Research Institute
- Latest Research Reports
- Opinion Leaders
Secondary Research
- Annual Reports
- White Paper
- Latest Press Release
- Industry Association
- Paid Database
- Investor Presentations

Step 4 - Data Triangulation
Involves using different sources of information in order to increase the validity of a study
These sources are likely to be stakeholders in a program - participants, other researchers, program staff, other community members, and so on.
Then we put all data in single framework & apply various statistical tools to find out the dynamic on the market.
During the analysis stage, feedback from the stakeholder groups would be compared to determine areas of agreement as well as areas of divergence