

Key Insights
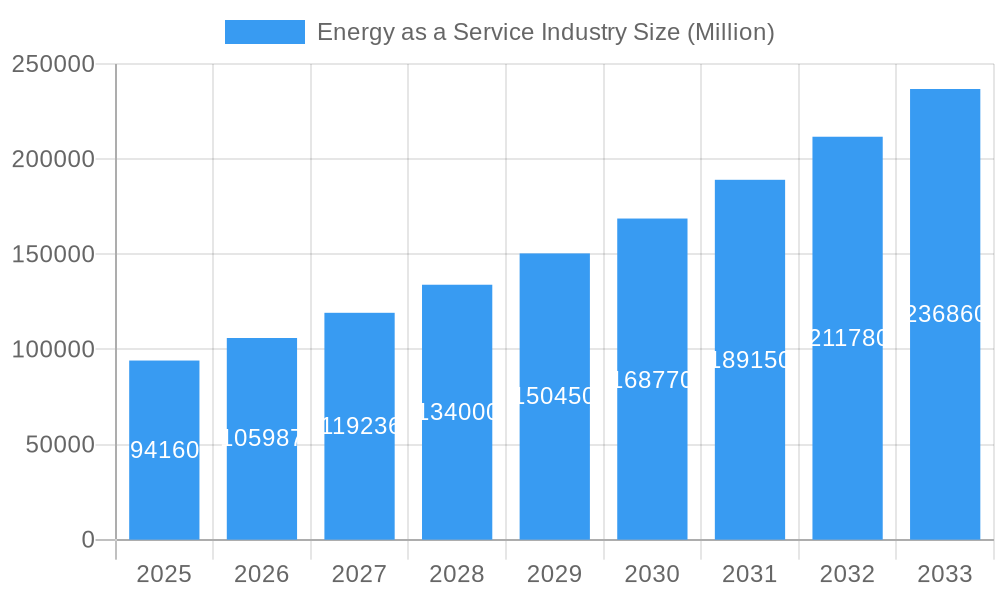
The Energy as a Service (EaaS) market is experiencing robust growth, projected to reach a market size of $94.16 billion in 2025 and exhibiting a Compound Annual Growth Rate (CAGR) of 12.48% from 2025 to 2033. This expansion is driven by several key factors. Firstly, increasing energy costs and a growing focus on sustainability are prompting businesses and industries to seek more efficient and cost-effective energy solutions. EaaS models, which offer flexible payment structures and reduced upfront capital expenditure, are particularly attractive in this context. Secondly, advancements in smart technologies, including IoT sensors and AI-powered analytics, are enabling more precise energy management and optimization, further boosting the adoption of EaaS. The commercial sector is currently a major driver of market growth, but the industrial sector is poised for significant expansion as companies recognize the potential for EaaS to improve operational efficiency and reduce their environmental footprint. Leading players like Honeywell, Johnson Controls, and Schneider Electric are actively shaping the market through innovative service offerings and strategic partnerships. Geographic expansion is also a significant driver, with North America and Europe currently leading the market but Asia-Pacific showing substantial growth potential due to rising industrialization and increasing energy demands.
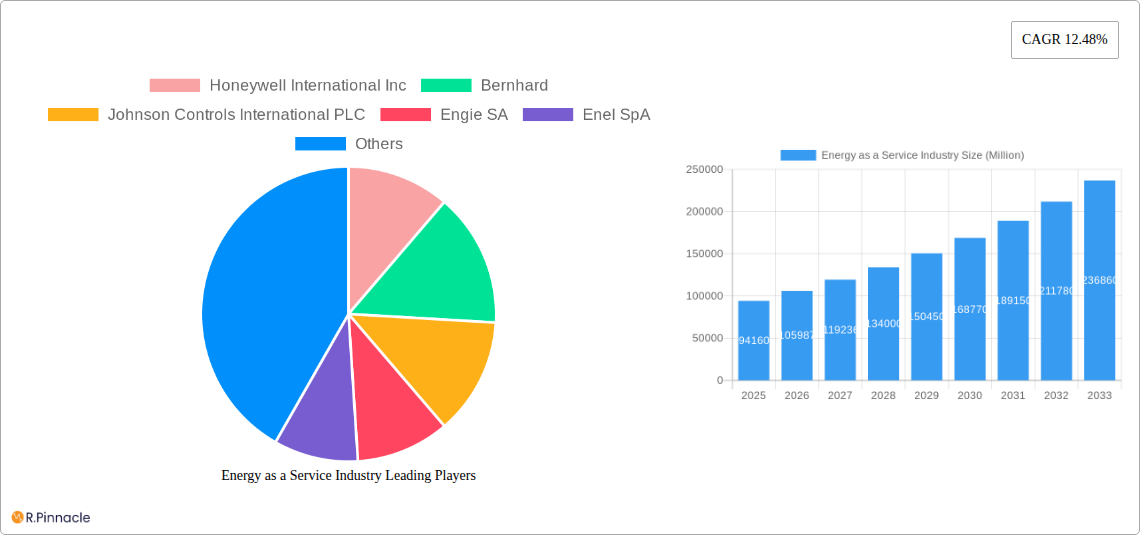
Energy as a Service Industry Market Size (In Billion)
The EaaS market segmentation highlights the distinct needs and opportunities within different end-user sectors. While the commercial sector currently dominates, the industrial sector's substantial energy consumption and growing awareness of sustainability initiatives suggest significant future growth. Competitive dynamics are characterized by a mix of established energy providers diversifying their offerings and specialized EaaS providers emerging with innovative business models. The regulatory landscape, particularly government incentives for renewable energy adoption and energy efficiency improvements, will play a crucial role in shaping the future trajectory of the EaaS market. Restraints, while present, are largely surmountable. Concerns about data security and potential vendor lock-in are being addressed through robust security protocols and flexible contract terms offered by reputable providers. The market's continued expansion will depend on further technological advancements, evolving regulatory frameworks, and the growing acceptance of EaaS as a viable and beneficial energy solution across all sectors.
Energy as a Service Industry Company Market Share
Energy as a Service (EaaS) Industry Report: 2019-2033
This comprehensive report provides an in-depth analysis of the Energy as a Service (EaaS) industry, projecting a market valued at $XX Million by 2033. The study covers the period 2019-2033, with 2025 as the base and estimated year. It offers actionable insights for industry professionals, investors, and strategists seeking to navigate this rapidly evolving sector.
Energy as a Service Industry Market Structure & Innovation Trends
The EaaS market is characterized by a moderately concentrated structure, with key players like Honeywell International Inc, Johnson Controls International PLC, and Engie SA holding significant market share (estimated at xx% combined in 2025). However, the market also exhibits a high degree of innovation, driven by advancements in renewable energy technologies, smart grid infrastructure, and data analytics. Regulatory frameworks, particularly those focused on carbon reduction and energy efficiency, are significant drivers. Product substitutes, such as traditional energy procurement models, face increasing pressure due to the cost-effectiveness and sustainability advantages of EaaS.
- Market Concentration: High, with top 5 players holding xx% market share in 2025.
- Innovation Drivers: Renewable energy integration, smart grids, AI-powered optimization, and IoT.
- Regulatory Landscape: Favorable policies promoting energy efficiency and carbon reduction are boosting adoption.
- M&A Activity: Significant M&A activity in the historical period (2019-2024) with a total deal value of approximately $XX Million, indicating consolidation and expansion efforts. (Examples: Honeywell's investment in Redaptive).
- End-User Demographics: Primarily focused on Commercial and Industrial segments, with growth potential in residential and other sectors.
Energy as a Service Industry Market Dynamics & Trends
The Energy as a Service (EaaS) market is experiencing a period of **unprecedented and robust expansion**. This surge is primarily propelled by the confluence of escalating global energy costs, increasingly stringent environmental regulations mandating reduced carbon footprints, and a growing, imperative demand for sustainable and renewable energy solutions. Projections indicate a formidable Compound Annual Growth Rate (CAGR) of **[Insert Projected CAGR]%** from 2025 to 2033, with the market anticipated to reach a significant valuation of **$[Insert Market Size] Million**. This growth is further amplified by rapid technological advancements, notably the widespread adoption of Internet of Things (IoT) devices for real-time data collection and the sophistication of AI-powered energy management systems that enable predictive analytics and proactive optimization. Consumer and enterprise preferences are demonstrably shifting towards energy solutions that offer not only **flexibility and cost-effectiveness** but also a clear commitment to environmental stewardship. This paradigm shift is creating an exceptionally fertile ground for EaaS adoption. The competitive landscape is characterized by a dynamic interplay of **strategic collaborations and intense competition**. Companies are actively pursuing strategic partnerships to leverage complementary expertise and are intensely focused on product differentiation to capture and expand market share. The overall market penetration is expected to reach an impressive **[Insert Market Penetration]%** by 2033, a testament to the successful and scalable deployments across a diverse array of industry segments.
Dominant Regions & Segments in Energy as a Service Industry
North America currently dominates the EaaS market, driven by favorable government policies, advanced infrastructure, and high energy costs. Within the end-user segments, the Industrial sector exhibits higher growth potential compared to the Commercial sector due to larger energy consumption and stronger incentives for energy optimization.
Key Drivers for North American Dominance:
- Strong regulatory support for renewable energy and energy efficiency.
- Advanced technological infrastructure and expertise.
- High energy costs and increasing awareness of sustainability.
Industrial Sector Dominance:
- Significant energy consumption and associated cost savings potential.
- Strong incentives for energy efficiency improvements.
- Opportunities for integrated solutions across manufacturing processes.
Energy as a Service Industry Product Innovations
The vanguard of product innovation within the EaaS industry is resolutely focused on the **seamless integration of diverse renewable energy sources**, such as solar, wind, and battery storage. This is complemented by the development of **advanced analytics platforms** that harness the power of big data to provide granular insights, enabling optimized energy consumption patterns and significant cost savings for clients. Furthermore, there's a strong emphasis on creating **flexible, modular, and highly scalable solutions** that can adapt to the evolving needs of businesses across different sectors. These innovations are not merely incremental; they are designed to offer substantial and tangible competitive advantages, manifesting in improved cost-effectiveness, enhanced sustainability profiles, and demonstrably superior operational efficiency. Emerging technological paradigms like Artificial Intelligence (AI) for predictive maintenance and demand forecasting, the Internet of Things (IoT) for granular data capture and control, and blockchain for transparent and secure energy transactions are playing a pivotal role in augmenting product capabilities and revolutionizing the overall customer experience.
Report Scope & Segmentation Analysis
This comprehensive report meticulously segments the Energy as a Service (EaaS) market based on its primary end-user categories: the **Commercial Segment** and the **Industrial Segment**.
Commercial Segment: This segment is dedicated to delivering cutting-edge energy efficiency and management solutions tailored for a wide spectrum of commercial properties, including high-rise office buildings, bustling retail spaces, hotels, educational institutions, and healthcare facilities. The market within this segment is projected to achieve a substantial valuation of **$[Insert Commercial Segment Market Size] Million** by 2033. This significant growth trajectory is underpinned by the ever-increasing demand for energy-efficient and green building certifications, coupled with the implementation of more stringent energy consumption regulations and mandates aimed at reducing the environmental impact of commercial operations.
Industrial Segment: This segment encompasses advanced EaaS solutions designed for the unique and often demanding requirements of industrial operations. This includes optimizing energy usage in manufacturing facilities, ensuring reliable and efficient power for data centers, and providing sustainable energy solutions for heavy industries and processing plants. This segment is poised for extraordinary growth, with projections indicating it will reach **$[Insert Industrial Segment Market Size] Million** by 2033. The primary drivers for this expansion are the critical need for substantial cost reduction in energy expenditures, the imperative for enhanced operational efficiency and reliability, and the growing pressure to meet corporate sustainability goals and reduce industrial carbon footprints.
Key Drivers of Energy as a Service Industry Growth
Several factors are driving the growth of the EaaS industry:
- Technological advancements: AI-powered energy management systems, IoT devices, and renewable energy integration are boosting efficiency and reducing costs.
- Economic factors: Rising energy costs and the need for cost optimization are driving adoption.
- Regulatory policies: Government incentives and regulations promoting energy efficiency and sustainability are creating favorable market conditions. Examples include carbon emission reduction targets and renewable energy mandates.
Challenges in the Energy as a Service Industry Sector
The EaaS industry faces several challenges:
- Regulatory hurdles: Navigating complex regulatory frameworks and obtaining necessary permits can pose significant challenges.
- Supply chain issues: Potential disruptions in the supply chain for key components could impact project timelines and costs.
- Competitive pressures: The market is becoming increasingly competitive, with established players and new entrants vying for market share. This competitive pressure can impact pricing and profitability.
Emerging Opportunities in Energy as a Service Industry
The dynamic Energy as a Service (EaaS) market is brimming with a multitude of exciting and lucrative opportunities for forward-thinking enterprises:
- Expansion into Untapped Market Segments: Significant growth potential lies in strategically extending EaaS offerings into currently underserved or nascent markets. This includes the expansive **residential sector**, where homeowners are increasingly seeking affordable and sustainable energy solutions, the burgeoning agricultural industry, which can benefit from optimized energy use for irrigation and operations, and the rapidly evolving transportation sector, particularly with the rise of electric vehicles and the need for smart charging infrastructure.
- Pioneering Technological Integration: The continuous integration of groundbreaking technologies is a key differentiator. Leveraging advancements like **blockchain for secure and transparent energy trading and verifiable carbon credits**, and **advanced AI/ML algorithms for predictive maintenance, real-time grid balancing, and hyper-personalized energy consumption profiles**, can unlock the creation of entirely new, value-added service offerings that set companies apart.
- Cultivating Strategic Partnerships and Collaborations: The power of synergy cannot be overstated. Forging deep and strategic alliances with key stakeholders, such as leading technology providers to co-develop innovative solutions, established energy companies to leverage existing infrastructure and customer bases, and **real estate developers to integrate EaaS from the ground up in new constructions, can unlock significant operational synergies and accelerate market penetration and expansion.
Leading Players in the Energy as a Service Industry Market
- Honeywell International Inc
- Bernhard
- Johnson Controls International PLC
- Engie SA
- Enel SpA
- Spark Community Investment Co
- Schneider Electric SE
- Veolia Environnement SA
- Electricite de France (EDF) SA
Key Developments in Energy as a Service Industry
- March 2023: Honeywell announced a strategic investment in Redaptive to accelerate EaaS capabilities for commercial and industrial buildings, focusing on carbon emission reduction.
- April 2023: Capstone Green Energy Corporation secured a contract for an additional C800S microturbine, following an earlier 3.6 MW EaaS contract, demonstrating growing demand within the industry.
Future Outlook for Energy as a Service Industry Market
The future trajectory of the Energy as a Service (EaaS) market is exceptionally **promising and poised for sustained, significant expansion**. This optimistic outlook is firmly anchored by the ongoing march of technological innovation, the persistent upward trend in global energy costs, and the ever-tightening grip of environmental regulations that are increasingly driving the adoption of sustainable practices. Strategic avenues for capitalizing on this growth are multifaceted. They include the proactive development of innovative and tailored solutions for the aforementioned emerging market segments, the adept leveraging of cutting-edge technologies to enhance service offerings and operational efficiencies, and the deliberate cultivation of strategic partnerships designed to harness collective strengths and capture a larger share of this rapidly expanding market potential. The market is unequivocally set for substantial growth, with particularly robust expansion anticipated in both the vital commercial and industrial segments, signaling a transformative era for energy management and delivery.
Energy as a Service Industry Segmentation
-
1. End User
- 1.1. Commercial
- 1.2. Industrial
Energy as a Service Industry Segmentation By Geography
-
1. North America
- 1.1. United States
- 1.2. Canada
- 1.3. Rest of North America
-
2. Europe
- 2.1. Germany
- 2.2. France
- 2.3. United Kingdom
- 2.4. Rest of Europe
-
3. Asia Pacific
- 3.1. China
- 3.2. India
- 3.3. Japan
- 3.4. South Korea
- 3.5. Rest of Asia Pacific
-
4. South America
- 4.1. Brazil
- 4.2. Argentina
- 4.3. Rest of South America
-
5. Middle East and Africa
- 5.1. Saudi Arabia
- 5.2. United Arab Emirates
- 5.3. South Africa
- 5.4. Rest of Middle East and Africa
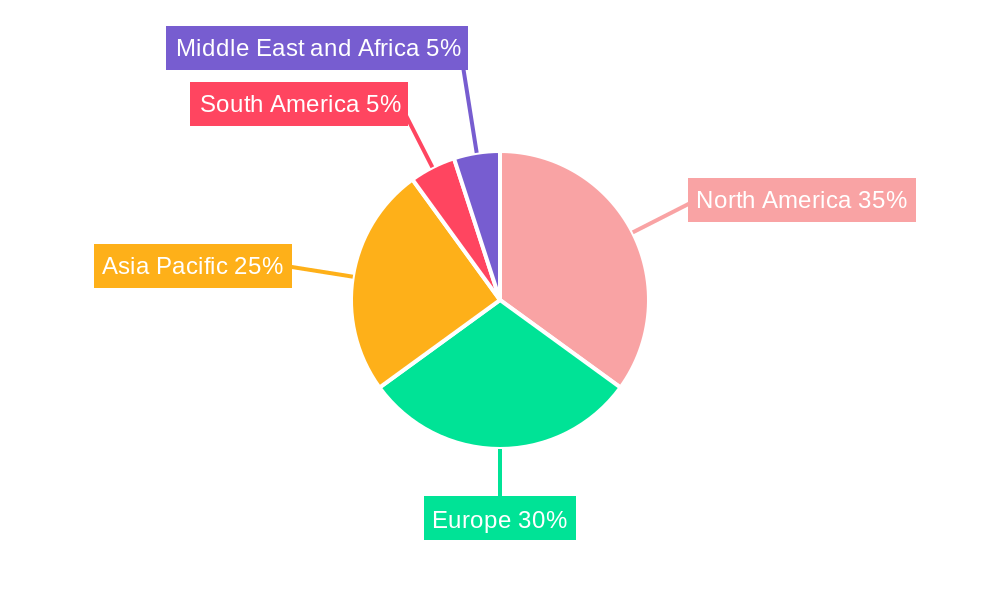
Energy as a Service Industry Regional Market Share
Geographic Coverage of Energy as a Service Industry
Energy as a Service Industry REPORT HIGHLIGHTS
| Aspects | Details |
|---|---|
| Study Period | 2020-2034 |
| Base Year | 2025 |
| Estimated Year | 2026 |
| Forecast Period | 2026-2034 |
| Historical Period | 2020-2025 |
| Growth Rate | CAGR of 12.48% from 2020-2034 |
| Segmentation |
|
Table of Contents
- 1. Introduction
- 1.1. Research Scope
- 1.2. Market Segmentation
- 1.3. Research Objective
- 1.4. Definitions and Assumptions
- 2. Executive Summary
- 2.1. Market Snapshot
- 3. Market Dynamics
- 3.1. Market Drivers
- 3.2. Market Restrains
- 3.3. Market Trends
- 3.4. Market Opportunities
- 4. Market Factor Analysis
- 4.1. Porters Five Forces
- 4.1.1. Bargaining Power of Suppliers
- 4.1.2. Bargaining Power of Buyers
- 4.1.3. Threat of New Entrants
- 4.1.4. Threat of Substitutes
- 4.1.5. Competitive Rivalry
- 4.2. PESTEL analysis
- 4.3. BCG Analysis
- 4.3.1. Stars (High Growth, High Market Share)
- 4.3.2. Cash Cows (Low Growth, High Market Share)
- 4.3.3. Question Mark (High Growth, Low Market Share)
- 4.3.4. Dogs (Low Growth, Low Market Share)
- 4.4. Ansoff Matrix Analysis
- 4.5. Supply Chain Analysis
- 4.6. Regulatory Landscape
- 4.7. Current Market Potential and Opportunity Assessment (TAM–SAM–SOM Framework)
- 4.8. PRI Analyst Note
- 4.1. Porters Five Forces
- 5. Market Analysis, Insights and Forecast 2021-2033
- 5.1. Market Analysis, Insights and Forecast - by End User
- 5.1.1. Commercial
- 5.1.2. Industrial
- 5.2. Market Analysis, Insights and Forecast - by Region
- 5.2.1. North America
- 5.2.2. Europe
- 5.2.3. Asia Pacific
- 5.2.4. South America
- 5.2.5. Middle East and Africa
- 5.1. Market Analysis, Insights and Forecast - by End User
- 6. Global Energy as a Service Industry Analysis, Insights and Forecast, 2021-2033
- 6.1. Market Analysis, Insights and Forecast - by End User
- 6.1.1. Commercial
- 6.1.2. Industrial
- 6.1. Market Analysis, Insights and Forecast - by End User
- 7. North America Energy as a Service Industry Analysis, Insights and Forecast, 2020-2032
- 7.1. Market Analysis, Insights and Forecast - by End User
- 7.1.1. Commercial
- 7.1.2. Industrial
- 7.1. Market Analysis, Insights and Forecast - by End User
- 8. Europe Energy as a Service Industry Analysis, Insights and Forecast, 2020-2032
- 8.1. Market Analysis, Insights and Forecast - by End User
- 8.1.1. Commercial
- 8.1.2. Industrial
- 8.1. Market Analysis, Insights and Forecast - by End User
- 9. Asia Pacific Energy as a Service Industry Analysis, Insights and Forecast, 2020-2032
- 9.1. Market Analysis, Insights and Forecast - by End User
- 9.1.1. Commercial
- 9.1.2. Industrial
- 9.1. Market Analysis, Insights and Forecast - by End User
- 10. South America Energy as a Service Industry Analysis, Insights and Forecast, 2020-2032
- 10.1. Market Analysis, Insights and Forecast - by End User
- 10.1.1. Commercial
- 10.1.2. Industrial
- 10.1. Market Analysis, Insights and Forecast - by End User
- 11. Middle East and Africa Energy as a Service Industry Analysis, Insights and Forecast, 2020-2032
- 11.1. Market Analysis, Insights and Forecast - by End User
- 11.1.1. Commercial
- 11.1.2. Industrial
- 11.1. Market Analysis, Insights and Forecast - by End User
- 12. Competitive Analysis
- 12.1. Company Profiles
- 12.1.1 Honeywell International Inc
- 12.1.1.1. Company Overview
- 12.1.1.2. Products
- 12.1.1.3. Company Financials
- 12.1.1.4. SWOT Analysis
- 12.1.2 Bernhard
- 12.1.2.1. Company Overview
- 12.1.2.2. Products
- 12.1.2.3. Company Financials
- 12.1.2.4. SWOT Analysis
- 12.1.3 Johnson Controls International PLC
- 12.1.3.1. Company Overview
- 12.1.3.2. Products
- 12.1.3.3. Company Financials
- 12.1.3.4. SWOT Analysis
- 12.1.4 Engie SA
- 12.1.4.1. Company Overview
- 12.1.4.2. Products
- 12.1.4.3. Company Financials
- 12.1.4.4. SWOT Analysis
- 12.1.5 Enel SpA
- 12.1.5.1. Company Overview
- 12.1.5.2. Products
- 12.1.5.3. Company Financials
- 12.1.5.4. SWOT Analysis
- 12.1.6 Spark Community Investment Co
- 12.1.6.1. Company Overview
- 12.1.6.2. Products
- 12.1.6.3. Company Financials
- 12.1.6.4. SWOT Analysis
- 12.1.7 Schneider Electric SE
- 12.1.7.1. Company Overview
- 12.1.7.2. Products
- 12.1.7.3. Company Financials
- 12.1.7.4. SWOT Analysis
- 12.1.8 Veolia Environnement SA
- 12.1.8.1. Company Overview
- 12.1.8.2. Products
- 12.1.8.3. Company Financials
- 12.1.8.4. SWOT Analysis
- 12.1.9 Electricite de France (EDF) SA
- 12.1.9.1. Company Overview
- 12.1.9.2. Products
- 12.1.9.3. Company Financials
- 12.1.9.4. SWOT Analysis
- 12.1.1 Honeywell International Inc
- 12.2. Market Entropy
- 12.2.1 Company's Key Areas Served
- 12.2.2 Recent Developments
- 12.3. Company Market Share Analysis 2025
- 12.3.1 Top 5 Companies Market Share Analysis
- 12.3.2 Top 3 Companies Market Share Analysis
- 12.4. List of Potential Customers
- 13. Research Methodology
List of Figures
- Figure 1: Global Energy as a Service Industry Revenue Breakdown (Million, %) by Region 2025 & 2033
- Figure 2: North America Energy as a Service Industry Revenue (Million), by End User 2025 & 2033
- Figure 3: North America Energy as a Service Industry Revenue Share (%), by End User 2025 & 2033
- Figure 4: North America Energy as a Service Industry Revenue (Million), by Country 2025 & 2033
- Figure 5: North America Energy as a Service Industry Revenue Share (%), by Country 2025 & 2033
- Figure 6: Europe Energy as a Service Industry Revenue (Million), by End User 2025 & 2033
- Figure 7: Europe Energy as a Service Industry Revenue Share (%), by End User 2025 & 2033
- Figure 8: Europe Energy as a Service Industry Revenue (Million), by Country 2025 & 2033
- Figure 9: Europe Energy as a Service Industry Revenue Share (%), by Country 2025 & 2033
- Figure 10: Asia Pacific Energy as a Service Industry Revenue (Million), by End User 2025 & 2033
- Figure 11: Asia Pacific Energy as a Service Industry Revenue Share (%), by End User 2025 & 2033
- Figure 12: Asia Pacific Energy as a Service Industry Revenue (Million), by Country 2025 & 2033
- Figure 13: Asia Pacific Energy as a Service Industry Revenue Share (%), by Country 2025 & 2033
- Figure 14: South America Energy as a Service Industry Revenue (Million), by End User 2025 & 2033
- Figure 15: South America Energy as a Service Industry Revenue Share (%), by End User 2025 & 2033
- Figure 16: South America Energy as a Service Industry Revenue (Million), by Country 2025 & 2033
- Figure 17: South America Energy as a Service Industry Revenue Share (%), by Country 2025 & 2033
- Figure 18: Middle East and Africa Energy as a Service Industry Revenue (Million), by End User 2025 & 2033
- Figure 19: Middle East and Africa Energy as a Service Industry Revenue Share (%), by End User 2025 & 2033
- Figure 20: Middle East and Africa Energy as a Service Industry Revenue (Million), by Country 2025 & 2033
- Figure 21: Middle East and Africa Energy as a Service Industry Revenue Share (%), by Country 2025 & 2033
List of Tables
- Table 1: Global Energy as a Service Industry Revenue Million Forecast, by End User 2020 & 2033
- Table 2: Global Energy as a Service Industry Revenue Million Forecast, by Region 2020 & 2033
- Table 3: Global Energy as a Service Industry Revenue Million Forecast, by End User 2020 & 2033
- Table 4: Global Energy as a Service Industry Revenue Million Forecast, by Country 2020 & 2033
- Table 5: United States Energy as a Service Industry Revenue (Million) Forecast, by Application 2020 & 2033
- Table 6: Canada Energy as a Service Industry Revenue (Million) Forecast, by Application 2020 & 2033
- Table 7: Rest of North America Energy as a Service Industry Revenue (Million) Forecast, by Application 2020 & 2033
- Table 8: Global Energy as a Service Industry Revenue Million Forecast, by End User 2020 & 2033
- Table 9: Global Energy as a Service Industry Revenue Million Forecast, by Country 2020 & 2033
- Table 10: Germany Energy as a Service Industry Revenue (Million) Forecast, by Application 2020 & 2033
- Table 11: France Energy as a Service Industry Revenue (Million) Forecast, by Application 2020 & 2033
- Table 12: United Kingdom Energy as a Service Industry Revenue (Million) Forecast, by Application 2020 & 2033
- Table 13: Rest of Europe Energy as a Service Industry Revenue (Million) Forecast, by Application 2020 & 2033
- Table 14: Global Energy as a Service Industry Revenue Million Forecast, by End User 2020 & 2033
- Table 15: Global Energy as a Service Industry Revenue Million Forecast, by Country 2020 & 2033
- Table 16: China Energy as a Service Industry Revenue (Million) Forecast, by Application 2020 & 2033
- Table 17: India Energy as a Service Industry Revenue (Million) Forecast, by Application 2020 & 2033
- Table 18: Japan Energy as a Service Industry Revenue (Million) Forecast, by Application 2020 & 2033
- Table 19: South Korea Energy as a Service Industry Revenue (Million) Forecast, by Application 2020 & 2033
- Table 20: Rest of Asia Pacific Energy as a Service Industry Revenue (Million) Forecast, by Application 2020 & 2033
- Table 21: Global Energy as a Service Industry Revenue Million Forecast, by End User 2020 & 2033
- Table 22: Global Energy as a Service Industry Revenue Million Forecast, by Country 2020 & 2033
- Table 23: Brazil Energy as a Service Industry Revenue (Million) Forecast, by Application 2020 & 2033
- Table 24: Argentina Energy as a Service Industry Revenue (Million) Forecast, by Application 2020 & 2033
- Table 25: Rest of South America Energy as a Service Industry Revenue (Million) Forecast, by Application 2020 & 2033
- Table 26: Global Energy as a Service Industry Revenue Million Forecast, by End User 2020 & 2033
- Table 27: Global Energy as a Service Industry Revenue Million Forecast, by Country 2020 & 2033
- Table 28: Saudi Arabia Energy as a Service Industry Revenue (Million) Forecast, by Application 2020 & 2033
- Table 29: United Arab Emirates Energy as a Service Industry Revenue (Million) Forecast, by Application 2020 & 2033
- Table 30: South Africa Energy as a Service Industry Revenue (Million) Forecast, by Application 2020 & 2033
- Table 31: Rest of Middle East and Africa Energy as a Service Industry Revenue (Million) Forecast, by Application 2020 & 2033
Frequently Asked Questions
1. What is the projected Compound Annual Growth Rate (CAGR) of the Energy as a Service Industry?
The projected CAGR is approximately 12.48%.
2. Which companies are prominent players in the Energy as a Service Industry?
Key companies in the market include Honeywell International Inc, Bernhard, Johnson Controls International PLC, Engie SA, Enel SpA, Spark Community Investment Co, Schneider Electric SE, Veolia Environnement SA, Electricite de France (EDF) SA.
3. What are the main segments of the Energy as a Service Industry?
The market segments include End User.
4. Can you provide details about the market size?
The market size is estimated to be USD 94.16 Million as of 2022.
5. What are some drivers contributing to market growth?
4.; Growing Demand for Energy As A Service4.; Increasing Adoption of Distributed Energy Generation in Commercial and Industrial Sectors.
6. What are the notable trends driving market growth?
Commercial Segment to Dominate the Market.
7. Are there any restraints impacting market growth?
4.; Lack of Awareness in Developing Economies and High Technological Costs.
8. Can you provide examples of recent developments in the market?
April 2023: Capstone Green Energy Corporation announced that its southern U.S. distributor, Lone Star Power Solutions, contracted with a large West Texas energy company to deliver an additional C800S Signature Series microturbine following Energy-as-a-Service (EaaS) for 3.6 MW contract earlier this year.
9. What pricing options are available for accessing the report?
Pricing options include single-user, multi-user, and enterprise licenses priced at USD 4750, USD 5250, and USD 8750 respectively.
10. Is the market size provided in terms of value or volume?
The market size is provided in terms of value, measured in Million.
11. Are there any specific market keywords associated with the report?
Yes, the market keyword associated with the report is "Energy as a Service Industry," which aids in identifying and referencing the specific market segment covered.
12. How do I determine which pricing option suits my needs best?
The pricing options vary based on user requirements and access needs. Individual users may opt for single-user licenses, while businesses requiring broader access may choose multi-user or enterprise licenses for cost-effective access to the report.
13. Are there any additional resources or data provided in the Energy as a Service Industry report?
While the report offers comprehensive insights, it's advisable to review the specific contents or supplementary materials provided to ascertain if additional resources or data are available.
14. How can I stay updated on further developments or reports in the Energy as a Service Industry?
To stay informed about further developments, trends, and reports in the Energy as a Service Industry, consider subscribing to industry newsletters, following relevant companies and organizations, or regularly checking reputable industry news sources and publications.
Methodology
Step 1 - Identification of Relevant Samples Size from Population Database


Step 2 - Approaches for Defining Global Market Size (Value, Volume* & Price*)

Note*: In applicable scenarios
Step 3 - Data Sources
Primary Research
- Web Analytics
- Survey Reports
- Research Institute
- Latest Research Reports
- Opinion Leaders
Secondary Research
- Annual Reports
- White Paper
- Latest Press Release
- Industry Association
- Paid Database
- Investor Presentations

Step 4 - Data Triangulation
Involves using different sources of information in order to increase the validity of a study
These sources are likely to be stakeholders in a program - participants, other researchers, program staff, other community members, and so on.
Then we put all data in single framework & apply various statistical tools to find out the dynamic on the market.
During the analysis stage, feedback from the stakeholder groups would be compared to determine areas of agreement as well as areas of divergence