

Key Insights
The global engineering plastics market is driven by substantial demand from key sectors including automotive, building & construction, and electronics. The automotive industry's focus on lightweighting and electric vehicle (EV) development, alongside the construction sector's need for high-performance materials, are primary growth catalysts. Miniaturization trends in electronics further boost demand for advanced materials. Innovation in specialized resins such as PTFE, PVDF, and PEEK is crucial for achieving superior performance in demanding applications. Geographically, North America and Asia Pacific lead market presence due to robust manufacturing and automotive sectors, while emerging economies offer significant future growth potential.
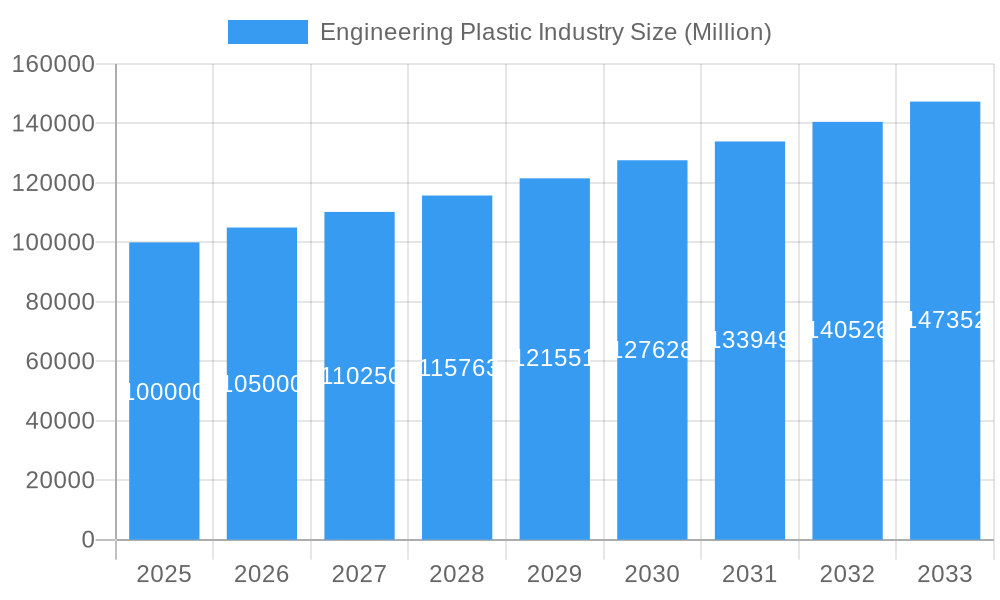
Engineering Plastic Industry Market Size (In Billion)
Market challenges such as raw material price volatility, environmental concerns, and supply chain risks are being addressed through innovations in sustainable engineering plastics and advanced recycling technologies. The market is segmented by resin type, with fluoropolymers, LCPs, and polyamides being key segments, and by end-user industry. The market is projected to expand at a Compound Annual Growth Rate (CAGR) of 8.1%. This growth, from a market size of $165.4 billion in the base year 2025, is supported by continuous technological advancements yielding novel materials with enhanced properties. The competitive landscape is dynamic, characterized by product innovation and strategic collaborations among established and emerging players.
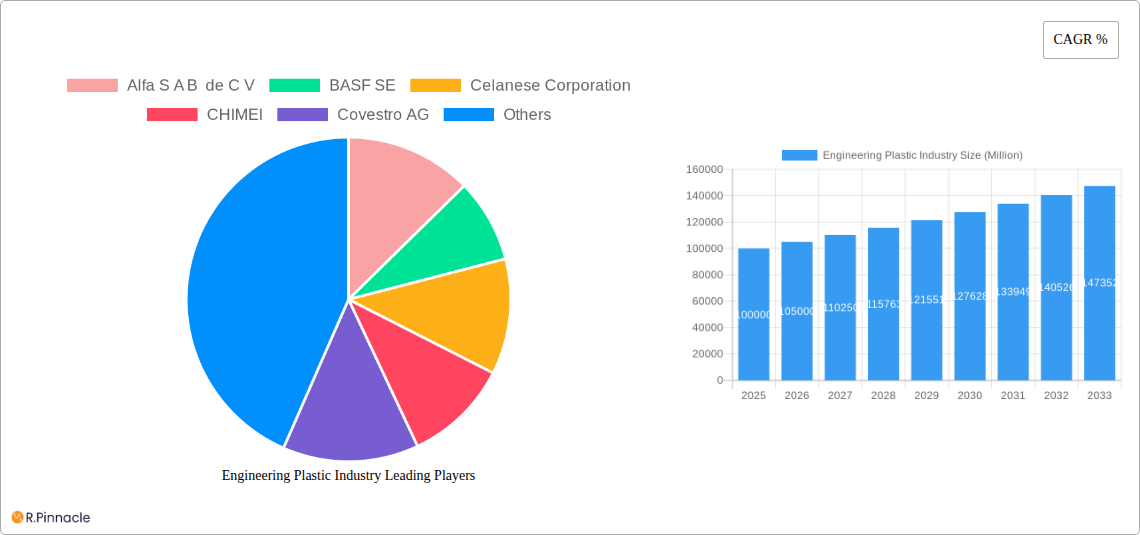
Engineering Plastic Industry Company Market Share
Global Engineering Plastics Market Report: Analysis & Forecast (2025-2033)
This detailed market report delivers critical insights into the global engineering plastics industry for professionals, investors, and stakeholders. It covers the forecast period 2025-2033, with 2025 as the base year. The projected market size for engineering plastics is estimated at $165.4 billion by 2025, indicating significant growth opportunities.
Engineering Plastic Industry Market Structure & Innovation Trends
The engineering plastic market is moderately concentrated, with several key players holding significant market share. Alfa S A B de C V, BASF SE, Celanese Corporation, CHIMEI, Covestro AG, Dongyue Group, DuPont, Far Eastern New Century Corporation, Indorama Ventures Public Company Limited, LG Chem, Mitsubishi Chemical Corporation, SABIC, Solvay, Toray Industries Inc, and Victrex are among the leading companies, collectively controlling an estimated xx% of the global market in 2024. Innovation is driven by the increasing demand for high-performance materials in diverse applications, necessitating advancements in resin types and processing techniques. Regulatory frameworks concerning material safety and environmental impact significantly influence industry practices. Product substitutes, such as bioplastics and metal alloys, pose some competitive pressure, although the unique properties of engineering plastics maintain their dominance in numerous applications. End-user demographics are crucial, with the automotive, aerospace, and electronics sectors exhibiting substantial growth. M&A activities have been moderate, with deal values averaging $XX Million annually in recent years, indicating strategic consolidation within the industry. For example, the market observed a trend of acquisitions to further grow their medical and automotive product lines.
Engineering Plastic Industry Market Dynamics & Trends
The engineering plastic market is experiencing robust growth, driven by several key factors. The increasing adoption of lightweight materials in the automotive and aerospace sectors is a major catalyst, as is the rising demand for durable and high-performance materials in electronics and industrial machinery. Technological advancements in resin synthesis and processing are improving material properties, enhancing product performance, and expanding applications. Consumer preference for durable, sustainable, and aesthetically pleasing products is also driving growth. Competitive dynamics are characterized by intense rivalry among major players, who are constantly innovating to gain market share. The Compound Annual Growth Rate (CAGR) is estimated at xx% during the forecast period, with market penetration increasing significantly in developing economies.
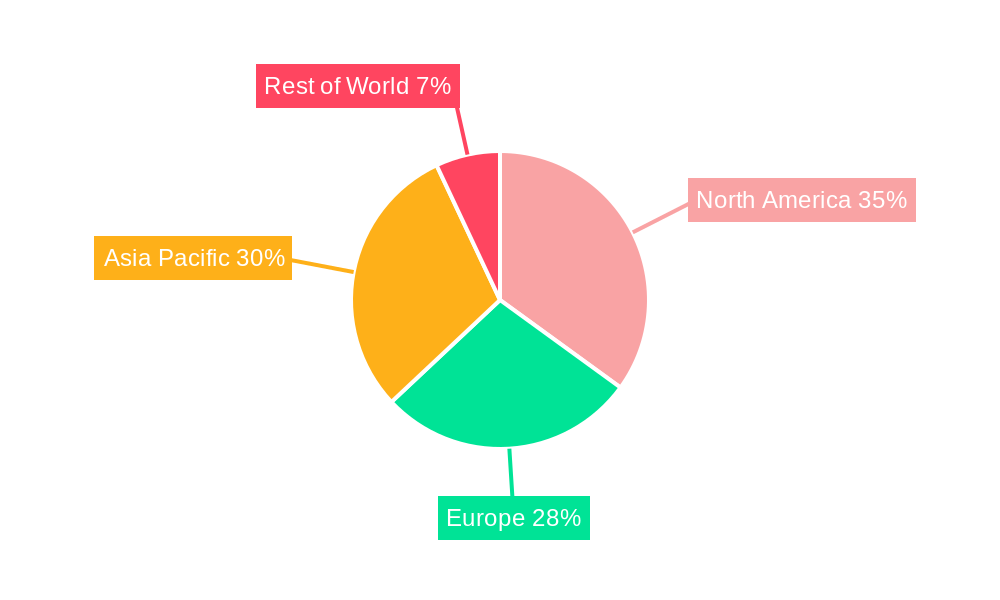
Dominant Regions & Segments in Engineering Plastic Industry
The Asia-Pacific region is currently the dominant market for engineering plastics, driven by rapid industrialization and economic growth in countries like China and India. Within specific segments:
End-User Industries: The automotive industry holds the largest market share, followed by electrical and electronics. Strong growth is projected in the aerospace and building & construction segments. Key drivers include government initiatives promoting infrastructure development, rising disposable incomes, and the adoption of advanced technologies.
Resin Types: Polycarbonate (PC), Polyamide (PA), and Polybutylene Terephthalate (PBT) currently dominate the resin type segment. However, fluoropolymers, especially PTFE and PVDF, are experiencing significant growth due to their exceptional chemical resistance and high-performance properties in specialized applications. Growth in these sub-segments is further fueled by rising demand in various segments.
Growth in these segments is being pushed by factors such as increasing demand in various industries and rapid industrialization in some of the dominant regions.
Engineering Plastic Industry Product Innovations
Recent innovations focus on enhancing material properties, such as improved strength, heat resistance, and chemical resistance. Victrex's new implantable PEEK-OPTIMA polymer for medical devices demonstrates the focus on specialized applications and advanced manufacturing processes like FDM and FFF. Covestro's Makrolon 3638 polycarbonate for healthcare applications highlights the expanding reach of engineering plastics into high-growth sectors. These innovations reflect the industry's focus on meeting the evolving needs of diverse end-user industries, fostering improved product performance, and expanding market reach.
Report Scope & Segmentation Analysis
This report offers a comprehensive analysis of the engineering plastics market, segmented by end-user industry (Aerospace, Automotive, Building & Construction, Electrical & Electronics, Industrial & Machinery, Packaging, Other) and resin type (Fluoropolymer (ETFE, FEP, PTFE, PVF, PVDF, Others), LCP, Polyamide (PA) (Aramid, PA6, PA66, Polyphthalamide), PBT, PC, PEEK, PET, PI, PMMA, POM, Styrene Copolymers (ABS & SAN)). Each segment's market size, growth projections, and competitive dynamics are meticulously analyzed. The report provides detailed insights into the market trends and future growth potential of each segment, allowing businesses to make informed decisions regarding investments and strategic planning.
Key Drivers of Engineering Plastic Industry Growth
Several factors are driving the growth of the engineering plastics industry. The increasing demand for lightweight and high-performance materials in the automotive and aerospace industries, coupled with the expansion of the electronics and industrial machinery sectors, are key contributors. Government regulations promoting sustainable materials and technological advancements in resin production and processing are also driving market expansion. These include the implementation of strict emission standards, leading to the adoption of lightweight materials in various industries.
Challenges in the Engineering Plastic Industry Sector
The engineering plastic industry faces certain challenges. Fluctuations in raw material prices impact profitability, while stringent environmental regulations impose additional costs and complexities. Intense competition among existing players requires constant innovation to maintain a competitive edge. Furthermore, the dependence on global supply chains can be vulnerable to disruptions, impacting production and delivery timelines.
Emerging Opportunities in Engineering Plastic Industry
The engineering plastic industry presents several emerging opportunities. Growing demand for specialized applications in the medical, renewable energy, and 3D printing sectors offers significant potential. Advances in bio-based engineering plastics and recycled content materials are creating new market segments and increasing sustainability efforts. Expansion into developing economies presents substantial growth potential.
Leading Players in the Engineering Plastic Industry Market
- Alfa S A B de C V
- BASF SE
- Celanese Corporation
- CHIMEI
- Covestro AG
- Dongyue Group
- DuPont
- Far Eastern New Century Corporation
- Indorama Ventures Public Company Limited
- LG Chem
- Mitsubishi Chemical Corporation
- SABIC
- Solvay
- Toray Industries Inc
- Victrex
Key Developments in Engineering Plastic Industry
- February 2023: Victrex PLC announced plans to expand its medical division, Invibio Biomaterial Solutions, including a new product development facility in Leeds, UK.
- February 2023: Covestro AG introduced Makrolon 3638 polycarbonate for healthcare and life sciences applications.
- March 2023: Victrex PLC launched a new implantable PEEK-OPTIMA polymer for medical device additives using FDM and FFF.
These developments highlight a focus on innovation in high-growth segments like medical and healthcare.
Future Outlook for Engineering Plastic Industry Market
The engineering plastic industry is poised for continued growth, driven by technological advancements, increasing demand from diverse sectors, and the emergence of new applications. Strategic investments in R&D, expansion into high-growth markets, and sustainable practices will shape the industry's future trajectory. The focus on high-performance, specialized materials will further drive growth and innovation within the sector.
Engineering Plastic Industry Segmentation
-
1. End User Industry
- 1.1. Aerospace
- 1.2. Automotive
- 1.3. Building and Construction
- 1.4. Electrical and Electronics
- 1.5. Industrial and Machinery
- 1.6. Packaging
- 1.7. Other End-user Industries
-
2. Resin Type
-
2.1. Fluoropolymer
-
2.1.1. By Sub Resin Type
- 2.1.1.1. Ethylenetetrafluoroethylene (ETFE)
- 2.1.1.2. Fluorinated Ethylene-propylene (FEP)
- 2.1.1.3. Polytetrafluoroethylene (PTFE)
- 2.1.1.4. Polyvinylfluoride (PVF)
- 2.1.1.5. Polyvinylidene Fluoride (PVDF)
- 2.1.1.6. Other Sub Resin Types
-
2.1.1. By Sub Resin Type
- 2.2. Liquid Crystal Polymer (LCP)
-
2.3. Polyamide (PA)
- 2.3.1. Aramid
- 2.3.2. Polyamide (PA) 6
- 2.3.3. Polyamide (PA) 66
- 2.3.4. Polyphthalamide
- 2.4. Polybutylene Terephthalate (PBT)
- 2.5. Polycarbonate (PC)
- 2.6. Polyether Ether Ketone (PEEK)
- 2.7. Polyethylene Terephthalate (PET)
- 2.8. Polyimide (PI)
- 2.9. Polymethyl Methacrylate (PMMA)
- 2.10. Polyoxymethylene (POM)
- 2.11. Styrene Copolymers (ABS and SAN)
-
2.1. Fluoropolymer
Engineering Plastic Industry Segmentation By Geography
-
1. North America
- 1.1. United States
- 1.2. Canada
- 1.3. Mexico
-
2. South America
- 2.1. Brazil
- 2.2. Argentina
- 2.3. Rest of South America
-
3. Europe
- 3.1. United Kingdom
- 3.2. Germany
- 3.3. France
- 3.4. Italy
- 3.5. Spain
- 3.6. Russia
- 3.7. Benelux
- 3.8. Nordics
- 3.9. Rest of Europe
-
4. Middle East & Africa
- 4.1. Turkey
- 4.2. Israel
- 4.3. GCC
- 4.4. North Africa
- 4.5. South Africa
- 4.6. Rest of Middle East & Africa
-
5. Asia Pacific
- 5.1. China
- 5.2. India
- 5.3. Japan
- 5.4. South Korea
- 5.5. ASEAN
- 5.6. Oceania
- 5.7. Rest of Asia Pacific
Engineering Plastic Industry Regional Market Share
Geographic Coverage of Engineering Plastic Industry
Engineering Plastic Industry REPORT HIGHLIGHTS
| Aspects | Details |
|---|---|
| Study Period | 2020-2034 |
| Base Year | 2025 |
| Estimated Year | 2026 |
| Forecast Period | 2026-2034 |
| Historical Period | 2020-2025 |
| Growth Rate | CAGR of 8.1% from 2020-2034 |
| Segmentation |
|
Table of Contents
- 1. Introduction
- 1.1. Research Scope
- 1.2. Market Segmentation
- 1.3. Research Objective
- 1.4. Definitions and Assumptions
- 2. Executive Summary
- 2.1. Market Snapshot
- 3. Market Dynamics
- 3.1. Market Drivers
- 3.2. Market Restrains
- 3.3. Market Trends
- 3.4. Market Opportunities
- 4. Market Factor Analysis
- 4.1. Porters Five Forces
- 4.1.1. Bargaining Power of Suppliers
- 4.1.2. Bargaining Power of Buyers
- 4.1.3. Threat of New Entrants
- 4.1.4. Threat of Substitutes
- 4.1.5. Competitive Rivalry
- 4.2. PESTEL analysis
- 4.3. BCG Analysis
- 4.3.1. Stars (High Growth, High Market Share)
- 4.3.2. Cash Cows (Low Growth, High Market Share)
- 4.3.3. Question Mark (High Growth, Low Market Share)
- 4.3.4. Dogs (Low Growth, Low Market Share)
- 4.4. Ansoff Matrix Analysis
- 4.5. Supply Chain Analysis
- 4.6. Regulatory Landscape
- 4.7. Current Market Potential and Opportunity Assessment (TAM–SAM–SOM Framework)
- 4.8. PRI Analyst Note
- 4.1. Porters Five Forces
- 5. Market Analysis, Insights and Forecast 2021-2033
- 5.1. Market Analysis, Insights and Forecast - by End User Industry
- 5.1.1. Aerospace
- 5.1.2. Automotive
- 5.1.3. Building and Construction
- 5.1.4. Electrical and Electronics
- 5.1.5. Industrial and Machinery
- 5.1.6. Packaging
- 5.1.7. Other End-user Industries
- 5.2. Market Analysis, Insights and Forecast - by Resin Type
- 5.2.1. Fluoropolymer
- 5.2.1.1. By Sub Resin Type
- 5.2.1.1.1. Ethylenetetrafluoroethylene (ETFE)
- 5.2.1.1.2. Fluorinated Ethylene-propylene (FEP)
- 5.2.1.1.3. Polytetrafluoroethylene (PTFE)
- 5.2.1.1.4. Polyvinylfluoride (PVF)
- 5.2.1.1.5. Polyvinylidene Fluoride (PVDF)
- 5.2.1.1.6. Other Sub Resin Types
- 5.2.1.1. By Sub Resin Type
- 5.2.2. Liquid Crystal Polymer (LCP)
- 5.2.3. Polyamide (PA)
- 5.2.3.1. Aramid
- 5.2.3.2. Polyamide (PA) 6
- 5.2.3.3. Polyamide (PA) 66
- 5.2.3.4. Polyphthalamide
- 5.2.4. Polybutylene Terephthalate (PBT)
- 5.2.5. Polycarbonate (PC)
- 5.2.6. Polyether Ether Ketone (PEEK)
- 5.2.7. Polyethylene Terephthalate (PET)
- 5.2.8. Polyimide (PI)
- 5.2.9. Polymethyl Methacrylate (PMMA)
- 5.2.10. Polyoxymethylene (POM)
- 5.2.11. Styrene Copolymers (ABS and SAN)
- 5.2.1. Fluoropolymer
- 5.3. Market Analysis, Insights and Forecast - by Region
- 5.3.1. North America
- 5.3.2. South America
- 5.3.3. Europe
- 5.3.4. Middle East & Africa
- 5.3.5. Asia Pacific
- 5.1. Market Analysis, Insights and Forecast - by End User Industry
- 6. Global Engineering Plastic Industry Analysis, Insights and Forecast, 2021-2033
- 6.1. Market Analysis, Insights and Forecast - by End User Industry
- 6.1.1. Aerospace
- 6.1.2. Automotive
- 6.1.3. Building and Construction
- 6.1.4. Electrical and Electronics
- 6.1.5. Industrial and Machinery
- 6.1.6. Packaging
- 6.1.7. Other End-user Industries
- 6.2. Market Analysis, Insights and Forecast - by Resin Type
- 6.2.1. Fluoropolymer
- 6.2.1.1. By Sub Resin Type
- 6.2.1.1.1. Ethylenetetrafluoroethylene (ETFE)
- 6.2.1.1.2. Fluorinated Ethylene-propylene (FEP)
- 6.2.1.1.3. Polytetrafluoroethylene (PTFE)
- 6.2.1.1.4. Polyvinylfluoride (PVF)
- 6.2.1.1.5. Polyvinylidene Fluoride (PVDF)
- 6.2.1.1.6. Other Sub Resin Types
- 6.2.1.1. By Sub Resin Type
- 6.2.2. Liquid Crystal Polymer (LCP)
- 6.2.3. Polyamide (PA)
- 6.2.3.1. Aramid
- 6.2.3.2. Polyamide (PA) 6
- 6.2.3.3. Polyamide (PA) 66
- 6.2.3.4. Polyphthalamide
- 6.2.4. Polybutylene Terephthalate (PBT)
- 6.2.5. Polycarbonate (PC)
- 6.2.6. Polyether Ether Ketone (PEEK)
- 6.2.7. Polyethylene Terephthalate (PET)
- 6.2.8. Polyimide (PI)
- 6.2.9. Polymethyl Methacrylate (PMMA)
- 6.2.10. Polyoxymethylene (POM)
- 6.2.11. Styrene Copolymers (ABS and SAN)
- 6.2.1. Fluoropolymer
- 6.1. Market Analysis, Insights and Forecast - by End User Industry
- 7. North America Engineering Plastic Industry Analysis, Insights and Forecast, 2020-2032
- 7.1. Market Analysis, Insights and Forecast - by End User Industry
- 7.1.1. Aerospace
- 7.1.2. Automotive
- 7.1.3. Building and Construction
- 7.1.4. Electrical and Electronics
- 7.1.5. Industrial and Machinery
- 7.1.6. Packaging
- 7.1.7. Other End-user Industries
- 7.2. Market Analysis, Insights and Forecast - by Resin Type
- 7.2.1. Fluoropolymer
- 7.2.1.1. By Sub Resin Type
- 7.2.1.1.1. Ethylenetetrafluoroethylene (ETFE)
- 7.2.1.1.2. Fluorinated Ethylene-propylene (FEP)
- 7.2.1.1.3. Polytetrafluoroethylene (PTFE)
- 7.2.1.1.4. Polyvinylfluoride (PVF)
- 7.2.1.1.5. Polyvinylidene Fluoride (PVDF)
- 7.2.1.1.6. Other Sub Resin Types
- 7.2.1.1. By Sub Resin Type
- 7.2.2. Liquid Crystal Polymer (LCP)
- 7.2.3. Polyamide (PA)
- 7.2.3.1. Aramid
- 7.2.3.2. Polyamide (PA) 6
- 7.2.3.3. Polyamide (PA) 66
- 7.2.3.4. Polyphthalamide
- 7.2.4. Polybutylene Terephthalate (PBT)
- 7.2.5. Polycarbonate (PC)
- 7.2.6. Polyether Ether Ketone (PEEK)
- 7.2.7. Polyethylene Terephthalate (PET)
- 7.2.8. Polyimide (PI)
- 7.2.9. Polymethyl Methacrylate (PMMA)
- 7.2.10. Polyoxymethylene (POM)
- 7.2.11. Styrene Copolymers (ABS and SAN)
- 7.2.1. Fluoropolymer
- 7.1. Market Analysis, Insights and Forecast - by End User Industry
- 8. South America Engineering Plastic Industry Analysis, Insights and Forecast, 2020-2032
- 8.1. Market Analysis, Insights and Forecast - by End User Industry
- 8.1.1. Aerospace
- 8.1.2. Automotive
- 8.1.3. Building and Construction
- 8.1.4. Electrical and Electronics
- 8.1.5. Industrial and Machinery
- 8.1.6. Packaging
- 8.1.7. Other End-user Industries
- 8.2. Market Analysis, Insights and Forecast - by Resin Type
- 8.2.1. Fluoropolymer
- 8.2.1.1. By Sub Resin Type
- 8.2.1.1.1. Ethylenetetrafluoroethylene (ETFE)
- 8.2.1.1.2. Fluorinated Ethylene-propylene (FEP)
- 8.2.1.1.3. Polytetrafluoroethylene (PTFE)
- 8.2.1.1.4. Polyvinylfluoride (PVF)
- 8.2.1.1.5. Polyvinylidene Fluoride (PVDF)
- 8.2.1.1.6. Other Sub Resin Types
- 8.2.1.1. By Sub Resin Type
- 8.2.2. Liquid Crystal Polymer (LCP)
- 8.2.3. Polyamide (PA)
- 8.2.3.1. Aramid
- 8.2.3.2. Polyamide (PA) 6
- 8.2.3.3. Polyamide (PA) 66
- 8.2.3.4. Polyphthalamide
- 8.2.4. Polybutylene Terephthalate (PBT)
- 8.2.5. Polycarbonate (PC)
- 8.2.6. Polyether Ether Ketone (PEEK)
- 8.2.7. Polyethylene Terephthalate (PET)
- 8.2.8. Polyimide (PI)
- 8.2.9. Polymethyl Methacrylate (PMMA)
- 8.2.10. Polyoxymethylene (POM)
- 8.2.11. Styrene Copolymers (ABS and SAN)
- 8.2.1. Fluoropolymer
- 8.1. Market Analysis, Insights and Forecast - by End User Industry
- 9. Europe Engineering Plastic Industry Analysis, Insights and Forecast, 2020-2032
- 9.1. Market Analysis, Insights and Forecast - by End User Industry
- 9.1.1. Aerospace
- 9.1.2. Automotive
- 9.1.3. Building and Construction
- 9.1.4. Electrical and Electronics
- 9.1.5. Industrial and Machinery
- 9.1.6. Packaging
- 9.1.7. Other End-user Industries
- 9.2. Market Analysis, Insights and Forecast - by Resin Type
- 9.2.1. Fluoropolymer
- 9.2.1.1. By Sub Resin Type
- 9.2.1.1.1. Ethylenetetrafluoroethylene (ETFE)
- 9.2.1.1.2. Fluorinated Ethylene-propylene (FEP)
- 9.2.1.1.3. Polytetrafluoroethylene (PTFE)
- 9.2.1.1.4. Polyvinylfluoride (PVF)
- 9.2.1.1.5. Polyvinylidene Fluoride (PVDF)
- 9.2.1.1.6. Other Sub Resin Types
- 9.2.1.1. By Sub Resin Type
- 9.2.2. Liquid Crystal Polymer (LCP)
- 9.2.3. Polyamide (PA)
- 9.2.3.1. Aramid
- 9.2.3.2. Polyamide (PA) 6
- 9.2.3.3. Polyamide (PA) 66
- 9.2.3.4. Polyphthalamide
- 9.2.4. Polybutylene Terephthalate (PBT)
- 9.2.5. Polycarbonate (PC)
- 9.2.6. Polyether Ether Ketone (PEEK)
- 9.2.7. Polyethylene Terephthalate (PET)
- 9.2.8. Polyimide (PI)
- 9.2.9. Polymethyl Methacrylate (PMMA)
- 9.2.10. Polyoxymethylene (POM)
- 9.2.11. Styrene Copolymers (ABS and SAN)
- 9.2.1. Fluoropolymer
- 9.1. Market Analysis, Insights and Forecast - by End User Industry
- 10. Middle East & Africa Engineering Plastic Industry Analysis, Insights and Forecast, 2020-2032
- 10.1. Market Analysis, Insights and Forecast - by End User Industry
- 10.1.1. Aerospace
- 10.1.2. Automotive
- 10.1.3. Building and Construction
- 10.1.4. Electrical and Electronics
- 10.1.5. Industrial and Machinery
- 10.1.6. Packaging
- 10.1.7. Other End-user Industries
- 10.2. Market Analysis, Insights and Forecast - by Resin Type
- 10.2.1. Fluoropolymer
- 10.2.1.1. By Sub Resin Type
- 10.2.1.1.1. Ethylenetetrafluoroethylene (ETFE)
- 10.2.1.1.2. Fluorinated Ethylene-propylene (FEP)
- 10.2.1.1.3. Polytetrafluoroethylene (PTFE)
- 10.2.1.1.4. Polyvinylfluoride (PVF)
- 10.2.1.1.5. Polyvinylidene Fluoride (PVDF)
- 10.2.1.1.6. Other Sub Resin Types
- 10.2.1.1. By Sub Resin Type
- 10.2.2. Liquid Crystal Polymer (LCP)
- 10.2.3. Polyamide (PA)
- 10.2.3.1. Aramid
- 10.2.3.2. Polyamide (PA) 6
- 10.2.3.3. Polyamide (PA) 66
- 10.2.3.4. Polyphthalamide
- 10.2.4. Polybutylene Terephthalate (PBT)
- 10.2.5. Polycarbonate (PC)
- 10.2.6. Polyether Ether Ketone (PEEK)
- 10.2.7. Polyethylene Terephthalate (PET)
- 10.2.8. Polyimide (PI)
- 10.2.9. Polymethyl Methacrylate (PMMA)
- 10.2.10. Polyoxymethylene (POM)
- 10.2.11. Styrene Copolymers (ABS and SAN)
- 10.2.1. Fluoropolymer
- 10.1. Market Analysis, Insights and Forecast - by End User Industry
- 11. Asia Pacific Engineering Plastic Industry Analysis, Insights and Forecast, 2020-2032
- 11.1. Market Analysis, Insights and Forecast - by End User Industry
- 11.1.1. Aerospace
- 11.1.2. Automotive
- 11.1.3. Building and Construction
- 11.1.4. Electrical and Electronics
- 11.1.5. Industrial and Machinery
- 11.1.6. Packaging
- 11.1.7. Other End-user Industries
- 11.2. Market Analysis, Insights and Forecast - by Resin Type
- 11.2.1. Fluoropolymer
- 11.2.1.1. By Sub Resin Type
- 11.2.1.1.1. Ethylenetetrafluoroethylene (ETFE)
- 11.2.1.1.2. Fluorinated Ethylene-propylene (FEP)
- 11.2.1.1.3. Polytetrafluoroethylene (PTFE)
- 11.2.1.1.4. Polyvinylfluoride (PVF)
- 11.2.1.1.5. Polyvinylidene Fluoride (PVDF)
- 11.2.1.1.6. Other Sub Resin Types
- 11.2.1.1. By Sub Resin Type
- 11.2.2. Liquid Crystal Polymer (LCP)
- 11.2.3. Polyamide (PA)
- 11.2.3.1. Aramid
- 11.2.3.2. Polyamide (PA) 6
- 11.2.3.3. Polyamide (PA) 66
- 11.2.3.4. Polyphthalamide
- 11.2.4. Polybutylene Terephthalate (PBT)
- 11.2.5. Polycarbonate (PC)
- 11.2.6. Polyether Ether Ketone (PEEK)
- 11.2.7. Polyethylene Terephthalate (PET)
- 11.2.8. Polyimide (PI)
- 11.2.9. Polymethyl Methacrylate (PMMA)
- 11.2.10. Polyoxymethylene (POM)
- 11.2.11. Styrene Copolymers (ABS and SAN)
- 11.2.1. Fluoropolymer
- 11.1. Market Analysis, Insights and Forecast - by End User Industry
- 12. Competitive Analysis
- 12.1. Company Profiles
- 12.1.1 Alfa S A B de C V
- 12.1.1.1. Company Overview
- 12.1.1.2. Products
- 12.1.1.3. Company Financials
- 12.1.1.4. SWOT Analysis
- 12.1.2 BASF SE
- 12.1.2.1. Company Overview
- 12.1.2.2. Products
- 12.1.2.3. Company Financials
- 12.1.2.4. SWOT Analysis
- 12.1.3 Celanese Corporation
- 12.1.3.1. Company Overview
- 12.1.3.2. Products
- 12.1.3.3. Company Financials
- 12.1.3.4. SWOT Analysis
- 12.1.4 CHIMEI
- 12.1.4.1. Company Overview
- 12.1.4.2. Products
- 12.1.4.3. Company Financials
- 12.1.4.4. SWOT Analysis
- 12.1.5 Covestro AG
- 12.1.5.1. Company Overview
- 12.1.5.2. Products
- 12.1.5.3. Company Financials
- 12.1.5.4. SWOT Analysis
- 12.1.6 Dongyue Group
- 12.1.6.1. Company Overview
- 12.1.6.2. Products
- 12.1.6.3. Company Financials
- 12.1.6.4. SWOT Analysis
- 12.1.7 DuPont
- 12.1.7.1. Company Overview
- 12.1.7.2. Products
- 12.1.7.3. Company Financials
- 12.1.7.4. SWOT Analysis
- 12.1.8 Far Eastern New Century Corporation
- 12.1.8.1. Company Overview
- 12.1.8.2. Products
- 12.1.8.3. Company Financials
- 12.1.8.4. SWOT Analysis
- 12.1.9 Indorama Ventures Public Company Limited
- 12.1.9.1. Company Overview
- 12.1.9.2. Products
- 12.1.9.3. Company Financials
- 12.1.9.4. SWOT Analysis
- 12.1.10 LG Chem
- 12.1.10.1. Company Overview
- 12.1.10.2. Products
- 12.1.10.3. Company Financials
- 12.1.10.4. SWOT Analysis
- 12.1.11 Mitsubishi Chemical Corporation
- 12.1.11.1. Company Overview
- 12.1.11.2. Products
- 12.1.11.3. Company Financials
- 12.1.11.4. SWOT Analysis
- 12.1.12 SABIC
- 12.1.12.1. Company Overview
- 12.1.12.2. Products
- 12.1.12.3. Company Financials
- 12.1.12.4. SWOT Analysis
- 12.1.13 Solvay
- 12.1.13.1. Company Overview
- 12.1.13.2. Products
- 12.1.13.3. Company Financials
- 12.1.13.4. SWOT Analysis
- 12.1.14 Toray Industries Inc
- 12.1.14.1. Company Overview
- 12.1.14.2. Products
- 12.1.14.3. Company Financials
- 12.1.14.4. SWOT Analysis
- 12.1.15 Victre
- 12.1.15.1. Company Overview
- 12.1.15.2. Products
- 12.1.15.3. Company Financials
- 12.1.15.4. SWOT Analysis
- 12.1.1 Alfa S A B de C V
- 12.2. Market Entropy
- 12.2.1 Company's Key Areas Served
- 12.2.2 Recent Developments
- 12.3. Company Market Share Analysis 2025
- 12.3.1 Top 5 Companies Market Share Analysis
- 12.3.2 Top 3 Companies Market Share Analysis
- 12.4. List of Potential Customers
- 13. Research Methodology
List of Figures
- Figure 1: Global Engineering Plastic Industry Revenue Breakdown (billion, %) by Region 2025 & 2033
- Figure 2: North America Engineering Plastic Industry Revenue (billion), by End User Industry 2025 & 2033
- Figure 3: North America Engineering Plastic Industry Revenue Share (%), by End User Industry 2025 & 2033
- Figure 4: North America Engineering Plastic Industry Revenue (billion), by Resin Type 2025 & 2033
- Figure 5: North America Engineering Plastic Industry Revenue Share (%), by Resin Type 2025 & 2033
- Figure 6: North America Engineering Plastic Industry Revenue (billion), by Country 2025 & 2033
- Figure 7: North America Engineering Plastic Industry Revenue Share (%), by Country 2025 & 2033
- Figure 8: South America Engineering Plastic Industry Revenue (billion), by End User Industry 2025 & 2033
- Figure 9: South America Engineering Plastic Industry Revenue Share (%), by End User Industry 2025 & 2033
- Figure 10: South America Engineering Plastic Industry Revenue (billion), by Resin Type 2025 & 2033
- Figure 11: South America Engineering Plastic Industry Revenue Share (%), by Resin Type 2025 & 2033
- Figure 12: South America Engineering Plastic Industry Revenue (billion), by Country 2025 & 2033
- Figure 13: South America Engineering Plastic Industry Revenue Share (%), by Country 2025 & 2033
- Figure 14: Europe Engineering Plastic Industry Revenue (billion), by End User Industry 2025 & 2033
- Figure 15: Europe Engineering Plastic Industry Revenue Share (%), by End User Industry 2025 & 2033
- Figure 16: Europe Engineering Plastic Industry Revenue (billion), by Resin Type 2025 & 2033
- Figure 17: Europe Engineering Plastic Industry Revenue Share (%), by Resin Type 2025 & 2033
- Figure 18: Europe Engineering Plastic Industry Revenue (billion), by Country 2025 & 2033
- Figure 19: Europe Engineering Plastic Industry Revenue Share (%), by Country 2025 & 2033
- Figure 20: Middle East & Africa Engineering Plastic Industry Revenue (billion), by End User Industry 2025 & 2033
- Figure 21: Middle East & Africa Engineering Plastic Industry Revenue Share (%), by End User Industry 2025 & 2033
- Figure 22: Middle East & Africa Engineering Plastic Industry Revenue (billion), by Resin Type 2025 & 2033
- Figure 23: Middle East & Africa Engineering Plastic Industry Revenue Share (%), by Resin Type 2025 & 2033
- Figure 24: Middle East & Africa Engineering Plastic Industry Revenue (billion), by Country 2025 & 2033
- Figure 25: Middle East & Africa Engineering Plastic Industry Revenue Share (%), by Country 2025 & 2033
- Figure 26: Asia Pacific Engineering Plastic Industry Revenue (billion), by End User Industry 2025 & 2033
- Figure 27: Asia Pacific Engineering Plastic Industry Revenue Share (%), by End User Industry 2025 & 2033
- Figure 28: Asia Pacific Engineering Plastic Industry Revenue (billion), by Resin Type 2025 & 2033
- Figure 29: Asia Pacific Engineering Plastic Industry Revenue Share (%), by Resin Type 2025 & 2033
- Figure 30: Asia Pacific Engineering Plastic Industry Revenue (billion), by Country 2025 & 2033
- Figure 31: Asia Pacific Engineering Plastic Industry Revenue Share (%), by Country 2025 & 2033
List of Tables
- Table 1: Global Engineering Plastic Industry Revenue billion Forecast, by End User Industry 2020 & 2033
- Table 2: Global Engineering Plastic Industry Revenue billion Forecast, by Resin Type 2020 & 2033
- Table 3: Global Engineering Plastic Industry Revenue billion Forecast, by Region 2020 & 2033
- Table 4: Global Engineering Plastic Industry Revenue billion Forecast, by End User Industry 2020 & 2033
- Table 5: Global Engineering Plastic Industry Revenue billion Forecast, by Resin Type 2020 & 2033
- Table 6: Global Engineering Plastic Industry Revenue billion Forecast, by Country 2020 & 2033
- Table 7: United States Engineering Plastic Industry Revenue (billion) Forecast, by Application 2020 & 2033
- Table 8: Canada Engineering Plastic Industry Revenue (billion) Forecast, by Application 2020 & 2033
- Table 9: Mexico Engineering Plastic Industry Revenue (billion) Forecast, by Application 2020 & 2033
- Table 10: Global Engineering Plastic Industry Revenue billion Forecast, by End User Industry 2020 & 2033
- Table 11: Global Engineering Plastic Industry Revenue billion Forecast, by Resin Type 2020 & 2033
- Table 12: Global Engineering Plastic Industry Revenue billion Forecast, by Country 2020 & 2033
- Table 13: Brazil Engineering Plastic Industry Revenue (billion) Forecast, by Application 2020 & 2033
- Table 14: Argentina Engineering Plastic Industry Revenue (billion) Forecast, by Application 2020 & 2033
- Table 15: Rest of South America Engineering Plastic Industry Revenue (billion) Forecast, by Application 2020 & 2033
- Table 16: Global Engineering Plastic Industry Revenue billion Forecast, by End User Industry 2020 & 2033
- Table 17: Global Engineering Plastic Industry Revenue billion Forecast, by Resin Type 2020 & 2033
- Table 18: Global Engineering Plastic Industry Revenue billion Forecast, by Country 2020 & 2033
- Table 19: United Kingdom Engineering Plastic Industry Revenue (billion) Forecast, by Application 2020 & 2033
- Table 20: Germany Engineering Plastic Industry Revenue (billion) Forecast, by Application 2020 & 2033
- Table 21: France Engineering Plastic Industry Revenue (billion) Forecast, by Application 2020 & 2033
- Table 22: Italy Engineering Plastic Industry Revenue (billion) Forecast, by Application 2020 & 2033
- Table 23: Spain Engineering Plastic Industry Revenue (billion) Forecast, by Application 2020 & 2033
- Table 24: Russia Engineering Plastic Industry Revenue (billion) Forecast, by Application 2020 & 2033
- Table 25: Benelux Engineering Plastic Industry Revenue (billion) Forecast, by Application 2020 & 2033
- Table 26: Nordics Engineering Plastic Industry Revenue (billion) Forecast, by Application 2020 & 2033
- Table 27: Rest of Europe Engineering Plastic Industry Revenue (billion) Forecast, by Application 2020 & 2033
- Table 28: Global Engineering Plastic Industry Revenue billion Forecast, by End User Industry 2020 & 2033
- Table 29: Global Engineering Plastic Industry Revenue billion Forecast, by Resin Type 2020 & 2033
- Table 30: Global Engineering Plastic Industry Revenue billion Forecast, by Country 2020 & 2033
- Table 31: Turkey Engineering Plastic Industry Revenue (billion) Forecast, by Application 2020 & 2033
- Table 32: Israel Engineering Plastic Industry Revenue (billion) Forecast, by Application 2020 & 2033
- Table 33: GCC Engineering Plastic Industry Revenue (billion) Forecast, by Application 2020 & 2033
- Table 34: North Africa Engineering Plastic Industry Revenue (billion) Forecast, by Application 2020 & 2033
- Table 35: South Africa Engineering Plastic Industry Revenue (billion) Forecast, by Application 2020 & 2033
- Table 36: Rest of Middle East & Africa Engineering Plastic Industry Revenue (billion) Forecast, by Application 2020 & 2033
- Table 37: Global Engineering Plastic Industry Revenue billion Forecast, by End User Industry 2020 & 2033
- Table 38: Global Engineering Plastic Industry Revenue billion Forecast, by Resin Type 2020 & 2033
- Table 39: Global Engineering Plastic Industry Revenue billion Forecast, by Country 2020 & 2033
- Table 40: China Engineering Plastic Industry Revenue (billion) Forecast, by Application 2020 & 2033
- Table 41: India Engineering Plastic Industry Revenue (billion) Forecast, by Application 2020 & 2033
- Table 42: Japan Engineering Plastic Industry Revenue (billion) Forecast, by Application 2020 & 2033
- Table 43: South Korea Engineering Plastic Industry Revenue (billion) Forecast, by Application 2020 & 2033
- Table 44: ASEAN Engineering Plastic Industry Revenue (billion) Forecast, by Application 2020 & 2033
- Table 45: Oceania Engineering Plastic Industry Revenue (billion) Forecast, by Application 2020 & 2033
- Table 46: Rest of Asia Pacific Engineering Plastic Industry Revenue (billion) Forecast, by Application 2020 & 2033
Frequently Asked Questions
1. What is the projected Compound Annual Growth Rate (CAGR) of the Engineering Plastic Industry?
The projected CAGR is approximately 8.1%.
2. Which companies are prominent players in the Engineering Plastic Industry?
Key companies in the market include Alfa S A B de C V, BASF SE, Celanese Corporation, CHIMEI, Covestro AG, Dongyue Group, DuPont, Far Eastern New Century Corporation, Indorama Ventures Public Company Limited, LG Chem, Mitsubishi Chemical Corporation, SABIC, Solvay, Toray Industries Inc, Victre.
3. What are the main segments of the Engineering Plastic Industry?
The market segments include End User Industry, Resin Type.
4. Can you provide details about the market size?
The market size is estimated to be USD 165.4 billion as of 2022.
5. What are some drivers contributing to market growth?
N/A
6. What are the notable trends driving market growth?
OTHER KEY INDUSTRY TRENDS COVERED IN THE REPORT.
7. Are there any restraints impacting market growth?
N/A
8. Can you provide examples of recent developments in the market?
March 2023: Victrex PLC introduced a new type of implantable PEEK-OPTIMA polymer that is specifically designed for use in the manufacturing processes of medical device additives, such as fused deposition modeling (FDM) and fused filament fabrication (FFF).February 2023: Victrex PLC revealed its plans to invest in the expansion of its medical division, Invibio Biomaterial Solutions, which includes establishing a new product development facility in Leeds, United Kingdom.February 2023: Covestro AG introduced Makrolon 3638 polycarbonate for healthcare and life sciences applications such as drug delivery devices, wellness and wearable devices, and single-use containers for biopharmaceutical manufacturing.
9. What pricing options are available for accessing the report?
Pricing options include single-user, multi-user, and enterprise licenses priced at USD 3800, USD 4500, and USD 5800 respectively.
10. Is the market size provided in terms of value or volume?
The market size is provided in terms of value, measured in billion.
11. Are there any specific market keywords associated with the report?
Yes, the market keyword associated with the report is "Engineering Plastic Industry," which aids in identifying and referencing the specific market segment covered.
12. How do I determine which pricing option suits my needs best?
The pricing options vary based on user requirements and access needs. Individual users may opt for single-user licenses, while businesses requiring broader access may choose multi-user or enterprise licenses for cost-effective access to the report.
13. Are there any additional resources or data provided in the Engineering Plastic Industry report?
While the report offers comprehensive insights, it's advisable to review the specific contents or supplementary materials provided to ascertain if additional resources or data are available.
14. How can I stay updated on further developments or reports in the Engineering Plastic Industry?
To stay informed about further developments, trends, and reports in the Engineering Plastic Industry, consider subscribing to industry newsletters, following relevant companies and organizations, or regularly checking reputable industry news sources and publications.
Methodology
Step 1 - Identification of Relevant Samples Size from Population Database


Step 2 - Approaches for Defining Global Market Size (Value, Volume* & Price*)

Note*: In applicable scenarios
Step 3 - Data Sources
Primary Research
- Web Analytics
- Survey Reports
- Research Institute
- Latest Research Reports
- Opinion Leaders
Secondary Research
- Annual Reports
- White Paper
- Latest Press Release
- Industry Association
- Paid Database
- Investor Presentations

Step 4 - Data Triangulation
Involves using different sources of information in order to increase the validity of a study
These sources are likely to be stakeholders in a program - participants, other researchers, program staff, other community members, and so on.
Then we put all data in single framework & apply various statistical tools to find out the dynamic on the market.
During the analysis stage, feedback from the stakeholder groups would be compared to determine areas of agreement as well as areas of divergence