

Key Insights
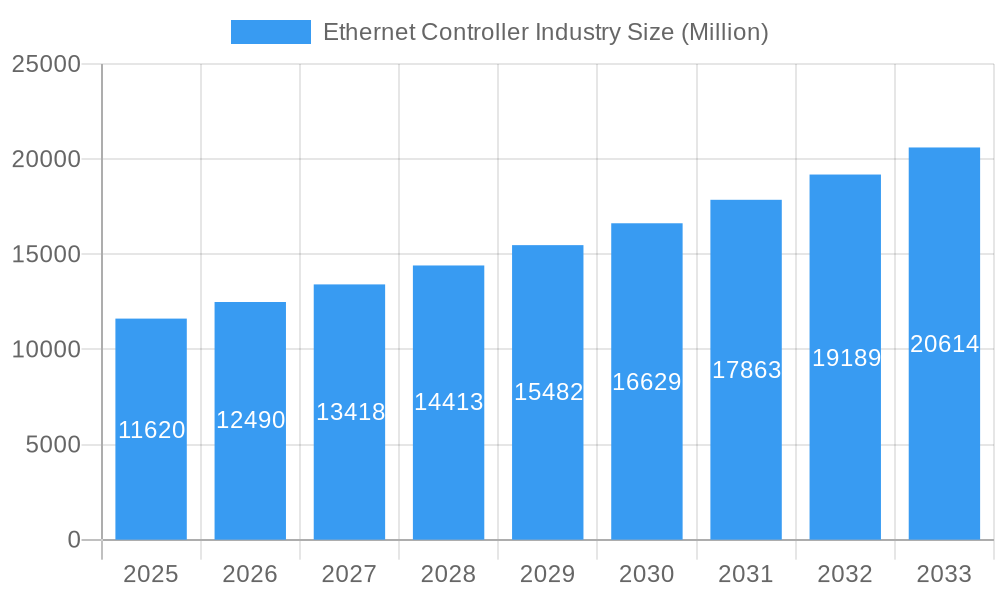
The Ethernet controller market, valued at $11.62 billion in 2025, is poised for robust growth, projected to expand at a compound annual growth rate (CAGR) of 7.42% from 2025 to 2033. This expansion is driven by several key factors. The increasing adoption of high-speed internet and data centers fuels demand for faster Ethernet controllers, particularly Gigabit Ethernet and beyond. The proliferation of smart devices and the Internet of Things (IoT) further contributes to market growth, requiring efficient and reliable network connectivity solutions. Growth in cloud computing and the increasing need for robust network infrastructure in enterprises also significantly boosts demand. Segmentation reveals a diverse market, with servers and routers/switches dominating the end-user segment, followed by a rapidly expanding consumer applications sector. Technological advancements, such as the development of more energy-efficient and higher-bandwidth Ethernet controllers, are further fueling market expansion. However, potential restraints include price fluctuations in raw materials and the increasing complexity of controller designs. Geographic analysis indicates strong growth across North America and Asia Pacific, driven by robust technological adoption and substantial investments in infrastructure development.
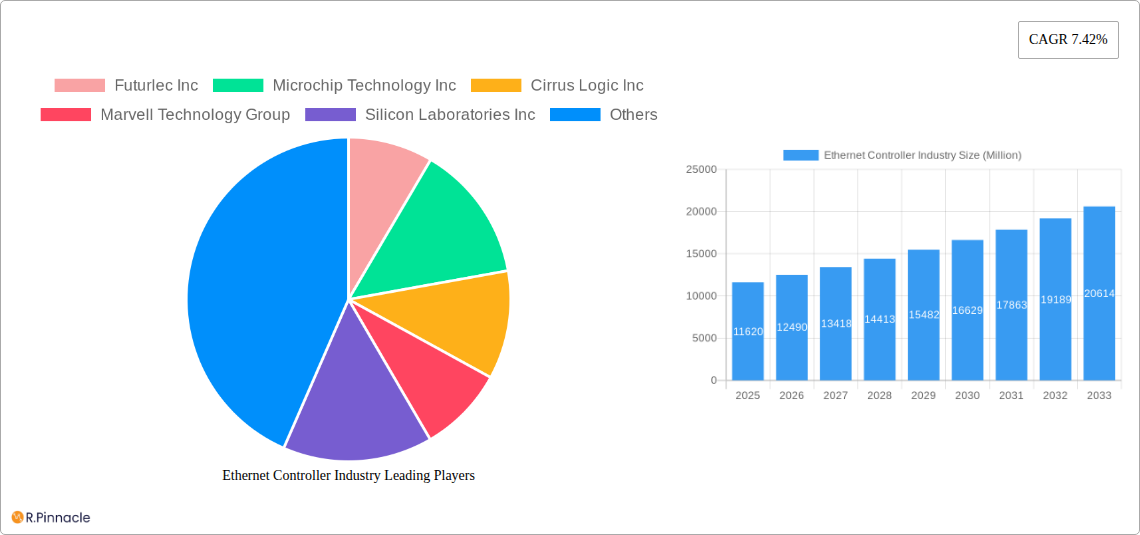
Ethernet Controller Industry Market Size (In Billion)
The competitive landscape is characterized by established players like Broadcom, Intel, and Texas Instruments, alongside emerging companies focusing on innovation and niche applications. Strategic partnerships, acquisitions, and continuous product development are vital for maintaining competitiveness. The market is expected to witness significant consolidation as companies strive to offer comprehensive solutions integrating various functionalities within their Ethernet controller offerings. Future growth will depend on continuous innovation in areas such as power efficiency, bandwidth capabilities, and integration with other technologies. The increasing adoption of 5G and the expansion of edge computing are anticipated to significantly influence market dynamics in the coming years, presenting both opportunities and challenges for market participants. This necessitates continuous monitoring of technological advancements and evolving industry trends to maintain a competitive edge in this dynamic market.
Ethernet Controller Industry Company Market Share
Ethernet Controller Industry Market Report: 2019-2033
This comprehensive report provides an in-depth analysis of the Ethernet Controller industry, offering valuable insights for industry professionals, investors, and strategists. Covering the period from 2019 to 2033, with a focus on 2025, this report meticulously examines market dynamics, technological advancements, and competitive landscapes to provide a clear understanding of the industry's current state and future trajectory. The global Ethernet Controller market is projected to reach xx Million by 2033.
Ethernet Controller Industry Market Structure & Innovation Trends
The Ethernet Controller market exhibits a moderately concentrated structure, with key players such as Broadcom Inc, Intel Corporation, and Texas Instruments Incorporated holding significant market share. However, the presence of several smaller, specialized players fosters competition and innovation. Market share dynamics are influenced by factors including technological advancements, M&A activities, and regulatory changes. Innovation is driven by increasing demand for higher bandwidths, lower power consumption, and improved integration capabilities. Regulatory frameworks, such as those related to data security and environmental standards, also play a crucial role. Product substitutes, such as other networking technologies, pose a moderate competitive threat, while the end-user demographics continue to evolve with the expansion of connected devices and the growth of data centers. M&A activity in the sector has been significant, with deal values exceeding xx Million in recent years. These transactions have contributed to market consolidation and the integration of new technologies.
- Key Players: Broadcom Inc, Intel Corporation, Texas Instruments Incorporated, and others.
- Market Concentration: Moderately Concentrated
- M&A Deal Value (2019-2024): xx Million
Ethernet Controller Industry Market Dynamics & Trends
The Ethernet Controller market is experiencing robust growth, driven by the increasing adoption of high-bandwidth applications, the expansion of data centers, and the proliferation of connected devices in various sectors. Technological disruptions, such as the development of single-pair Ethernet and advanced PHY technologies, are shaping market dynamics, while consumer preferences for faster, more reliable network connections fuel market expansion. The competitive landscape is characterized by intense rivalry among established players and emerging companies. The Compound Annual Growth Rate (CAGR) for the forecast period (2025-2033) is estimated at xx%, with market penetration rates increasing steadily across different end-user segments.
Dominant Regions & Segments in Ethernet Controller Industry
North America currently holds the leading position in the Ethernet Controller market, driven by robust technological advancements and a high concentration of data centers. However, Asia-Pacific is projected to experience significant growth in the coming years, fueled by rapid infrastructure development and expanding consumer electronics markets.
Key Drivers by Segment:
- By Function:
- PHY (Physical Layer): Driven by demand for high-speed interfaces and improved signal integrity.
- Integrated: Driven by the need for compact and cost-effective solutions.
- By End Users:
- Servers, Routers, and Switches: High growth due to data center expansion and cloud computing adoption.
- Consumer Applications: Driven by the increasing use of smart devices and high-bandwidth internet access.
- Other End Users: Includes industrial automation, automotive, and medical applications exhibiting moderate but steady growth.
- By Bandwidth Type:
- Gigabit Ethernet: Remains the dominant segment due to widespread adoption.
- Switch Ethernet: Experiencing growth fueled by the increasing need for high-speed switching capabilities in data centers and networks.
- Fast Ethernet: Maintaining a niche segment serving legacy applications and cost-sensitive applications.
Ethernet Controller Industry Product Innovations
Recent product innovations focus on increased bandwidth, lower power consumption, and enhanced integration capabilities. The development of single-pair Ethernet (SPE) is a significant advancement, enabling simpler and more cost-effective network solutions in applications such as industrial automation and automotive. The market is witnessing a move towards higher-speed Ethernet solutions, with the adoption of 400GbE and 800GbE technologies increasing. These innovations aim to address the rising demand for higher bandwidth in data centers and other high-performance applications. The focus is on solutions that offer improved energy efficiency and a smaller footprint, catering to the needs of both high-performance and cost-sensitive applications.
Report Scope & Segmentation Analysis
This report segments the Ethernet Controller market by function (PHY, Integrated), end-user (Servers, Routers and Switches, Consumer Applications, Other End Users), and bandwidth type (Fast Ethernet, Gigabit Ethernet, Switch Ethernet). Each segment's growth projections, market sizes, and competitive dynamics are analyzed. The market size for each segment is expected to experience significant growth over the forecast period. The competitive dynamics within each segment are shaped by factors such as technological innovation, pricing strategies, and market penetration.
Key Drivers of Ethernet Controller Industry Growth
The Ethernet Controller market is driven by several factors including the increasing adoption of cloud computing and data centers, the growth of the Internet of Things (IoT), the rising demand for high-speed data transmission, and the expansion of 5G networks. Advancements in semiconductor technology, government initiatives promoting digital infrastructure, and increasing investments in research and development further contribute to market expansion.
Challenges in the Ethernet Controller Industry Sector
Challenges include intense competition, the high cost of research and development, supply chain disruptions, and the need for continuous technological innovation to keep up with the rapid pace of technological advancements in the networking industry. These factors can impact profitability and market share.
Emerging Opportunities in Ethernet Controller Industry
Emerging opportunities lie in the expansion of 5G networks, the growth of the automotive and industrial IoT markets, and the adoption of high-speed Ethernet technologies in new applications. The development of more energy-efficient and cost-effective solutions will also present significant opportunities for market growth. The increasing demand for improved security features in Ethernet controllers also presents opportunities.
Leading Players in the Ethernet Controller Industry Market
Key Developments in Ethernet Controller Industry
- October 2023: Mouser Electronics Inc. offers Microchip Technology's LAN8650 and LAN8651 industrial-grade single-pair Ethernet switches, expanding options for low-speed device integration in automotive and industrial applications.
- March 2024: NVIDIA unveils the NVIDIA Blackwell platform, significantly reducing cost and energy consumption for real-time generative AI, paired with advanced 800Gb/s networking solutions (Quantum-X800 InfiniBand and Spectrum-X800 Ethernet).
Future Outlook for Ethernet Controller Industry Market
The Ethernet Controller market is poised for continued growth, driven by the increasing demand for high-bandwidth networking solutions in data centers, cloud computing, and various other applications. Strategic partnerships, technological innovation, and the expansion into new markets will be crucial for continued success in this dynamic industry. The focus on energy efficiency and cost optimization will further shape market opportunities.
Ethernet Controller Industry Segmentation
-
1. Bandwidth Type
- 1.1. Fast Ethernet
- 1.2. Gigabit Ethernet
- 1.3. Switch Ethernet
-
2. Function
- 2.1. PHY (Physical Layer)
- 2.2. Integrated
-
3. End Users
- 3.1. Servers
- 3.2. Routers and Switches
- 3.3. Consumer Applications
- 3.4. Other End Users
Ethernet Controller Industry Segmentation By Geography
-
1. North America
- 1.1. United States
- 1.2. Canada
-
2. Europe
- 2.1. Germany
- 2.2. United Kingdom
- 2.3. France
-
3. Asia
- 3.1. India
- 3.2. China
- 3.3. Japan
- 4. Australia and New Zealand
- 5. Latin America
- 6. Middle East and Africa
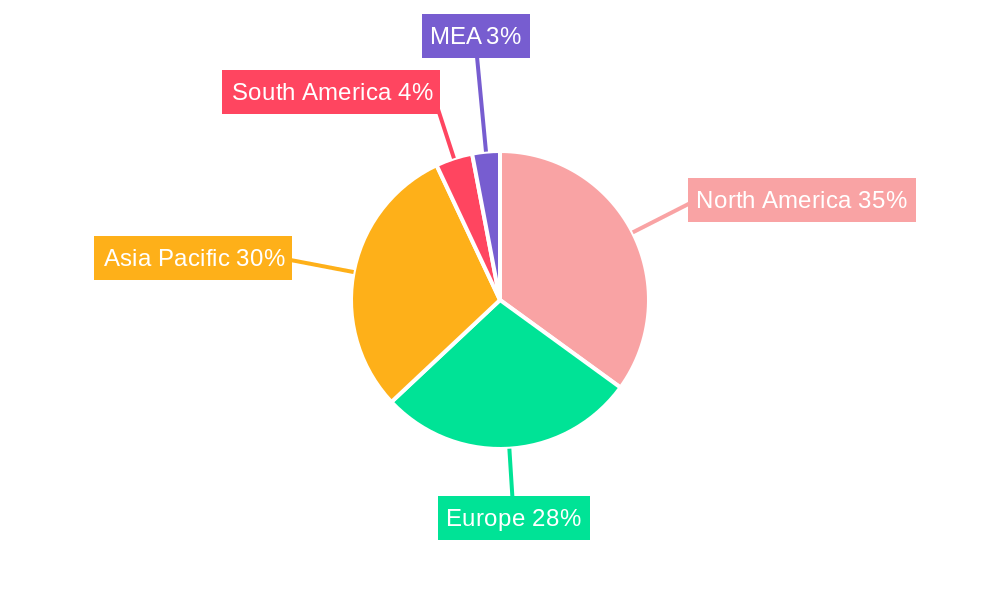
Ethernet Controller Industry Regional Market Share
Geographic Coverage of Ethernet Controller Industry
Ethernet Controller Industry REPORT HIGHLIGHTS
| Aspects | Details |
|---|---|
| Study Period | 2020-2034 |
| Base Year | 2025 |
| Estimated Year | 2026 |
| Forecast Period | 2026-2034 |
| Historical Period | 2020-2025 |
| Growth Rate | CAGR of 7.42% from 2020-2034 |
| Segmentation |
|
Table of Contents
- 1. Introduction
- 1.1. Research Scope
- 1.2. Market Segmentation
- 1.3. Research Objective
- 1.4. Definitions and Assumptions
- 2. Executive Summary
- 2.1. Market Snapshot
- 3. Market Dynamics
- 3.1. Market Drivers
- 3.2. Market Restrains
- 3.3. Market Trends
- 3.4. Market Opportunities
- 4. Market Factor Analysis
- 4.1. Porters Five Forces
- 4.1.1. Bargaining Power of Suppliers
- 4.1.2. Bargaining Power of Buyers
- 4.1.3. Threat of New Entrants
- 4.1.4. Threat of Substitutes
- 4.1.5. Competitive Rivalry
- 4.2. PESTEL analysis
- 4.3. BCG Analysis
- 4.3.1. Stars (High Growth, High Market Share)
- 4.3.2. Cash Cows (Low Growth, High Market Share)
- 4.3.3. Question Mark (High Growth, Low Market Share)
- 4.3.4. Dogs (Low Growth, Low Market Share)
- 4.4. Ansoff Matrix Analysis
- 4.5. Supply Chain Analysis
- 4.6. Regulatory Landscape
- 4.7. Current Market Potential and Opportunity Assessment (TAM–SAM–SOM Framework)
- 4.8. PRI Analyst Note
- 4.1. Porters Five Forces
- 5. Market Analysis, Insights and Forecast 2021-2033
- 5.1. Market Analysis, Insights and Forecast - by Bandwidth Type
- 5.1.1. Fast Ethernet
- 5.1.2. Gigabit Ethernet
- 5.1.3. Switch Ethernet
- 5.2. Market Analysis, Insights and Forecast - by Function
- 5.2.1. PHY (Physical Layer)
- 5.2.2. Integrated
- 5.3. Market Analysis, Insights and Forecast - by End Users
- 5.3.1. Servers
- 5.3.2. Routers and Switches
- 5.3.3. Consumer Applications
- 5.3.4. Other End Users
- 5.4. Market Analysis, Insights and Forecast - by Region
- 5.4.1. North America
- 5.4.2. Europe
- 5.4.3. Asia
- 5.4.4. Australia and New Zealand
- 5.4.5. Latin America
- 5.4.6. Middle East and Africa
- 5.1. Market Analysis, Insights and Forecast - by Bandwidth Type
- 6. Global Ethernet Controller Industry Analysis, Insights and Forecast, 2021-2033
- 6.1. Market Analysis, Insights and Forecast - by Bandwidth Type
- 6.1.1. Fast Ethernet
- 6.1.2. Gigabit Ethernet
- 6.1.3. Switch Ethernet
- 6.2. Market Analysis, Insights and Forecast - by Function
- 6.2.1. PHY (Physical Layer)
- 6.2.2. Integrated
- 6.3. Market Analysis, Insights and Forecast - by End Users
- 6.3.1. Servers
- 6.3.2. Routers and Switches
- 6.3.3. Consumer Applications
- 6.3.4. Other End Users
- 6.1. Market Analysis, Insights and Forecast - by Bandwidth Type
- 7. North America Ethernet Controller Industry Analysis, Insights and Forecast, 2020-2032
- 7.1. Market Analysis, Insights and Forecast - by Bandwidth Type
- 7.1.1. Fast Ethernet
- 7.1.2. Gigabit Ethernet
- 7.1.3. Switch Ethernet
- 7.2. Market Analysis, Insights and Forecast - by Function
- 7.2.1. PHY (Physical Layer)
- 7.2.2. Integrated
- 7.3. Market Analysis, Insights and Forecast - by End Users
- 7.3.1. Servers
- 7.3.2. Routers and Switches
- 7.3.3. Consumer Applications
- 7.3.4. Other End Users
- 7.1. Market Analysis, Insights and Forecast - by Bandwidth Type
- 8. Europe Ethernet Controller Industry Analysis, Insights and Forecast, 2020-2032
- 8.1. Market Analysis, Insights and Forecast - by Bandwidth Type
- 8.1.1. Fast Ethernet
- 8.1.2. Gigabit Ethernet
- 8.1.3. Switch Ethernet
- 8.2. Market Analysis, Insights and Forecast - by Function
- 8.2.1. PHY (Physical Layer)
- 8.2.2. Integrated
- 8.3. Market Analysis, Insights and Forecast - by End Users
- 8.3.1. Servers
- 8.3.2. Routers and Switches
- 8.3.3. Consumer Applications
- 8.3.4. Other End Users
- 8.1. Market Analysis, Insights and Forecast - by Bandwidth Type
- 9. Asia Ethernet Controller Industry Analysis, Insights and Forecast, 2020-2032
- 9.1. Market Analysis, Insights and Forecast - by Bandwidth Type
- 9.1.1. Fast Ethernet
- 9.1.2. Gigabit Ethernet
- 9.1.3. Switch Ethernet
- 9.2. Market Analysis, Insights and Forecast - by Function
- 9.2.1. PHY (Physical Layer)
- 9.2.2. Integrated
- 9.3. Market Analysis, Insights and Forecast - by End Users
- 9.3.1. Servers
- 9.3.2. Routers and Switches
- 9.3.3. Consumer Applications
- 9.3.4. Other End Users
- 9.1. Market Analysis, Insights and Forecast - by Bandwidth Type
- 10. Australia and New Zealand Ethernet Controller Industry Analysis, Insights and Forecast, 2020-2032
- 10.1. Market Analysis, Insights and Forecast - by Bandwidth Type
- 10.1.1. Fast Ethernet
- 10.1.2. Gigabit Ethernet
- 10.1.3. Switch Ethernet
- 10.2. Market Analysis, Insights and Forecast - by Function
- 10.2.1. PHY (Physical Layer)
- 10.2.2. Integrated
- 10.3. Market Analysis, Insights and Forecast - by End Users
- 10.3.1. Servers
- 10.3.2. Routers and Switches
- 10.3.3. Consumer Applications
- 10.3.4. Other End Users
- 10.1. Market Analysis, Insights and Forecast - by Bandwidth Type
- 11. Latin America Ethernet Controller Industry Analysis, Insights and Forecast, 2020-2032
- 11.1. Market Analysis, Insights and Forecast - by Bandwidth Type
- 11.1.1. Fast Ethernet
- 11.1.2. Gigabit Ethernet
- 11.1.3. Switch Ethernet
- 11.2. Market Analysis, Insights and Forecast - by Function
- 11.2.1. PHY (Physical Layer)
- 11.2.2. Integrated
- 11.3. Market Analysis, Insights and Forecast - by End Users
- 11.3.1. Servers
- 11.3.2. Routers and Switches
- 11.3.3. Consumer Applications
- 11.3.4. Other End Users
- 11.1. Market Analysis, Insights and Forecast - by Bandwidth Type
- 12. Middle East and Africa Ethernet Controller Industry Analysis, Insights and Forecast, 2020-2032
- 12.1. Market Analysis, Insights and Forecast - by Bandwidth Type
- 12.1.1. Fast Ethernet
- 12.1.2. Gigabit Ethernet
- 12.1.3. Switch Ethernet
- 12.2. Market Analysis, Insights and Forecast - by Function
- 12.2.1. PHY (Physical Layer)
- 12.2.2. Integrated
- 12.3. Market Analysis, Insights and Forecast - by End Users
- 12.3.1. Servers
- 12.3.2. Routers and Switches
- 12.3.3. Consumer Applications
- 12.3.4. Other End Users
- 12.1. Market Analysis, Insights and Forecast - by Bandwidth Type
- 13. Competitive Analysis
- 13.1. Company Profiles
- 13.1.1 Futurlec Inc
- 13.1.1.1. Company Overview
- 13.1.1.2. Products
- 13.1.1.3. Company Financials
- 13.1.1.4. SWOT Analysis
- 13.1.2 Microchip Technology Inc
- 13.1.2.1. Company Overview
- 13.1.2.2. Products
- 13.1.2.3. Company Financials
- 13.1.2.4. SWOT Analysis
- 13.1.3 Cirrus Logic Inc
- 13.1.3.1. Company Overview
- 13.1.3.2. Products
- 13.1.3.3. Company Financials
- 13.1.3.4. SWOT Analysis
- 13.1.4 Marvell Technology Group
- 13.1.4.1. Company Overview
- 13.1.4.2. Products
- 13.1.4.3. Company Financials
- 13.1.4.4. SWOT Analysis
- 13.1.5 Silicon Laboratories Inc
- 13.1.5.1. Company Overview
- 13.1.5.2. Products
- 13.1.5.3. Company Financials
- 13.1.5.4. SWOT Analysis
- 13.1.6 Broadcom Inc
- 13.1.6.1. Company Overview
- 13.1.6.2. Products
- 13.1.6.3. Company Financials
- 13.1.6.4. SWOT Analysis
- 13.1.7 Realtek Semiconductor Corp
- 13.1.7.1. Company Overview
- 13.1.7.2. Products
- 13.1.7.3. Company Financials
- 13.1.7.4. SWOT Analysis
- 13.1.8 Texas Instruments Incorporated
- 13.1.8.1. Company Overview
- 13.1.8.2. Products
- 13.1.8.3. Company Financials
- 13.1.8.4. SWOT Analysis
- 13.1.9 Cadence Design Systems Inc
- 13.1.9.1. Company Overview
- 13.1.9.2. Products
- 13.1.9.3. Company Financials
- 13.1.9.4. SWOT Analysis
- 13.1.10 Intel Corporation
- 13.1.10.1. Company Overview
- 13.1.10.2. Products
- 13.1.10.3. Company Financials
- 13.1.10.4. SWOT Analysis
- 13.1.1 Futurlec Inc
- 13.2. Market Entropy
- 13.2.1 Company's Key Areas Served
- 13.2.2 Recent Developments
- 13.3. Company Market Share Analysis 2025
- 13.3.1 Top 5 Companies Market Share Analysis
- 13.3.2 Top 3 Companies Market Share Analysis
- 13.4. List of Potential Customers
- 14. Research Methodology
List of Figures
- Figure 1: Global Ethernet Controller Industry Revenue Breakdown (Million, %) by Region 2025 & 2033
- Figure 2: North America Ethernet Controller Industry Revenue (Million), by Bandwidth Type 2025 & 2033
- Figure 3: North America Ethernet Controller Industry Revenue Share (%), by Bandwidth Type 2025 & 2033
- Figure 4: North America Ethernet Controller Industry Revenue (Million), by Function 2025 & 2033
- Figure 5: North America Ethernet Controller Industry Revenue Share (%), by Function 2025 & 2033
- Figure 6: North America Ethernet Controller Industry Revenue (Million), by End Users 2025 & 2033
- Figure 7: North America Ethernet Controller Industry Revenue Share (%), by End Users 2025 & 2033
- Figure 8: North America Ethernet Controller Industry Revenue (Million), by Country 2025 & 2033
- Figure 9: North America Ethernet Controller Industry Revenue Share (%), by Country 2025 & 2033
- Figure 10: Europe Ethernet Controller Industry Revenue (Million), by Bandwidth Type 2025 & 2033
- Figure 11: Europe Ethernet Controller Industry Revenue Share (%), by Bandwidth Type 2025 & 2033
- Figure 12: Europe Ethernet Controller Industry Revenue (Million), by Function 2025 & 2033
- Figure 13: Europe Ethernet Controller Industry Revenue Share (%), by Function 2025 & 2033
- Figure 14: Europe Ethernet Controller Industry Revenue (Million), by End Users 2025 & 2033
- Figure 15: Europe Ethernet Controller Industry Revenue Share (%), by End Users 2025 & 2033
- Figure 16: Europe Ethernet Controller Industry Revenue (Million), by Country 2025 & 2033
- Figure 17: Europe Ethernet Controller Industry Revenue Share (%), by Country 2025 & 2033
- Figure 18: Asia Ethernet Controller Industry Revenue (Million), by Bandwidth Type 2025 & 2033
- Figure 19: Asia Ethernet Controller Industry Revenue Share (%), by Bandwidth Type 2025 & 2033
- Figure 20: Asia Ethernet Controller Industry Revenue (Million), by Function 2025 & 2033
- Figure 21: Asia Ethernet Controller Industry Revenue Share (%), by Function 2025 & 2033
- Figure 22: Asia Ethernet Controller Industry Revenue (Million), by End Users 2025 & 2033
- Figure 23: Asia Ethernet Controller Industry Revenue Share (%), by End Users 2025 & 2033
- Figure 24: Asia Ethernet Controller Industry Revenue (Million), by Country 2025 & 2033
- Figure 25: Asia Ethernet Controller Industry Revenue Share (%), by Country 2025 & 2033
- Figure 26: Australia and New Zealand Ethernet Controller Industry Revenue (Million), by Bandwidth Type 2025 & 2033
- Figure 27: Australia and New Zealand Ethernet Controller Industry Revenue Share (%), by Bandwidth Type 2025 & 2033
- Figure 28: Australia and New Zealand Ethernet Controller Industry Revenue (Million), by Function 2025 & 2033
- Figure 29: Australia and New Zealand Ethernet Controller Industry Revenue Share (%), by Function 2025 & 2033
- Figure 30: Australia and New Zealand Ethernet Controller Industry Revenue (Million), by End Users 2025 & 2033
- Figure 31: Australia and New Zealand Ethernet Controller Industry Revenue Share (%), by End Users 2025 & 2033
- Figure 32: Australia and New Zealand Ethernet Controller Industry Revenue (Million), by Country 2025 & 2033
- Figure 33: Australia and New Zealand Ethernet Controller Industry Revenue Share (%), by Country 2025 & 2033
- Figure 34: Latin America Ethernet Controller Industry Revenue (Million), by Bandwidth Type 2025 & 2033
- Figure 35: Latin America Ethernet Controller Industry Revenue Share (%), by Bandwidth Type 2025 & 2033
- Figure 36: Latin America Ethernet Controller Industry Revenue (Million), by Function 2025 & 2033
- Figure 37: Latin America Ethernet Controller Industry Revenue Share (%), by Function 2025 & 2033
- Figure 38: Latin America Ethernet Controller Industry Revenue (Million), by End Users 2025 & 2033
- Figure 39: Latin America Ethernet Controller Industry Revenue Share (%), by End Users 2025 & 2033
- Figure 40: Latin America Ethernet Controller Industry Revenue (Million), by Country 2025 & 2033
- Figure 41: Latin America Ethernet Controller Industry Revenue Share (%), by Country 2025 & 2033
- Figure 42: Middle East and Africa Ethernet Controller Industry Revenue (Million), by Bandwidth Type 2025 & 2033
- Figure 43: Middle East and Africa Ethernet Controller Industry Revenue Share (%), by Bandwidth Type 2025 & 2033
- Figure 44: Middle East and Africa Ethernet Controller Industry Revenue (Million), by Function 2025 & 2033
- Figure 45: Middle East and Africa Ethernet Controller Industry Revenue Share (%), by Function 2025 & 2033
- Figure 46: Middle East and Africa Ethernet Controller Industry Revenue (Million), by End Users 2025 & 2033
- Figure 47: Middle East and Africa Ethernet Controller Industry Revenue Share (%), by End Users 2025 & 2033
- Figure 48: Middle East and Africa Ethernet Controller Industry Revenue (Million), by Country 2025 & 2033
- Figure 49: Middle East and Africa Ethernet Controller Industry Revenue Share (%), by Country 2025 & 2033
List of Tables
- Table 1: Global Ethernet Controller Industry Revenue Million Forecast, by Bandwidth Type 2020 & 2033
- Table 2: Global Ethernet Controller Industry Revenue Million Forecast, by Function 2020 & 2033
- Table 3: Global Ethernet Controller Industry Revenue Million Forecast, by End Users 2020 & 2033
- Table 4: Global Ethernet Controller Industry Revenue Million Forecast, by Region 2020 & 2033
- Table 5: Global Ethernet Controller Industry Revenue Million Forecast, by Bandwidth Type 2020 & 2033
- Table 6: Global Ethernet Controller Industry Revenue Million Forecast, by Function 2020 & 2033
- Table 7: Global Ethernet Controller Industry Revenue Million Forecast, by End Users 2020 & 2033
- Table 8: Global Ethernet Controller Industry Revenue Million Forecast, by Country 2020 & 2033
- Table 9: United States Ethernet Controller Industry Revenue (Million) Forecast, by Application 2020 & 2033
- Table 10: Canada Ethernet Controller Industry Revenue (Million) Forecast, by Application 2020 & 2033
- Table 11: Global Ethernet Controller Industry Revenue Million Forecast, by Bandwidth Type 2020 & 2033
- Table 12: Global Ethernet Controller Industry Revenue Million Forecast, by Function 2020 & 2033
- Table 13: Global Ethernet Controller Industry Revenue Million Forecast, by End Users 2020 & 2033
- Table 14: Global Ethernet Controller Industry Revenue Million Forecast, by Country 2020 & 2033
- Table 15: Germany Ethernet Controller Industry Revenue (Million) Forecast, by Application 2020 & 2033
- Table 16: United Kingdom Ethernet Controller Industry Revenue (Million) Forecast, by Application 2020 & 2033
- Table 17: France Ethernet Controller Industry Revenue (Million) Forecast, by Application 2020 & 2033
- Table 18: Global Ethernet Controller Industry Revenue Million Forecast, by Bandwidth Type 2020 & 2033
- Table 19: Global Ethernet Controller Industry Revenue Million Forecast, by Function 2020 & 2033
- Table 20: Global Ethernet Controller Industry Revenue Million Forecast, by End Users 2020 & 2033
- Table 21: Global Ethernet Controller Industry Revenue Million Forecast, by Country 2020 & 2033
- Table 22: India Ethernet Controller Industry Revenue (Million) Forecast, by Application 2020 & 2033
- Table 23: China Ethernet Controller Industry Revenue (Million) Forecast, by Application 2020 & 2033
- Table 24: Japan Ethernet Controller Industry Revenue (Million) Forecast, by Application 2020 & 2033
- Table 25: Global Ethernet Controller Industry Revenue Million Forecast, by Bandwidth Type 2020 & 2033
- Table 26: Global Ethernet Controller Industry Revenue Million Forecast, by Function 2020 & 2033
- Table 27: Global Ethernet Controller Industry Revenue Million Forecast, by End Users 2020 & 2033
- Table 28: Global Ethernet Controller Industry Revenue Million Forecast, by Country 2020 & 2033
- Table 29: Global Ethernet Controller Industry Revenue Million Forecast, by Bandwidth Type 2020 & 2033
- Table 30: Global Ethernet Controller Industry Revenue Million Forecast, by Function 2020 & 2033
- Table 31: Global Ethernet Controller Industry Revenue Million Forecast, by End Users 2020 & 2033
- Table 32: Global Ethernet Controller Industry Revenue Million Forecast, by Country 2020 & 2033
- Table 33: Global Ethernet Controller Industry Revenue Million Forecast, by Bandwidth Type 2020 & 2033
- Table 34: Global Ethernet Controller Industry Revenue Million Forecast, by Function 2020 & 2033
- Table 35: Global Ethernet Controller Industry Revenue Million Forecast, by End Users 2020 & 2033
- Table 36: Global Ethernet Controller Industry Revenue Million Forecast, by Country 2020 & 2033
Frequently Asked Questions
1. What is the projected Compound Annual Growth Rate (CAGR) of the Ethernet Controller Industry?
The projected CAGR is approximately 7.42%.
2. Which companies are prominent players in the Ethernet Controller Industry?
Key companies in the market include Futurlec Inc, Microchip Technology Inc, Cirrus Logic Inc, Marvell Technology Group, Silicon Laboratories Inc, Broadcom Inc, Realtek Semiconductor Corp, Texas Instruments Incorporated, Cadence Design Systems Inc, Intel Corporation.
3. What are the main segments of the Ethernet Controller Industry?
The market segments include Bandwidth Type, Function, End Users.
4. Can you provide details about the market size?
The market size is estimated to be USD 11.62 Million as of 2022.
5. What are some drivers contributing to market growth?
Adoption of EtherCat for Realtime Network for Machine Control; Adoption of USB Ethernet Controllers.
6. What are the notable trends driving market growth?
Servers to Hold the Largest Market Share.
7. Are there any restraints impacting market growth?
Low Demand Due to Impact of COVID-; Competitive Prices Led to Stiff Profit Margins.
8. Can you provide examples of recent developments in the market?
March 2024: NVIDIA unveiled the NVIDIA Blackwell platform, empowering organizations to develop and deploy real-time generative AI using trillion-parameter large language models. This new platform boasts a remarkable 25x reduction in cost and energy consumption compared to its predecessor. To further enhance AI capabilities, organizations can pair their systems powered by the GB200 with the newly introduced NVIDIA Quantum-X800 InfiniBand and Spectrum-X800 Ethernet platforms. These networking solutions offer advanced speeds of up to 800Gb/s.
9. What pricing options are available for accessing the report?
Pricing options include single-user, multi-user, and enterprise licenses priced at USD 4750, USD 5250, and USD 8750 respectively.
10. Is the market size provided in terms of value or volume?
The market size is provided in terms of value, measured in Million.
11. Are there any specific market keywords associated with the report?
Yes, the market keyword associated with the report is "Ethernet Controller Industry," which aids in identifying and referencing the specific market segment covered.
12. How do I determine which pricing option suits my needs best?
The pricing options vary based on user requirements and access needs. Individual users may opt for single-user licenses, while businesses requiring broader access may choose multi-user or enterprise licenses for cost-effective access to the report.
13. Are there any additional resources or data provided in the Ethernet Controller Industry report?
While the report offers comprehensive insights, it's advisable to review the specific contents or supplementary materials provided to ascertain if additional resources or data are available.
14. How can I stay updated on further developments or reports in the Ethernet Controller Industry?
To stay informed about further developments, trends, and reports in the Ethernet Controller Industry, consider subscribing to industry newsletters, following relevant companies and organizations, or regularly checking reputable industry news sources and publications.
Methodology
Step 1 - Identification of Relevant Samples Size from Population Database


Step 2 - Approaches for Defining Global Market Size (Value, Volume* & Price*)

Note*: In applicable scenarios
Step 3 - Data Sources
Primary Research
- Web Analytics
- Survey Reports
- Research Institute
- Latest Research Reports
- Opinion Leaders
Secondary Research
- Annual Reports
- White Paper
- Latest Press Release
- Industry Association
- Paid Database
- Investor Presentations

Step 4 - Data Triangulation
Involves using different sources of information in order to increase the validity of a study
These sources are likely to be stakeholders in a program - participants, other researchers, program staff, other community members, and so on.
Then we put all data in single framework & apply various statistical tools to find out the dynamic on the market.
During the analysis stage, feedback from the stakeholder groups would be compared to determine areas of agreement as well as areas of divergence