

Key Insights
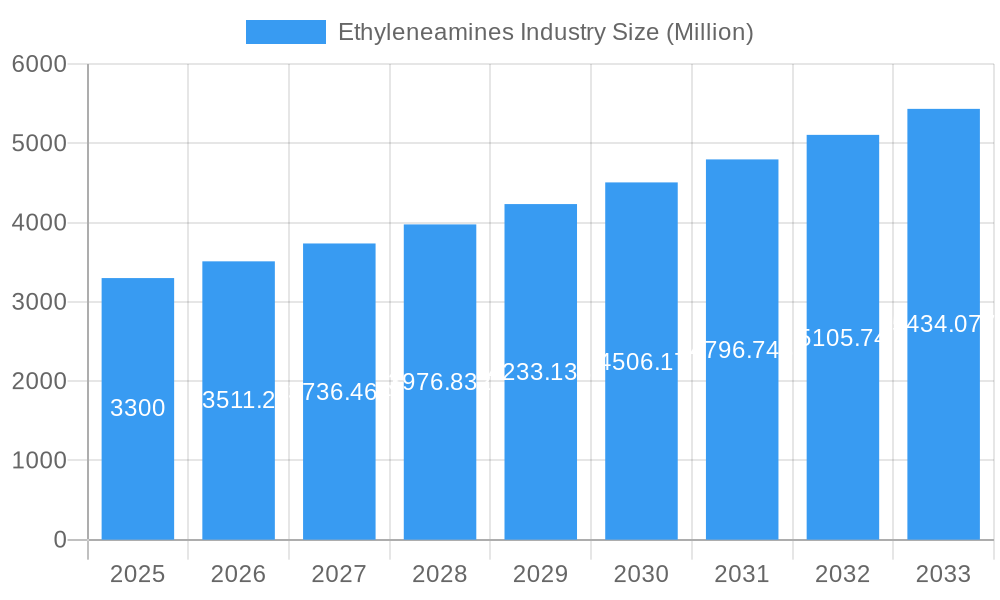
The global Ethyleneamines market is poised for significant expansion, projected to reach approximately $3.3 billion in 2025 and grow at a robust CAGR of 6.4% through 2033. This upward trajectory is primarily fueled by the escalating demand from a diverse range of end-user industries. The personal care sector, a consistent consumer of ethyleneamines for their surfactant and conditioning properties, continues to drive growth. Similarly, the pulp and paper industry relies on these chemicals for functional additives and process aids, further bolstering market performance. The paints and resins segment, alongside the agrochemicals industry, where ethyleneamines serve as vital intermediates and formulation components, are also key contributors to this expansion. The automotive industry's increasing use of specialized adhesives and coatings, and the pharmaceutical sector’s need for complex synthesis intermediates, are creating new avenues for market penetration. Even the oil and gas industry’s demand for corrosion inhibitors and refining catalysts adds to the overall growth narrative.
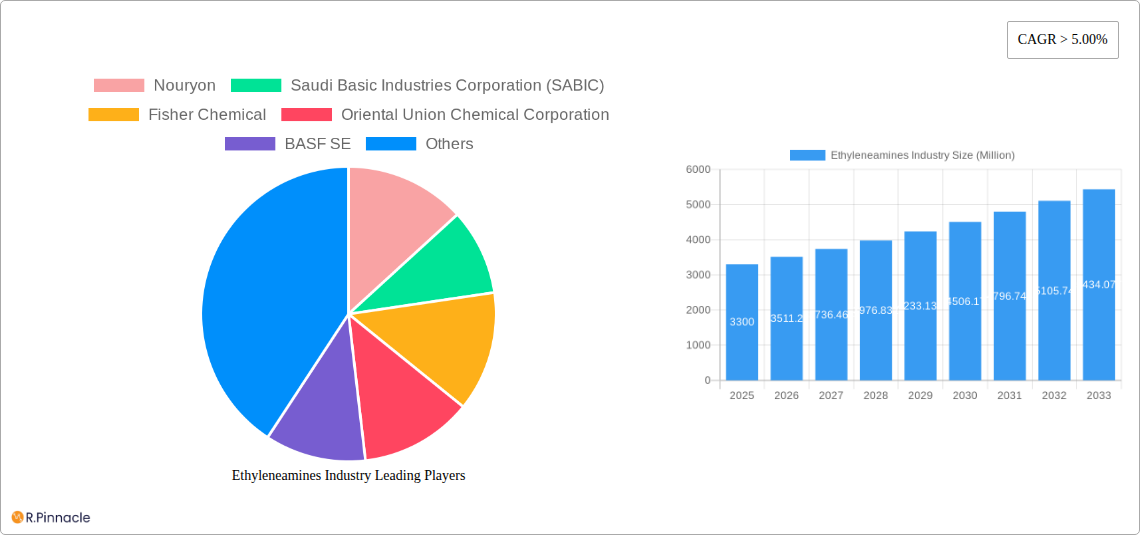
Ethyleneamines Industry Market Size (In Billion)
The market is characterized by a dynamic interplay of drivers and restraints. Growth is significantly propelled by advancements in chemical synthesis, leading to the development of specialized ethyleneamine derivatives with enhanced functionalities. Furthermore, the increasing adoption of these chemicals in emerging economies, driven by industrialization and rising disposable incomes, presents substantial opportunities. However, the market faces certain constraints. Fluctuations in the prices of raw materials, particularly ethylene and ammonia, can impact manufacturing costs and profitability. Stringent environmental regulations concerning the production and disposal of chemicals also pose a challenge, necessitating investment in sustainable practices and cleaner technologies. Despite these hurdles, the inherent versatility and essential role of ethyleneamines across numerous critical industries suggest a resilient and expanding market landscape. The competitive environment is shaped by major players like Nouryon, SABIC, BASF SE, and Huntsman International LLC, all vying for market share through innovation and strategic partnerships.
Ethyleneamines Industry Company Market Share
Ethyleneamines Industry Market: Comprehensive Analysis and Future Outlook (2019-2033)
This in-depth report provides a definitive analysis of the global Ethyleneamines industry, offering critical insights for stakeholders navigating this dynamic market. With a study period spanning from 2019 to 2033, and a base year of 2025, this report delves into historical trends, current market dynamics, and future projections. Discover key growth drivers, emerging opportunities, significant challenges, and the competitive landscape shaped by leading players and technological advancements.
Ethyleneamines Industry Market Structure & Innovation Trends
The Ethyleneamines market exhibits a moderate to high concentration, with key players like Nouryon, Saudi Basic Industries Corporation (SABIC), BASF SE, and Dow holding significant market share. Innovation in ethyleneamines is primarily driven by the demand for enhanced performance in end-user applications, such as high-performance polymers, advanced agrochemicals, and specialized pharmaceuticals. Regulatory frameworks, particularly concerning environmental impact and safety, are increasingly influencing product development and manufacturing processes. The threat of product substitutes is relatively low for core ethyleneamine derivatives due to their unique chemical properties and established industrial applications. End-user demographics reveal a growing demand from burgeoning economies and the increasing sophistication of consumer products. Mergers and acquisitions (M&A) activities, while not consistently high in deal value, are strategically focused on expanding production capacity and geographical reach. For instance, past M&A activities have aimed at consolidating market position and acquiring new technologies.
Ethyleneamines Industry Market Dynamics & Trends
The Ethyleneamines market is experiencing robust growth, projected to witness a significant Compound Annual Growth Rate (CAGR) through the forecast period. This expansion is fueled by several key market growth drivers. The burgeoning demand from the Agro Chemicals Industry for crop protection agents and fertilizers, the Pulp and Paper Industry for functional additives, and the Automotive Industry for lightweight materials and coatings are significant contributors. Furthermore, the increasing utilization of ethyleneamines in the Oil and Gas Industry for corrosion inhibition and extraction processes, alongside their role in the Pharmaceutical Industry for drug synthesis, propels market penetration. Technological disruptions are centered on developing more efficient and sustainable production methods, alongside creating novel ethyleneamine derivatives with tailored properties for specialized applications. Consumer preferences are gradually shifting towards eco-friendly formulations, prompting manufacturers to invest in green chemistry initiatives. The competitive dynamics are characterized by intense price competition for standard grades and a focus on product differentiation and technical support for specialized offerings. Emerging applications in advanced materials and renewable energy sectors are also poised to influence future market trends, driving innovation and investment.
Dominant Regions & Segments in Ethyleneamines Industry
The Asia-Pacific region is emerging as a dominant force in the Ethyleneamines market, driven by rapid industrialization, a large manufacturing base, and increasing investments in infrastructure and R&D. Within this region, China stands out due to its substantial domestic demand across various end-user industries and its strategic position as a global manufacturing hub.
Key Segment Dominance:
Type: Ethylenediamine (EDA)
- Drivers: EDA is a fundamental building block for a wide array of downstream chemicals, including chelating agents, epoxy curing agents, and agrochemicals. Its widespread application in growing industries like pharmaceuticals and personal care ensures sustained demand.
- Dominance Analysis: The increasing adoption of EDA in the synthesis of pharmaceuticals and its crucial role in the production of fungicides and herbicides in the agrochemical sector contribute to its leading position. Economic policies encouraging agricultural productivity and healthcare advancements further bolster its market share.
End-user Industry: Agro Chemicals Industry
- Drivers: The ever-increasing global population necessitates higher agricultural output, driving the demand for effective crop protection and nutrient solutions. Ethyleneamines are vital in the formulation of these products.
- Dominance Analysis: The need for enhanced crop yields and disease management solutions in both developed and developing economies makes the agrochemicals sector a significant consumer of ethyleneamines. Favorable government subsidies for agriculture and the development of more targeted and efficient agrochemical formulations are key factors.
End-user Industry: Pulp and Paper Industry
- Drivers: Ethyleneamines are used as strengthening agents, retention aids, and defoamers in paper manufacturing, improving paper quality and production efficiency.
- Dominance Analysis: The global demand for paper and packaging, driven by e-commerce growth and consumer goods, directly fuels the consumption of ethyleneamines in this sector. Infrastructure development and rising disposable incomes in emerging markets contribute to this sustained demand.
End-user Industry: Automotive Industry
- Drivers: Ethyleneamines serve as essential components in the production of epoxy resins used in coatings, adhesives, and composite materials for lightweight and durable automotive parts.
- Dominance Analysis: The push towards fuel efficiency and the growing production of electric vehicles, which often incorporate advanced composite materials, are significant drivers. Stringent regulations on vehicle emissions and safety standards also promote the use of high-performance materials derived from ethyleneamines.
End-user Industry: Oil and Gas Industry
- Drivers: Ethyleneamines are critical for corrosion inhibition in pipelines and drilling fluids, as well as in enhanced oil recovery operations.
- Dominance Analysis: The ongoing exploration and production activities globally, coupled with the need to maintain the integrity of aging infrastructure, ensure a consistent demand. Fluctuations in crude oil prices can influence exploration and production activities, thereby impacting demand in this segment.
Ethyleneamines Industry Product Innovations
Product innovations in the Ethyleneamines industry are focused on developing specialized derivatives with enhanced functionalities for niche applications. These advancements include novel curing agents for high-performance composites, advanced chelating agents for industrial cleaning, and environmentally friendly formulations for agrochemicals. The pursuit of bio-based and sustainable ethyleneamine production methods is also gaining traction. These innovations offer competitive advantages by improving product performance, reducing environmental impact, and meeting evolving regulatory requirements, thereby expanding market reach and enabling premium pricing strategies.
Ethyleneamines Industry Report Scope & Segmentation Analysis
This report meticulously segments the Ethyleneamines market across various dimensions to provide a granular understanding.
- Type: The market is analyzed by Ethylenediamine (EDA), a key intermediate, and Heavy Ethyleneamines (DETA, TETA, TEPA, AEP, etc.), which cater to diverse industrial needs. Growth projections for EDA are robust due to its foundational role, while Heavy Ethyleneamines are projected to see substantial growth driven by specialized applications.
- End-user Industry: The analysis covers the Personal Care Industry, Pulp and Paper Industry, Adhesives, Paints, and Resins, Agro Chemicals Industry, Automotive Industry, Pharmaceutical Industry, Oil and Gas Industry, Textile Industry, Metal Industry, and Other End-user Industries. Each segment's market size, growth rate, and competitive dynamics are detailed, with the Agro Chemicals and Automotive industries currently exhibiting the strongest growth trajectories.
Key Drivers of Ethyleneamines Industry Growth
Several factors are propelling the growth of the Ethyleneamines industry. The increasing demand from the Agro Chemicals Industry for enhanced crop yields and protection solutions is a primary driver. The automotive sector's shift towards lightweight materials and advanced coatings, utilizing ethyleneamine-based epoxies, further fuels expansion. Furthermore, the continuous need for corrosion inhibitors and efficiency enhancers in the Oil and Gas Industry contributes significantly. Technological advancements leading to the development of high-performance derivatives for specialized applications in pharmaceuticals and electronics are also key growth accelerators.
Challenges in the Ethyleneamines Industry Sector
Despite robust growth, the Ethyleneamines industry faces several challenges. Volatility in raw material prices, particularly petrochemical feedstocks, can impact production costs and profitability. Stringent environmental regulations regarding emissions and waste disposal necessitate continuous investment in sustainable manufacturing processes. Supply chain disruptions, as observed in recent global events, can affect the availability and cost of essential intermediates. Intense competition, especially in commodity grades, can put pressure on profit margins, requiring companies to focus on product differentiation and value-added services to maintain market share.
Emerging Opportunities in Ethyleneamines Industry
The Ethyleneamines industry is ripe with emerging opportunities. The growing demand for bio-based and sustainable ethyleneamine alternatives presents a significant avenue for innovation and market penetration. Expansion of applications in advanced materials, such as high-performance composites for aerospace and renewable energy sectors (e.g., wind turbine blades), offers substantial growth potential. The increasing pharmaceutical and biotechnology sectors' reliance on ethyleneamine derivatives for drug synthesis and delivery systems also creates new market niches. Furthermore, growing infrastructure development and industrialization in emerging economies, particularly in Asia-Pacific and Africa, will drive demand across various end-user segments.
Leading Players in the Ethyleneamines Industry Market
- Nouryon
- Saudi Basic Industries Corporation (SABIC)
- Fisher Chemical
- Oriental Union Chemical Corporation
- BASF SE
- Huntsman International LLC
- Diamines and Chemicals Ltd
- Arabian Amines Company
- Dow
- Delamine BV
- Tosoh Corporation
- Sadara Chemical Company
Key Developments in Ethyleneamines Industry Industry
- May 2022: BASF and SINOPEC announced the construction of their new plant in Nanjing, China, expanding the production capacities of ethyleneamines to serve the growing demand from various industries in the Chinese market. This strategic move aims to bolster their presence in a key growth region and ensure supply chain reliability for their customers.
- September 2021: Dow Chemical Company increased the prices of several ethyleneamine products in North America. Specific price adjustments included aminoethyl ethanolamine (AEEA) USD 0.15, diethylenetriamine (DETA) USD 0.30, ethylenediamine (EDA) USD 0.15, and piperazine 68% USD 0.10. These adjustments reflected increased production costs and market demand dynamics.
Future Outlook for Ethyleneamines Industry Market
The future outlook for the Ethyleneamines market is exceptionally positive, driven by a confluence of accelerating growth factors. The sustained demand from established sectors like agrochemicals and automotive, coupled with the burgeoning applications in advanced materials, pharmaceuticals, and renewable energy, will underpin market expansion. Continued investment in R&D for sustainable production methods and the development of highly specialized ethyleneamine derivatives will be critical for maintaining competitive advantage. Strategic partnerships and capacity expansions in high-growth regions, particularly Asia-Pacific, will be key to capturing future market potential. The industry is poised for innovation, offering lucrative opportunities for stakeholders who can adeptly navigate technological advancements and evolving market demands.
Ethyleneamines Industry Segmentation
-
1. Type
- 1.1. Ethylenediamine (EDA)
- 1.2. Heavy Ethyleneamines (DETA, TETA, TEPA, AEP, etc.)
-
2. End-user Industry
- 2.1. Personal Care Industry
- 2.2. Pulp and Paper Industry
- 2.3. Adhesives, Paints, and Resins
- 2.4. Agro Chemicals Industry
- 2.5. Automotive Industry
- 2.6. Pharmaceutical Industry
- 2.7. Oil and Gas Industry
- 2.8. Textile Industry
- 2.9. Metal Industry
- 2.10. Other End-user Industries
Ethyleneamines Industry Segmentation By Geography
-
1. Asia Pacific
- 1.1. China
- 1.2. India
- 1.3. Japan
- 1.4. South Korea
- 1.5. Rest of Asia Pacific
-
2. North America
- 2.1. United States
- 2.2. Canada
- 2.3. Mexico
- 2.4. Rest of North America
-
3. Europe
- 3.1. Germany
- 3.2. United Kingdom
- 3.3. Italy
- 3.4. France
- 3.5. Rest of Europe
-
4. South America
- 4.1. Brazil
- 4.2. Argentina
- 4.3. Rest of South America
- 5. Middle East and Africa
-
6. Saudi Arabia
- 6.1. South Africa
- 6.2. Rest of Middle East
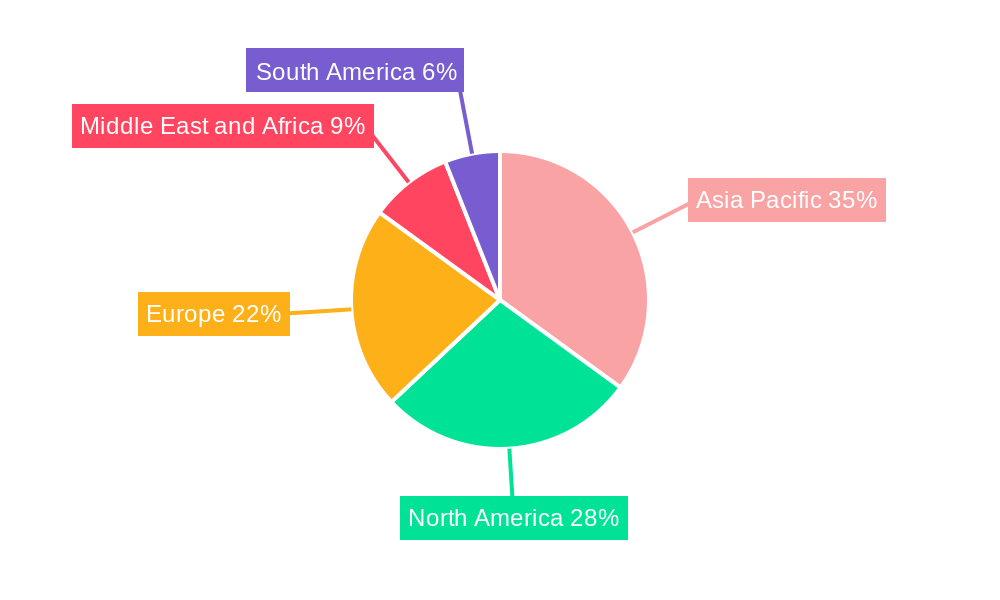
Ethyleneamines Industry Regional Market Share
Geographic Coverage of Ethyleneamines Industry
Ethyleneamines Industry REPORT HIGHLIGHTS
| Aspects | Details |
|---|---|
| Study Period | 2020-2034 |
| Base Year | 2025 |
| Estimated Year | 2026 |
| Forecast Period | 2026-2034 |
| Historical Period | 2020-2025 |
| Growth Rate | CAGR of 4.9% from 2020-2034 |
| Segmentation |
|
Table of Contents
- 1. Introduction
- 1.1. Research Scope
- 1.2. Market Segmentation
- 1.3. Research Objective
- 1.4. Definitions and Assumptions
- 2. Executive Summary
- 2.1. Market Snapshot
- 3. Market Dynamics
- 3.1. Market Drivers
- 3.2. Market Restrains
- 3.3. Market Trends
- 3.4. Market Opportunities
- 4. Market Factor Analysis
- 4.1. Porters Five Forces
- 4.1.1. Bargaining Power of Suppliers
- 4.1.2. Bargaining Power of Buyers
- 4.1.3. Threat of New Entrants
- 4.1.4. Threat of Substitutes
- 4.1.5. Competitive Rivalry
- 4.2. PESTEL analysis
- 4.3. BCG Analysis
- 4.3.1. Stars (High Growth, High Market Share)
- 4.3.2. Cash Cows (Low Growth, High Market Share)
- 4.3.3. Question Mark (High Growth, Low Market Share)
- 4.3.4. Dogs (Low Growth, Low Market Share)
- 4.4. Ansoff Matrix Analysis
- 4.5. Supply Chain Analysis
- 4.6. Regulatory Landscape
- 4.7. Current Market Potential and Opportunity Assessment (TAM–SAM–SOM Framework)
- 4.8. PRI Analyst Note
- 4.1. Porters Five Forces
- 5. Market Analysis, Insights and Forecast 2021-2033
- 5.1. Market Analysis, Insights and Forecast - by Type
- 5.1.1. Ethylenediamine (EDA)
- 5.1.2. Heavy Ethyleneamines (DETA, TETA, TEPA, AEP, etc.)
- 5.2. Market Analysis, Insights and Forecast - by End-user Industry
- 5.2.1. Personal Care Industry
- 5.2.2. Pulp and Paper Industry
- 5.2.3. Adhesives, Paints, and Resins
- 5.2.4. Agro Chemicals Industry
- 5.2.5. Automotive Industry
- 5.2.6. Pharmaceutical Industry
- 5.2.7. Oil and Gas Industry
- 5.2.8. Textile Industry
- 5.2.9. Metal Industry
- 5.2.10. Other End-user Industries
- 5.3. Market Analysis, Insights and Forecast - by Region
- 5.3.1. Asia Pacific
- 5.3.2. North America
- 5.3.3. Europe
- 5.3.4. South America
- 5.3.5. Middle East and Africa
- 5.3.6. Saudi Arabia
- 5.1. Market Analysis, Insights and Forecast - by Type
- 6. Global Ethyleneamines Industry Analysis, Insights and Forecast, 2021-2033
- 6.1. Market Analysis, Insights and Forecast - by Type
- 6.1.1. Ethylenediamine (EDA)
- 6.1.2. Heavy Ethyleneamines (DETA, TETA, TEPA, AEP, etc.)
- 6.2. Market Analysis, Insights and Forecast - by End-user Industry
- 6.2.1. Personal Care Industry
- 6.2.2. Pulp and Paper Industry
- 6.2.3. Adhesives, Paints, and Resins
- 6.2.4. Agro Chemicals Industry
- 6.2.5. Automotive Industry
- 6.2.6. Pharmaceutical Industry
- 6.2.7. Oil and Gas Industry
- 6.2.8. Textile Industry
- 6.2.9. Metal Industry
- 6.2.10. Other End-user Industries
- 6.1. Market Analysis, Insights and Forecast - by Type
- 7. Asia Pacific Ethyleneamines Industry Analysis, Insights and Forecast, 2020-2032
- 7.1. Market Analysis, Insights and Forecast - by Type
- 7.1.1. Ethylenediamine (EDA)
- 7.1.2. Heavy Ethyleneamines (DETA, TETA, TEPA, AEP, etc.)
- 7.2. Market Analysis, Insights and Forecast - by End-user Industry
- 7.2.1. Personal Care Industry
- 7.2.2. Pulp and Paper Industry
- 7.2.3. Adhesives, Paints, and Resins
- 7.2.4. Agro Chemicals Industry
- 7.2.5. Automotive Industry
- 7.2.6. Pharmaceutical Industry
- 7.2.7. Oil and Gas Industry
- 7.2.8. Textile Industry
- 7.2.9. Metal Industry
- 7.2.10. Other End-user Industries
- 7.1. Market Analysis, Insights and Forecast - by Type
- 8. North America Ethyleneamines Industry Analysis, Insights and Forecast, 2020-2032
- 8.1. Market Analysis, Insights and Forecast - by Type
- 8.1.1. Ethylenediamine (EDA)
- 8.1.2. Heavy Ethyleneamines (DETA, TETA, TEPA, AEP, etc.)
- 8.2. Market Analysis, Insights and Forecast - by End-user Industry
- 8.2.1. Personal Care Industry
- 8.2.2. Pulp and Paper Industry
- 8.2.3. Adhesives, Paints, and Resins
- 8.2.4. Agro Chemicals Industry
- 8.2.5. Automotive Industry
- 8.2.6. Pharmaceutical Industry
- 8.2.7. Oil and Gas Industry
- 8.2.8. Textile Industry
- 8.2.9. Metal Industry
- 8.2.10. Other End-user Industries
- 8.1. Market Analysis, Insights and Forecast - by Type
- 9. Europe Ethyleneamines Industry Analysis, Insights and Forecast, 2020-2032
- 9.1. Market Analysis, Insights and Forecast - by Type
- 9.1.1. Ethylenediamine (EDA)
- 9.1.2. Heavy Ethyleneamines (DETA, TETA, TEPA, AEP, etc.)
- 9.2. Market Analysis, Insights and Forecast - by End-user Industry
- 9.2.1. Personal Care Industry
- 9.2.2. Pulp and Paper Industry
- 9.2.3. Adhesives, Paints, and Resins
- 9.2.4. Agro Chemicals Industry
- 9.2.5. Automotive Industry
- 9.2.6. Pharmaceutical Industry
- 9.2.7. Oil and Gas Industry
- 9.2.8. Textile Industry
- 9.2.9. Metal Industry
- 9.2.10. Other End-user Industries
- 9.1. Market Analysis, Insights and Forecast - by Type
- 10. South America Ethyleneamines Industry Analysis, Insights and Forecast, 2020-2032
- 10.1. Market Analysis, Insights and Forecast - by Type
- 10.1.1. Ethylenediamine (EDA)
- 10.1.2. Heavy Ethyleneamines (DETA, TETA, TEPA, AEP, etc.)
- 10.2. Market Analysis, Insights and Forecast - by End-user Industry
- 10.2.1. Personal Care Industry
- 10.2.2. Pulp and Paper Industry
- 10.2.3. Adhesives, Paints, and Resins
- 10.2.4. Agro Chemicals Industry
- 10.2.5. Automotive Industry
- 10.2.6. Pharmaceutical Industry
- 10.2.7. Oil and Gas Industry
- 10.2.8. Textile Industry
- 10.2.9. Metal Industry
- 10.2.10. Other End-user Industries
- 10.1. Market Analysis, Insights and Forecast - by Type
- 11. Middle East and Africa Ethyleneamines Industry Analysis, Insights and Forecast, 2020-2032
- 11.1. Market Analysis, Insights and Forecast - by Type
- 11.1.1. Ethylenediamine (EDA)
- 11.1.2. Heavy Ethyleneamines (DETA, TETA, TEPA, AEP, etc.)
- 11.2. Market Analysis, Insights and Forecast - by End-user Industry
- 11.2.1. Personal Care Industry
- 11.2.2. Pulp and Paper Industry
- 11.2.3. Adhesives, Paints, and Resins
- 11.2.4. Agro Chemicals Industry
- 11.2.5. Automotive Industry
- 11.2.6. Pharmaceutical Industry
- 11.2.7. Oil and Gas Industry
- 11.2.8. Textile Industry
- 11.2.9. Metal Industry
- 11.2.10. Other End-user Industries
- 11.1. Market Analysis, Insights and Forecast - by Type
- 12. Saudi Arabia Ethyleneamines Industry Analysis, Insights and Forecast, 2020-2032
- 12.1. Market Analysis, Insights and Forecast - by Type
- 12.1.1. Ethylenediamine (EDA)
- 12.1.2. Heavy Ethyleneamines (DETA, TETA, TEPA, AEP, etc.)
- 12.2. Market Analysis, Insights and Forecast - by End-user Industry
- 12.2.1. Personal Care Industry
- 12.2.2. Pulp and Paper Industry
- 12.2.3. Adhesives, Paints, and Resins
- 12.2.4. Agro Chemicals Industry
- 12.2.5. Automotive Industry
- 12.2.6. Pharmaceutical Industry
- 12.2.7. Oil and Gas Industry
- 12.2.8. Textile Industry
- 12.2.9. Metal Industry
- 12.2.10. Other End-user Industries
- 12.1. Market Analysis, Insights and Forecast - by Type
- 13. Competitive Analysis
- 13.1. Company Profiles
- 13.1.1 Nouryon
- 13.1.1.1. Company Overview
- 13.1.1.2. Products
- 13.1.1.3. Company Financials
- 13.1.1.4. SWOT Analysis
- 13.1.2 Saudi Basic Industries Corporation (SABIC)
- 13.1.2.1. Company Overview
- 13.1.2.2. Products
- 13.1.2.3. Company Financials
- 13.1.2.4. SWOT Analysis
- 13.1.3 Fisher Chemical
- 13.1.3.1. Company Overview
- 13.1.3.2. Products
- 13.1.3.3. Company Financials
- 13.1.3.4. SWOT Analysis
- 13.1.4 Oriental Union Chemical Corporation
- 13.1.4.1. Company Overview
- 13.1.4.2. Products
- 13.1.4.3. Company Financials
- 13.1.4.4. SWOT Analysis
- 13.1.5 BASF SE
- 13.1.5.1. Company Overview
- 13.1.5.2. Products
- 13.1.5.3. Company Financials
- 13.1.5.4. SWOT Analysis
- 13.1.6 Huntsman International LLC
- 13.1.6.1. Company Overview
- 13.1.6.2. Products
- 13.1.6.3. Company Financials
- 13.1.6.4. SWOT Analysis
- 13.1.7 Diamines and Chemicals Ltd
- 13.1.7.1. Company Overview
- 13.1.7.2. Products
- 13.1.7.3. Company Financials
- 13.1.7.4. SWOT Analysis
- 13.1.8 Arabian Amines Company
- 13.1.8.1. Company Overview
- 13.1.8.2. Products
- 13.1.8.3. Company Financials
- 13.1.8.4. SWOT Analysis
- 13.1.9 Dow
- 13.1.9.1. Company Overview
- 13.1.9.2. Products
- 13.1.9.3. Company Financials
- 13.1.9.4. SWOT Analysis
- 13.1.10 Delamine BV
- 13.1.10.1. Company Overview
- 13.1.10.2. Products
- 13.1.10.3. Company Financials
- 13.1.10.4. SWOT Analysis
- 13.1.11 Tosoh Corporation
- 13.1.11.1. Company Overview
- 13.1.11.2. Products
- 13.1.11.3. Company Financials
- 13.1.11.4. SWOT Analysis
- 13.1.12 Sadara Chemical Company
- 13.1.12.1. Company Overview
- 13.1.12.2. Products
- 13.1.12.3. Company Financials
- 13.1.12.4. SWOT Analysis
- 13.1.1 Nouryon
- 13.2. Market Entropy
- 13.2.1 Company's Key Areas Served
- 13.2.2 Recent Developments
- 13.3. Company Market Share Analysis 2025
- 13.3.1 Top 5 Companies Market Share Analysis
- 13.3.2 Top 3 Companies Market Share Analysis
- 13.4. List of Potential Customers
- 14. Research Methodology
List of Figures
- Figure 1: Global Ethyleneamines Industry Revenue Breakdown (billion, %) by Region 2025 & 2033
- Figure 2: Global Ethyleneamines Industry Volume Breakdown (K Tons, %) by Region 2025 & 2033
- Figure 3: Asia Pacific Ethyleneamines Industry Revenue (billion), by Type 2025 & 2033
- Figure 4: Asia Pacific Ethyleneamines Industry Volume (K Tons), by Type 2025 & 2033
- Figure 5: Asia Pacific Ethyleneamines Industry Revenue Share (%), by Type 2025 & 2033
- Figure 6: Asia Pacific Ethyleneamines Industry Volume Share (%), by Type 2025 & 2033
- Figure 7: Asia Pacific Ethyleneamines Industry Revenue (billion), by End-user Industry 2025 & 2033
- Figure 8: Asia Pacific Ethyleneamines Industry Volume (K Tons), by End-user Industry 2025 & 2033
- Figure 9: Asia Pacific Ethyleneamines Industry Revenue Share (%), by End-user Industry 2025 & 2033
- Figure 10: Asia Pacific Ethyleneamines Industry Volume Share (%), by End-user Industry 2025 & 2033
- Figure 11: Asia Pacific Ethyleneamines Industry Revenue (billion), by Country 2025 & 2033
- Figure 12: Asia Pacific Ethyleneamines Industry Volume (K Tons), by Country 2025 & 2033
- Figure 13: Asia Pacific Ethyleneamines Industry Revenue Share (%), by Country 2025 & 2033
- Figure 14: Asia Pacific Ethyleneamines Industry Volume Share (%), by Country 2025 & 2033
- Figure 15: North America Ethyleneamines Industry Revenue (billion), by Type 2025 & 2033
- Figure 16: North America Ethyleneamines Industry Volume (K Tons), by Type 2025 & 2033
- Figure 17: North America Ethyleneamines Industry Revenue Share (%), by Type 2025 & 2033
- Figure 18: North America Ethyleneamines Industry Volume Share (%), by Type 2025 & 2033
- Figure 19: North America Ethyleneamines Industry Revenue (billion), by End-user Industry 2025 & 2033
- Figure 20: North America Ethyleneamines Industry Volume (K Tons), by End-user Industry 2025 & 2033
- Figure 21: North America Ethyleneamines Industry Revenue Share (%), by End-user Industry 2025 & 2033
- Figure 22: North America Ethyleneamines Industry Volume Share (%), by End-user Industry 2025 & 2033
- Figure 23: North America Ethyleneamines Industry Revenue (billion), by Country 2025 & 2033
- Figure 24: North America Ethyleneamines Industry Volume (K Tons), by Country 2025 & 2033
- Figure 25: North America Ethyleneamines Industry Revenue Share (%), by Country 2025 & 2033
- Figure 26: North America Ethyleneamines Industry Volume Share (%), by Country 2025 & 2033
- Figure 27: Europe Ethyleneamines Industry Revenue (billion), by Type 2025 & 2033
- Figure 28: Europe Ethyleneamines Industry Volume (K Tons), by Type 2025 & 2033
- Figure 29: Europe Ethyleneamines Industry Revenue Share (%), by Type 2025 & 2033
- Figure 30: Europe Ethyleneamines Industry Volume Share (%), by Type 2025 & 2033
- Figure 31: Europe Ethyleneamines Industry Revenue (billion), by End-user Industry 2025 & 2033
- Figure 32: Europe Ethyleneamines Industry Volume (K Tons), by End-user Industry 2025 & 2033
- Figure 33: Europe Ethyleneamines Industry Revenue Share (%), by End-user Industry 2025 & 2033
- Figure 34: Europe Ethyleneamines Industry Volume Share (%), by End-user Industry 2025 & 2033
- Figure 35: Europe Ethyleneamines Industry Revenue (billion), by Country 2025 & 2033
- Figure 36: Europe Ethyleneamines Industry Volume (K Tons), by Country 2025 & 2033
- Figure 37: Europe Ethyleneamines Industry Revenue Share (%), by Country 2025 & 2033
- Figure 38: Europe Ethyleneamines Industry Volume Share (%), by Country 2025 & 2033
- Figure 39: South America Ethyleneamines Industry Revenue (billion), by Type 2025 & 2033
- Figure 40: South America Ethyleneamines Industry Volume (K Tons), by Type 2025 & 2033
- Figure 41: South America Ethyleneamines Industry Revenue Share (%), by Type 2025 & 2033
- Figure 42: South America Ethyleneamines Industry Volume Share (%), by Type 2025 & 2033
- Figure 43: South America Ethyleneamines Industry Revenue (billion), by End-user Industry 2025 & 2033
- Figure 44: South America Ethyleneamines Industry Volume (K Tons), by End-user Industry 2025 & 2033
- Figure 45: South America Ethyleneamines Industry Revenue Share (%), by End-user Industry 2025 & 2033
- Figure 46: South America Ethyleneamines Industry Volume Share (%), by End-user Industry 2025 & 2033
- Figure 47: South America Ethyleneamines Industry Revenue (billion), by Country 2025 & 2033
- Figure 48: South America Ethyleneamines Industry Volume (K Tons), by Country 2025 & 2033
- Figure 49: South America Ethyleneamines Industry Revenue Share (%), by Country 2025 & 2033
- Figure 50: South America Ethyleneamines Industry Volume Share (%), by Country 2025 & 2033
- Figure 51: Middle East and Africa Ethyleneamines Industry Revenue (billion), by Type 2025 & 2033
- Figure 52: Middle East and Africa Ethyleneamines Industry Volume (K Tons), by Type 2025 & 2033
- Figure 53: Middle East and Africa Ethyleneamines Industry Revenue Share (%), by Type 2025 & 2033
- Figure 54: Middle East and Africa Ethyleneamines Industry Volume Share (%), by Type 2025 & 2033
- Figure 55: Middle East and Africa Ethyleneamines Industry Revenue (billion), by End-user Industry 2025 & 2033
- Figure 56: Middle East and Africa Ethyleneamines Industry Volume (K Tons), by End-user Industry 2025 & 2033
- Figure 57: Middle East and Africa Ethyleneamines Industry Revenue Share (%), by End-user Industry 2025 & 2033
- Figure 58: Middle East and Africa Ethyleneamines Industry Volume Share (%), by End-user Industry 2025 & 2033
- Figure 59: Middle East and Africa Ethyleneamines Industry Revenue (billion), by Country 2025 & 2033
- Figure 60: Middle East and Africa Ethyleneamines Industry Volume (K Tons), by Country 2025 & 2033
- Figure 61: Middle East and Africa Ethyleneamines Industry Revenue Share (%), by Country 2025 & 2033
- Figure 62: Middle East and Africa Ethyleneamines Industry Volume Share (%), by Country 2025 & 2033
- Figure 63: Saudi Arabia Ethyleneamines Industry Revenue (billion), by Type 2025 & 2033
- Figure 64: Saudi Arabia Ethyleneamines Industry Volume (K Tons), by Type 2025 & 2033
- Figure 65: Saudi Arabia Ethyleneamines Industry Revenue Share (%), by Type 2025 & 2033
- Figure 66: Saudi Arabia Ethyleneamines Industry Volume Share (%), by Type 2025 & 2033
- Figure 67: Saudi Arabia Ethyleneamines Industry Revenue (billion), by End-user Industry 2025 & 2033
- Figure 68: Saudi Arabia Ethyleneamines Industry Volume (K Tons), by End-user Industry 2025 & 2033
- Figure 69: Saudi Arabia Ethyleneamines Industry Revenue Share (%), by End-user Industry 2025 & 2033
- Figure 70: Saudi Arabia Ethyleneamines Industry Volume Share (%), by End-user Industry 2025 & 2033
- Figure 71: Saudi Arabia Ethyleneamines Industry Revenue (billion), by Country 2025 & 2033
- Figure 72: Saudi Arabia Ethyleneamines Industry Volume (K Tons), by Country 2025 & 2033
- Figure 73: Saudi Arabia Ethyleneamines Industry Revenue Share (%), by Country 2025 & 2033
- Figure 74: Saudi Arabia Ethyleneamines Industry Volume Share (%), by Country 2025 & 2033
List of Tables
- Table 1: Global Ethyleneamines Industry Revenue billion Forecast, by Type 2020 & 2033
- Table 2: Global Ethyleneamines Industry Volume K Tons Forecast, by Type 2020 & 2033
- Table 3: Global Ethyleneamines Industry Revenue billion Forecast, by End-user Industry 2020 & 2033
- Table 4: Global Ethyleneamines Industry Volume K Tons Forecast, by End-user Industry 2020 & 2033
- Table 5: Global Ethyleneamines Industry Revenue billion Forecast, by Region 2020 & 2033
- Table 6: Global Ethyleneamines Industry Volume K Tons Forecast, by Region 2020 & 2033
- Table 7: Global Ethyleneamines Industry Revenue billion Forecast, by Type 2020 & 2033
- Table 8: Global Ethyleneamines Industry Volume K Tons Forecast, by Type 2020 & 2033
- Table 9: Global Ethyleneamines Industry Revenue billion Forecast, by End-user Industry 2020 & 2033
- Table 10: Global Ethyleneamines Industry Volume K Tons Forecast, by End-user Industry 2020 & 2033
- Table 11: Global Ethyleneamines Industry Revenue billion Forecast, by Country 2020 & 2033
- Table 12: Global Ethyleneamines Industry Volume K Tons Forecast, by Country 2020 & 2033
- Table 13: China Ethyleneamines Industry Revenue (billion) Forecast, by Application 2020 & 2033
- Table 14: China Ethyleneamines Industry Volume (K Tons) Forecast, by Application 2020 & 2033
- Table 15: India Ethyleneamines Industry Revenue (billion) Forecast, by Application 2020 & 2033
- Table 16: India Ethyleneamines Industry Volume (K Tons) Forecast, by Application 2020 & 2033
- Table 17: Japan Ethyleneamines Industry Revenue (billion) Forecast, by Application 2020 & 2033
- Table 18: Japan Ethyleneamines Industry Volume (K Tons) Forecast, by Application 2020 & 2033
- Table 19: South Korea Ethyleneamines Industry Revenue (billion) Forecast, by Application 2020 & 2033
- Table 20: South Korea Ethyleneamines Industry Volume (K Tons) Forecast, by Application 2020 & 2033
- Table 21: Rest of Asia Pacific Ethyleneamines Industry Revenue (billion) Forecast, by Application 2020 & 2033
- Table 22: Rest of Asia Pacific Ethyleneamines Industry Volume (K Tons) Forecast, by Application 2020 & 2033
- Table 23: Global Ethyleneamines Industry Revenue billion Forecast, by Type 2020 & 2033
- Table 24: Global Ethyleneamines Industry Volume K Tons Forecast, by Type 2020 & 2033
- Table 25: Global Ethyleneamines Industry Revenue billion Forecast, by End-user Industry 2020 & 2033
- Table 26: Global Ethyleneamines Industry Volume K Tons Forecast, by End-user Industry 2020 & 2033
- Table 27: Global Ethyleneamines Industry Revenue billion Forecast, by Country 2020 & 2033
- Table 28: Global Ethyleneamines Industry Volume K Tons Forecast, by Country 2020 & 2033
- Table 29: United States Ethyleneamines Industry Revenue (billion) Forecast, by Application 2020 & 2033
- Table 30: United States Ethyleneamines Industry Volume (K Tons) Forecast, by Application 2020 & 2033
- Table 31: Canada Ethyleneamines Industry Revenue (billion) Forecast, by Application 2020 & 2033
- Table 32: Canada Ethyleneamines Industry Volume (K Tons) Forecast, by Application 2020 & 2033
- Table 33: Mexico Ethyleneamines Industry Revenue (billion) Forecast, by Application 2020 & 2033
- Table 34: Mexico Ethyleneamines Industry Volume (K Tons) Forecast, by Application 2020 & 2033
- Table 35: Rest of North America Ethyleneamines Industry Revenue (billion) Forecast, by Application 2020 & 2033
- Table 36: Rest of North America Ethyleneamines Industry Volume (K Tons) Forecast, by Application 2020 & 2033
- Table 37: Global Ethyleneamines Industry Revenue billion Forecast, by Type 2020 & 2033
- Table 38: Global Ethyleneamines Industry Volume K Tons Forecast, by Type 2020 & 2033
- Table 39: Global Ethyleneamines Industry Revenue billion Forecast, by End-user Industry 2020 & 2033
- Table 40: Global Ethyleneamines Industry Volume K Tons Forecast, by End-user Industry 2020 & 2033
- Table 41: Global Ethyleneamines Industry Revenue billion Forecast, by Country 2020 & 2033
- Table 42: Global Ethyleneamines Industry Volume K Tons Forecast, by Country 2020 & 2033
- Table 43: Germany Ethyleneamines Industry Revenue (billion) Forecast, by Application 2020 & 2033
- Table 44: Germany Ethyleneamines Industry Volume (K Tons) Forecast, by Application 2020 & 2033
- Table 45: United Kingdom Ethyleneamines Industry Revenue (billion) Forecast, by Application 2020 & 2033
- Table 46: United Kingdom Ethyleneamines Industry Volume (K Tons) Forecast, by Application 2020 & 2033
- Table 47: Italy Ethyleneamines Industry Revenue (billion) Forecast, by Application 2020 & 2033
- Table 48: Italy Ethyleneamines Industry Volume (K Tons) Forecast, by Application 2020 & 2033
- Table 49: France Ethyleneamines Industry Revenue (billion) Forecast, by Application 2020 & 2033
- Table 50: France Ethyleneamines Industry Volume (K Tons) Forecast, by Application 2020 & 2033
- Table 51: Rest of Europe Ethyleneamines Industry Revenue (billion) Forecast, by Application 2020 & 2033
- Table 52: Rest of Europe Ethyleneamines Industry Volume (K Tons) Forecast, by Application 2020 & 2033
- Table 53: Global Ethyleneamines Industry Revenue billion Forecast, by Type 2020 & 2033
- Table 54: Global Ethyleneamines Industry Volume K Tons Forecast, by Type 2020 & 2033
- Table 55: Global Ethyleneamines Industry Revenue billion Forecast, by End-user Industry 2020 & 2033
- Table 56: Global Ethyleneamines Industry Volume K Tons Forecast, by End-user Industry 2020 & 2033
- Table 57: Global Ethyleneamines Industry Revenue billion Forecast, by Country 2020 & 2033
- Table 58: Global Ethyleneamines Industry Volume K Tons Forecast, by Country 2020 & 2033
- Table 59: Brazil Ethyleneamines Industry Revenue (billion) Forecast, by Application 2020 & 2033
- Table 60: Brazil Ethyleneamines Industry Volume (K Tons) Forecast, by Application 2020 & 2033
- Table 61: Argentina Ethyleneamines Industry Revenue (billion) Forecast, by Application 2020 & 2033
- Table 62: Argentina Ethyleneamines Industry Volume (K Tons) Forecast, by Application 2020 & 2033
- Table 63: Rest of South America Ethyleneamines Industry Revenue (billion) Forecast, by Application 2020 & 2033
- Table 64: Rest of South America Ethyleneamines Industry Volume (K Tons) Forecast, by Application 2020 & 2033
- Table 65: Global Ethyleneamines Industry Revenue billion Forecast, by Type 2020 & 2033
- Table 66: Global Ethyleneamines Industry Volume K Tons Forecast, by Type 2020 & 2033
- Table 67: Global Ethyleneamines Industry Revenue billion Forecast, by End-user Industry 2020 & 2033
- Table 68: Global Ethyleneamines Industry Volume K Tons Forecast, by End-user Industry 2020 & 2033
- Table 69: Global Ethyleneamines Industry Revenue billion Forecast, by Country 2020 & 2033
- Table 70: Global Ethyleneamines Industry Volume K Tons Forecast, by Country 2020 & 2033
- Table 71: Global Ethyleneamines Industry Revenue billion Forecast, by Type 2020 & 2033
- Table 72: Global Ethyleneamines Industry Volume K Tons Forecast, by Type 2020 & 2033
- Table 73: Global Ethyleneamines Industry Revenue billion Forecast, by End-user Industry 2020 & 2033
- Table 74: Global Ethyleneamines Industry Volume K Tons Forecast, by End-user Industry 2020 & 2033
- Table 75: Global Ethyleneamines Industry Revenue billion Forecast, by Country 2020 & 2033
- Table 76: Global Ethyleneamines Industry Volume K Tons Forecast, by Country 2020 & 2033
- Table 77: South Africa Ethyleneamines Industry Revenue (billion) Forecast, by Application 2020 & 2033
- Table 78: South Africa Ethyleneamines Industry Volume (K Tons) Forecast, by Application 2020 & 2033
- Table 79: Rest of Middle East Ethyleneamines Industry Revenue (billion) Forecast, by Application 2020 & 2033
- Table 80: Rest of Middle East Ethyleneamines Industry Volume (K Tons) Forecast, by Application 2020 & 2033
Frequently Asked Questions
1. What is the projected Compound Annual Growth Rate (CAGR) of the Ethyleneamines Industry?
The projected CAGR is approximately 4.9%.
2. Which companies are prominent players in the Ethyleneamines Industry?
Key companies in the market include Nouryon, Saudi Basic Industries Corporation (SABIC), Fisher Chemical, Oriental Union Chemical Corporation, BASF SE, Huntsman International LLC, Diamines and Chemicals Ltd, Arabian Amines Company, Dow, Delamine BV, Tosoh Corporation, Sadara Chemical Company.
3. What are the main segments of the Ethyleneamines Industry?
The market segments include Type, End-user Industry.
4. Can you provide details about the market size?
The market size is estimated to be USD 2.9 billion as of 2022.
5. What are some drivers contributing to market growth?
Increasing Demand from Various End-user Industries; Accelerating Demand for Pesticides from Developing Countries; Developing Consumer Awareness Concerning Cleanliness and Hygiene.
6. What are the notable trends driving market growth?
The Adhesives. Paints. and Resins Industry to Dominate the Market.
7. Are there any restraints impacting market growth?
Hazardous Health Effects Due to Direct Exposure; Increasing Usage of Bio-based Products for Agriculture in Developed Countries.
8. Can you provide examples of recent developments in the market?
In May 2022, BASF and SINOPEC announced the construction of their new plant in Nanjing, China, expanding the production capacities of ethyleneamines to serve the growing demand from various industries in the Chinese market.
9. What pricing options are available for accessing the report?
Pricing options include single-user, multi-user, and enterprise licenses priced at USD 4750, USD 5250, and USD 8750 respectively.
10. Is the market size provided in terms of value or volume?
The market size is provided in terms of value, measured in billion and volume, measured in K Tons.
11. Are there any specific market keywords associated with the report?
Yes, the market keyword associated with the report is "Ethyleneamines Industry," which aids in identifying and referencing the specific market segment covered.
12. How do I determine which pricing option suits my needs best?
The pricing options vary based on user requirements and access needs. Individual users may opt for single-user licenses, while businesses requiring broader access may choose multi-user or enterprise licenses for cost-effective access to the report.
13. Are there any additional resources or data provided in the Ethyleneamines Industry report?
While the report offers comprehensive insights, it's advisable to review the specific contents or supplementary materials provided to ascertain if additional resources or data are available.
14. How can I stay updated on further developments or reports in the Ethyleneamines Industry?
To stay informed about further developments, trends, and reports in the Ethyleneamines Industry, consider subscribing to industry newsletters, following relevant companies and organizations, or regularly checking reputable industry news sources and publications.
Methodology
Step 1 - Identification of Relevant Samples Size from Population Database


Step 2 - Approaches for Defining Global Market Size (Value, Volume* & Price*)

Note*: In applicable scenarios
Step 3 - Data Sources
Primary Research
- Web Analytics
- Survey Reports
- Research Institute
- Latest Research Reports
- Opinion Leaders
Secondary Research
- Annual Reports
- White Paper
- Latest Press Release
- Industry Association
- Paid Database
- Investor Presentations

Step 4 - Data Triangulation
Involves using different sources of information in order to increase the validity of a study
These sources are likely to be stakeholders in a program - participants, other researchers, program staff, other community members, and so on.
Then we put all data in single framework & apply various statistical tools to find out the dynamic on the market.
During the analysis stage, feedback from the stakeholder groups would be compared to determine areas of agreement as well as areas of divergence