

Key Insights
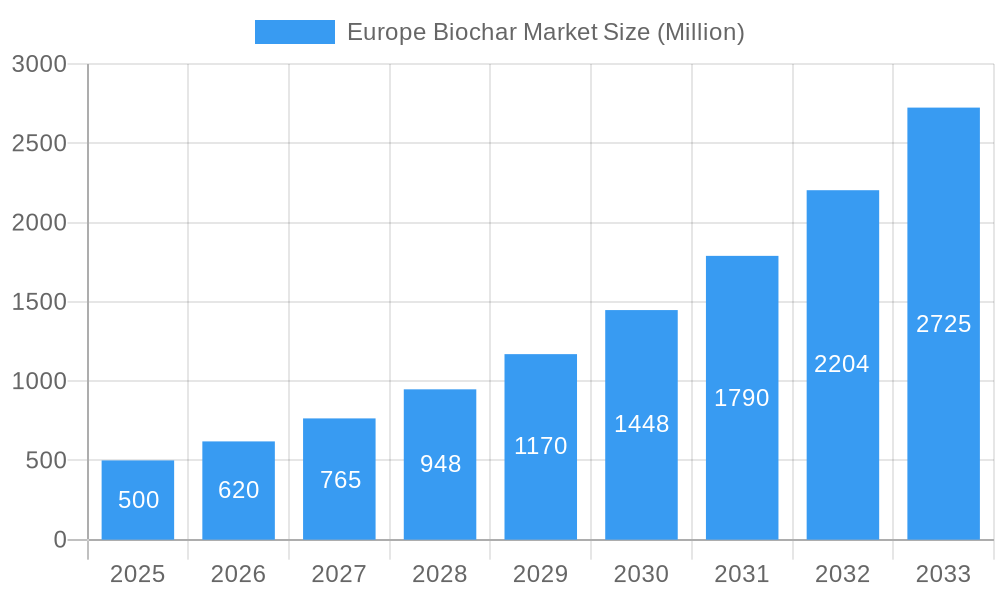
The European biochar market is projected for substantial growth, with an estimated market size of $0.62 billion by 2025. This growth is underpinned by a robust Compound Annual Growth Rate (CAGR) of 15% (2019-2025). Key drivers include increasing environmental consciousness, stringent regulations promoting sustainable agriculture, and a rising demand for carbon-negative solutions. Biochar's adoption as a soil amendment for enhanced fertility and water retention, its role in carbon sequestration for climate change mitigation, and its diverse industrial applications are fueling market expansion. Ongoing research and development in production techniques and a broadening application scope, including water purification and bioenergy, further stimulate growth. While challenges like production costs and quality control standardization persist, the market outlook remains highly positive.
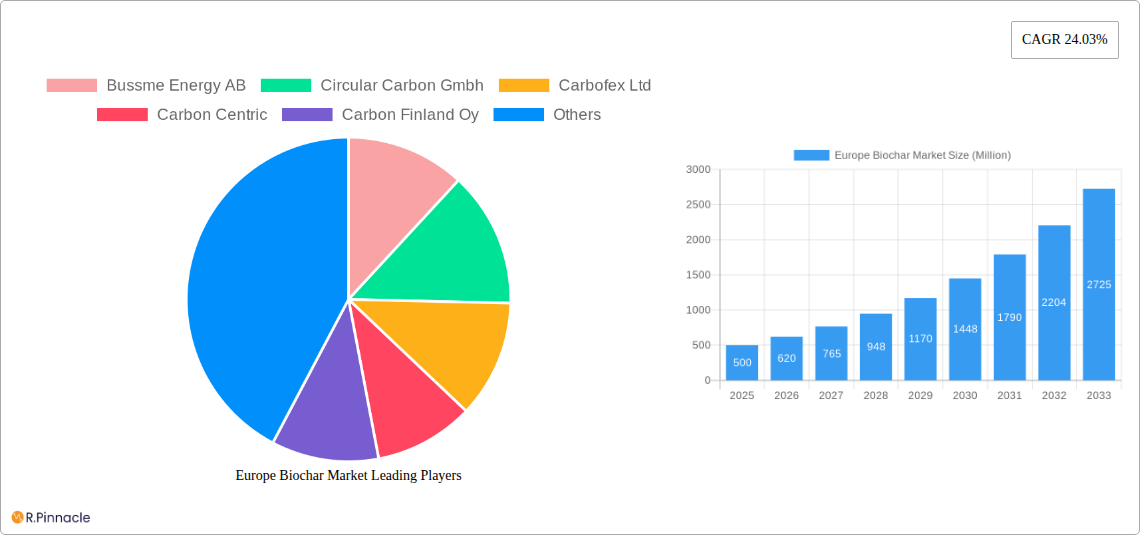
Europe Biochar Market Market Size (In Million)
The competitive arena features a blend of established companies and innovative startups. Key market participants, such as Bussme Energy AB and Circular Carbon GmbH, are actively engaged in biochar production, distribution, and application. Market dynamics are expected to vary regionally, influenced by agricultural practices, government incentives, and biomass feedstock availability. Segmentation is anticipated across various feedstock types (wood, agricultural residues) and applications (soil amendment, water treatment). Future expansion hinges on continuous innovation, supportive government policies, and heightened consumer awareness of biochar's environmental advantages. Advancements in production technology and the development of resilient supply chains will be crucial for sustained market growth.
Europe Biochar Market Company Market Share
This report offers a comprehensive analysis of the European biochar market, providing critical insights for industry stakeholders, investors, and strategists. The study period spans 2019-2033, with 2025 designated as the base and estimated year. Leveraging extensive research and data analysis, this report clarifies market dynamics, growth drivers, challenges, and future opportunities.
Europe Biochar Market Structure & Innovation Trends
This section analyzes the competitive landscape, innovation drivers, and regulatory influences shaping the European biochar market. The market is characterized by a moderately fragmented structure with several key players and numerous smaller companies. Market share data for individual players is unavailable for this report (xx%). However, key players, discussed later, are actively involved in market consolidation through mergers and acquisitions (M&A). The total value of M&A deals in the sector during the historical period (2019-2024) is estimated at xx Million.
- Market Concentration: Moderately fragmented.
- Innovation Drivers: Growing demand for sustainable solutions, stringent environmental regulations, technological advancements in biochar production, and increasing awareness of carbon sequestration.
- Regulatory Frameworks: EU policies promoting renewable energy and carbon neutrality significantly influence market growth. Specific regulations vary across countries within Europe.
- Product Substitutes: Other soil amendments and carbon sequestration methods pose some level of competition.
- End-User Demographics: The primary end-users are agricultural sectors (e.g., soil amendment), industrial applications (e.g., water treatment), and environmental remediation projects. Market penetration in each segment is currently under investigation (xx%).
- M&A Activities: Several significant M&A activities have been observed recently, indicating a trend towards consolidation and increased investment in the sector.
Europe Biochar Market Dynamics & Trends
The European biochar market exhibits significant growth potential driven by increasing environmental concerns, stringent carbon emission reduction targets, and the rising demand for sustainable agricultural practices. The market is expected to experience a Compound Annual Growth Rate (CAGR) of xx% during the forecast period (2025-2033). This growth is largely attributed to:
- Technological Disruptions: Advancements in biochar production technologies, improving efficiency and reducing costs.
- Consumer Preferences: Growing preference for eco-friendly and sustainable products across various sectors.
- Competitive Dynamics: Intense competition among established players and emerging companies is driving innovation and improving product offerings.
- Market Growth Drivers: Stringent environmental regulations, increasing awareness of climate change, and the need for carbon sequestration solutions.
Dominant Regions & Segments in Europe Biochar Market
Germany currently holds the leading position in the European biochar market due to its strong focus on renewable energy, robust industrial base, and supportive government policies. Other key regions are experiencing significant growth, though data for regional market shares is currently unavailable (xx%).
- Germany: Strong industrial base, supportive government policies, and significant investments in renewable energy projects.
- Other Leading Regions (Qualitative): Countries with strong agricultural sectors and ambitious environmental targets are also expected to witness significant growth in biochar adoption.
Europe Biochar Market Product Innovations
Recent innovations focus on improving biochar production efficiency, optimizing its properties for specific applications, and expanding its use cases. New production methods focus on utilizing waste biomass streams, reducing costs, and enhancing sustainability. Competition is driving manufacturers to focus on product differentiation, targeting niche applications, and creating value-added products.
Report Scope & Segmentation Analysis
This report segments the Europe biochar market based on several parameters. Further details on segment-specific growth projections, market sizes, and competitive dynamics are available in the full report. Data for these specifics is not yet available and will be populated in the final report.
Key Drivers of Europe Biochar Market Growth
The growth of the Europe biochar market is primarily driven by:
- Technological Advancements: Improved production methods and increased efficiency.
- Economic Factors: Government incentives and subsidies for sustainable technologies.
- Regulatory Landscape: Stringent environmental regulations and carbon reduction targets.
Challenges in the Europe Biochar Market Sector
The Europe biochar market faces several challenges:
- High Initial Investment Costs: Setting up biochar production facilities requires significant capital investment.
- Supply Chain Issues: Securing consistent and high-quality biomass feedstock.
- Competition from Substitutes: Other soil amendments and carbon sequestration technologies.
Emerging Opportunities in Europe Biochar Market
Several emerging opportunities exist:
- Expansion into New Applications: Exploring new applications for biochar in various sectors (e.g., construction materials, water purification).
- Technological Innovation: Developing more efficient and cost-effective biochar production methods.
- Growing Demand from Agriculture: Increasing demand for biochar as a sustainable soil amendment.
Leading Players in the Europe Biochar Market Market
- Bussme Energy AB
- Circular Carbon GmbH
- Carbofex Ltd
- Carbon Centric
- Carbon Finland Oy
- Carbon Gold Ltd
- Carbuna
- Charline GmbH
- Egos GmbH
- Eoc Energy Ocean
- Lucrat GmbH
- Nettenergy BV
- Novocarbo GmbH
- Sonnenerde GmbH
- Verora AG
- List Not Exhaustive
Key Developments in Europe Biochar Market Industry
- March 2024: Novocarbo raised EUR 25 Million (USD 27 Million) to construct 200 carbon removal parks in Europe by 2033.
- November 2023: Novocarbo opened Germany's largest carbon removal park.
- November 2022: Novocarbo GmbH and ThyssenKrupp launched a new decarbonization plant producing regenerative heat and biochar.
- October 2022: Sonnenerde announced the construction of its first industrial biochar production plant in Europe.
Future Outlook for Europe Biochar Market Market
The European biochar market is poised for significant growth, driven by increasing environmental awareness, supportive government policies, and technological advancements. The market is expected to witness substantial expansion across various segments and geographies. Strategic partnerships, technological innovation, and diversification into new applications will further shape the future of the industry.
Europe Biochar Market Segmentation
-
1. Technology
- 1.1. Pyrolysis
- 1.2. Gasification Systems
- 1.3. Other Technologies
-
2. Application
- 2.1. Agriculture
- 2.2. Animal Farming
- 2.3. Industrial Uses
- 2.4. Other Applications
Europe Biochar Market Segmentation By Geography
- 1. Germany
- 2. United Kingdom
- 3. France
- 4. Italy
- 5. Spain
- 6. Nordic
- 7. Turkey
- 8. Russia
- 9. Rest of Europe
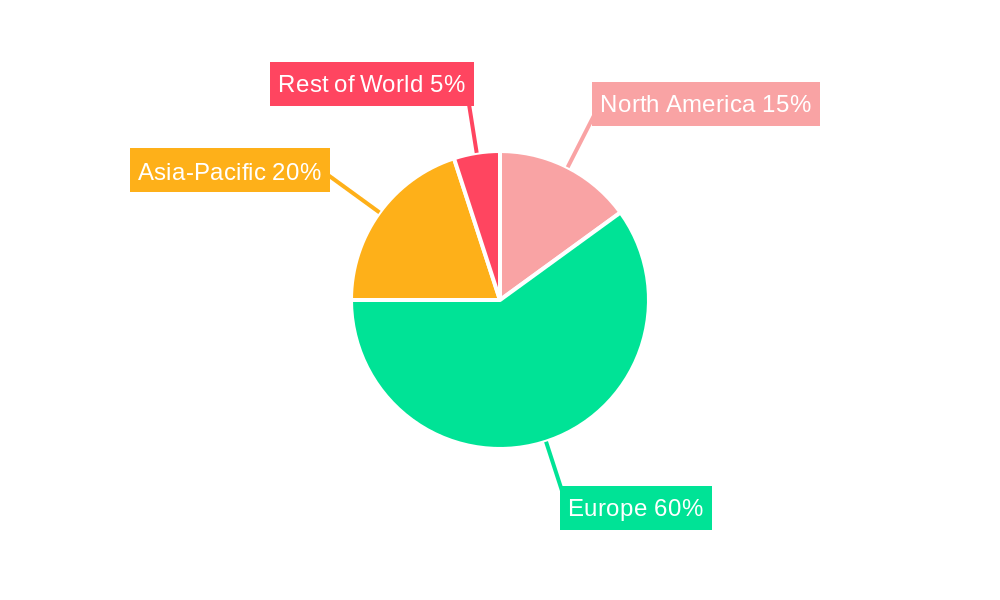
Europe Biochar Market Regional Market Share
Geographic Coverage of Europe Biochar Market
Europe Biochar Market REPORT HIGHLIGHTS
| Aspects | Details |
|---|---|
| Study Period | 2020-2034 |
| Base Year | 2025 |
| Estimated Year | 2026 |
| Forecast Period | 2026-2034 |
| Historical Period | 2020-2025 |
| Growth Rate | CAGR of 15% from 2020-2034 |
| Segmentation |
|
Table of Contents
- 1. Introduction
- 1.1. Research Scope
- 1.2. Market Segmentation
- 1.3. Research Objective
- 1.4. Definitions and Assumptions
- 2. Executive Summary
- 2.1. Market Snapshot
- 3. Market Dynamics
- 3.1. Market Drivers
- 3.2. Market Restrains
- 3.3. Market Trends
- 3.4. Market Opportunities
- 4. Market Factor Analysis
- 4.1. Porters Five Forces
- 4.1.1. Bargaining Power of Suppliers
- 4.1.2. Bargaining Power of Buyers
- 4.1.3. Threat of New Entrants
- 4.1.4. Threat of Substitutes
- 4.1.5. Competitive Rivalry
- 4.2. PESTEL analysis
- 4.3. BCG Analysis
- 4.3.1. Stars (High Growth, High Market Share)
- 4.3.2. Cash Cows (Low Growth, High Market Share)
- 4.3.3. Question Mark (High Growth, Low Market Share)
- 4.3.4. Dogs (Low Growth, Low Market Share)
- 4.4. Ansoff Matrix Analysis
- 4.5. Supply Chain Analysis
- 4.6. Regulatory Landscape
- 4.7. Current Market Potential and Opportunity Assessment (TAM–SAM–SOM Framework)
- 4.8. PRI Analyst Note
- 4.1. Porters Five Forces
- 5. Market Analysis, Insights and Forecast 2021-2033
- 5.1. Market Analysis, Insights and Forecast - by Technology
- 5.1.1. Pyrolysis
- 5.1.2. Gasification Systems
- 5.1.3. Other Technologies
- 5.2. Market Analysis, Insights and Forecast - by Application
- 5.2.1. Agriculture
- 5.2.2. Animal Farming
- 5.2.3. Industrial Uses
- 5.2.4. Other Applications
- 5.3. Market Analysis, Insights and Forecast - by Region
- 5.3.1. Germany
- 5.3.2. United Kingdom
- 5.3.3. France
- 5.3.4. Italy
- 5.3.5. Spain
- 5.3.6. Nordic
- 5.3.7. Turkey
- 5.3.8. Russia
- 5.3.9. Rest of Europe
- 5.1. Market Analysis, Insights and Forecast - by Technology
- 6. Global Europe Biochar Market Analysis, Insights and Forecast, 2021-2033
- 6.1. Market Analysis, Insights and Forecast - by Technology
- 6.1.1. Pyrolysis
- 6.1.2. Gasification Systems
- 6.1.3. Other Technologies
- 6.2. Market Analysis, Insights and Forecast - by Application
- 6.2.1. Agriculture
- 6.2.2. Animal Farming
- 6.2.3. Industrial Uses
- 6.2.4. Other Applications
- 6.1. Market Analysis, Insights and Forecast - by Technology
- 7. Germany Europe Biochar Market Analysis, Insights and Forecast, 2020-2032
- 7.1. Market Analysis, Insights and Forecast - by Technology
- 7.1.1. Pyrolysis
- 7.1.2. Gasification Systems
- 7.1.3. Other Technologies
- 7.2. Market Analysis, Insights and Forecast - by Application
- 7.2.1. Agriculture
- 7.2.2. Animal Farming
- 7.2.3. Industrial Uses
- 7.2.4. Other Applications
- 7.1. Market Analysis, Insights and Forecast - by Technology
- 8. United Kingdom Europe Biochar Market Analysis, Insights and Forecast, 2020-2032
- 8.1. Market Analysis, Insights and Forecast - by Technology
- 8.1.1. Pyrolysis
- 8.1.2. Gasification Systems
- 8.1.3. Other Technologies
- 8.2. Market Analysis, Insights and Forecast - by Application
- 8.2.1. Agriculture
- 8.2.2. Animal Farming
- 8.2.3. Industrial Uses
- 8.2.4. Other Applications
- 8.1. Market Analysis, Insights and Forecast - by Technology
- 9. France Europe Biochar Market Analysis, Insights and Forecast, 2020-2032
- 9.1. Market Analysis, Insights and Forecast - by Technology
- 9.1.1. Pyrolysis
- 9.1.2. Gasification Systems
- 9.1.3. Other Technologies
- 9.2. Market Analysis, Insights and Forecast - by Application
- 9.2.1. Agriculture
- 9.2.2. Animal Farming
- 9.2.3. Industrial Uses
- 9.2.4. Other Applications
- 9.1. Market Analysis, Insights and Forecast - by Technology
- 10. Italy Europe Biochar Market Analysis, Insights and Forecast, 2020-2032
- 10.1. Market Analysis, Insights and Forecast - by Technology
- 10.1.1. Pyrolysis
- 10.1.2. Gasification Systems
- 10.1.3. Other Technologies
- 10.2. Market Analysis, Insights and Forecast - by Application
- 10.2.1. Agriculture
- 10.2.2. Animal Farming
- 10.2.3. Industrial Uses
- 10.2.4. Other Applications
- 10.1. Market Analysis, Insights and Forecast - by Technology
- 11. Spain Europe Biochar Market Analysis, Insights and Forecast, 2020-2032
- 11.1. Market Analysis, Insights and Forecast - by Technology
- 11.1.1. Pyrolysis
- 11.1.2. Gasification Systems
- 11.1.3. Other Technologies
- 11.2. Market Analysis, Insights and Forecast - by Application
- 11.2.1. Agriculture
- 11.2.2. Animal Farming
- 11.2.3. Industrial Uses
- 11.2.4. Other Applications
- 11.1. Market Analysis, Insights and Forecast - by Technology
- 12. Nordic Europe Biochar Market Analysis, Insights and Forecast, 2020-2032
- 12.1. Market Analysis, Insights and Forecast - by Technology
- 12.1.1. Pyrolysis
- 12.1.2. Gasification Systems
- 12.1.3. Other Technologies
- 12.2. Market Analysis, Insights and Forecast - by Application
- 12.2.1. Agriculture
- 12.2.2. Animal Farming
- 12.2.3. Industrial Uses
- 12.2.4. Other Applications
- 12.1. Market Analysis, Insights and Forecast - by Technology
- 13. Turkey Europe Biochar Market Analysis, Insights and Forecast, 2020-2032
- 13.1. Market Analysis, Insights and Forecast - by Technology
- 13.1.1. Pyrolysis
- 13.1.2. Gasification Systems
- 13.1.3. Other Technologies
- 13.2. Market Analysis, Insights and Forecast - by Application
- 13.2.1. Agriculture
- 13.2.2. Animal Farming
- 13.2.3. Industrial Uses
- 13.2.4. Other Applications
- 13.1. Market Analysis, Insights and Forecast - by Technology
- 14. Russia Europe Biochar Market Analysis, Insights and Forecast, 2020-2032
- 14.1. Market Analysis, Insights and Forecast - by Technology
- 14.1.1. Pyrolysis
- 14.1.2. Gasification Systems
- 14.1.3. Other Technologies
- 14.2. Market Analysis, Insights and Forecast - by Application
- 14.2.1. Agriculture
- 14.2.2. Animal Farming
- 14.2.3. Industrial Uses
- 14.2.4. Other Applications
- 14.1. Market Analysis, Insights and Forecast - by Technology
- 15. Rest of Europe Europe Biochar Market Analysis, Insights and Forecast, 2020-2032
- 15.1. Market Analysis, Insights and Forecast - by Technology
- 15.1.1. Pyrolysis
- 15.1.2. Gasification Systems
- 15.1.3. Other Technologies
- 15.2. Market Analysis, Insights and Forecast - by Application
- 15.2.1. Agriculture
- 15.2.2. Animal Farming
- 15.2.3. Industrial Uses
- 15.2.4. Other Applications
- 15.1. Market Analysis, Insights and Forecast - by Technology
- 16. Competitive Analysis
- 16.1. Company Profiles
- 16.1.1 Bussme Energy AB
- 16.1.1.1. Company Overview
- 16.1.1.2. Products
- 16.1.1.3. Company Financials
- 16.1.1.4. SWOT Analysis
- 16.1.2 Circular Carbon Gmbh
- 16.1.2.1. Company Overview
- 16.1.2.2. Products
- 16.1.2.3. Company Financials
- 16.1.2.4. SWOT Analysis
- 16.1.3 Carbofex Ltd
- 16.1.3.1. Company Overview
- 16.1.3.2. Products
- 16.1.3.3. Company Financials
- 16.1.3.4. SWOT Analysis
- 16.1.4 Carbon Centric
- 16.1.4.1. Company Overview
- 16.1.4.2. Products
- 16.1.4.3. Company Financials
- 16.1.4.4. SWOT Analysis
- 16.1.5 Carbon Finland Oy
- 16.1.5.1. Company Overview
- 16.1.5.2. Products
- 16.1.5.3. Company Financials
- 16.1.5.4. SWOT Analysis
- 16.1.6 Carbon Gold Ltd
- 16.1.6.1. Company Overview
- 16.1.6.2. Products
- 16.1.6.3. Company Financials
- 16.1.6.4. SWOT Analysis
- 16.1.7 Carbuna
- 16.1.7.1. Company Overview
- 16.1.7.2. Products
- 16.1.7.3. Company Financials
- 16.1.7.4. SWOT Analysis
- 16.1.8 Charline Gmbh
- 16.1.8.1. Company Overview
- 16.1.8.2. Products
- 16.1.8.3. Company Financials
- 16.1.8.4. SWOT Analysis
- 16.1.9 Egos Gmbh
- 16.1.9.1. Company Overview
- 16.1.9.2. Products
- 16.1.9.3. Company Financials
- 16.1.9.4. SWOT Analysis
- 16.1.10 Eoc Energy Ocean
- 16.1.10.1. Company Overview
- 16.1.10.2. Products
- 16.1.10.3. Company Financials
- 16.1.10.4. SWOT Analysis
- 16.1.11 Lucrat Gmbh
- 16.1.11.1. Company Overview
- 16.1.11.2. Products
- 16.1.11.3. Company Financials
- 16.1.11.4. SWOT Analysis
- 16.1.12 Nettenergy BV
- 16.1.12.1. Company Overview
- 16.1.12.2. Products
- 16.1.12.3. Company Financials
- 16.1.12.4. SWOT Analysis
- 16.1.13 Novocarbo Gmbh
- 16.1.13.1. Company Overview
- 16.1.13.2. Products
- 16.1.13.3. Company Financials
- 16.1.13.4. SWOT Analysis
- 16.1.14 Sonnenerde Gmbh
- 16.1.14.1. Company Overview
- 16.1.14.2. Products
- 16.1.14.3. Company Financials
- 16.1.14.4. SWOT Analysis
- 16.1.15 Verora AG*List Not Exhaustive
- 16.1.15.1. Company Overview
- 16.1.15.2. Products
- 16.1.15.3. Company Financials
- 16.1.15.4. SWOT Analysis
- 16.1.1 Bussme Energy AB
- 16.2. Market Entropy
- 16.2.1 Company's Key Areas Served
- 16.2.2 Recent Developments
- 16.3. Company Market Share Analysis 2025
- 16.3.1 Top 5 Companies Market Share Analysis
- 16.3.2 Top 3 Companies Market Share Analysis
- 16.4. List of Potential Customers
- 17. Research Methodology
List of Figures
- Figure 1: Global Europe Biochar Market Revenue Breakdown (billion, %) by Region 2025 & 2033
- Figure 2: Germany Europe Biochar Market Revenue (billion), by Technology 2025 & 2033
- Figure 3: Germany Europe Biochar Market Revenue Share (%), by Technology 2025 & 2033
- Figure 4: Germany Europe Biochar Market Revenue (billion), by Application 2025 & 2033
- Figure 5: Germany Europe Biochar Market Revenue Share (%), by Application 2025 & 2033
- Figure 6: Germany Europe Biochar Market Revenue (billion), by Country 2025 & 2033
- Figure 7: Germany Europe Biochar Market Revenue Share (%), by Country 2025 & 2033
- Figure 8: United Kingdom Europe Biochar Market Revenue (billion), by Technology 2025 & 2033
- Figure 9: United Kingdom Europe Biochar Market Revenue Share (%), by Technology 2025 & 2033
- Figure 10: United Kingdom Europe Biochar Market Revenue (billion), by Application 2025 & 2033
- Figure 11: United Kingdom Europe Biochar Market Revenue Share (%), by Application 2025 & 2033
- Figure 12: United Kingdom Europe Biochar Market Revenue (billion), by Country 2025 & 2033
- Figure 13: United Kingdom Europe Biochar Market Revenue Share (%), by Country 2025 & 2033
- Figure 14: France Europe Biochar Market Revenue (billion), by Technology 2025 & 2033
- Figure 15: France Europe Biochar Market Revenue Share (%), by Technology 2025 & 2033
- Figure 16: France Europe Biochar Market Revenue (billion), by Application 2025 & 2033
- Figure 17: France Europe Biochar Market Revenue Share (%), by Application 2025 & 2033
- Figure 18: France Europe Biochar Market Revenue (billion), by Country 2025 & 2033
- Figure 19: France Europe Biochar Market Revenue Share (%), by Country 2025 & 2033
- Figure 20: Italy Europe Biochar Market Revenue (billion), by Technology 2025 & 2033
- Figure 21: Italy Europe Biochar Market Revenue Share (%), by Technology 2025 & 2033
- Figure 22: Italy Europe Biochar Market Revenue (billion), by Application 2025 & 2033
- Figure 23: Italy Europe Biochar Market Revenue Share (%), by Application 2025 & 2033
- Figure 24: Italy Europe Biochar Market Revenue (billion), by Country 2025 & 2033
- Figure 25: Italy Europe Biochar Market Revenue Share (%), by Country 2025 & 2033
- Figure 26: Spain Europe Biochar Market Revenue (billion), by Technology 2025 & 2033
- Figure 27: Spain Europe Biochar Market Revenue Share (%), by Technology 2025 & 2033
- Figure 28: Spain Europe Biochar Market Revenue (billion), by Application 2025 & 2033
- Figure 29: Spain Europe Biochar Market Revenue Share (%), by Application 2025 & 2033
- Figure 30: Spain Europe Biochar Market Revenue (billion), by Country 2025 & 2033
- Figure 31: Spain Europe Biochar Market Revenue Share (%), by Country 2025 & 2033
- Figure 32: Nordic Europe Biochar Market Revenue (billion), by Technology 2025 & 2033
- Figure 33: Nordic Europe Biochar Market Revenue Share (%), by Technology 2025 & 2033
- Figure 34: Nordic Europe Biochar Market Revenue (billion), by Application 2025 & 2033
- Figure 35: Nordic Europe Biochar Market Revenue Share (%), by Application 2025 & 2033
- Figure 36: Nordic Europe Biochar Market Revenue (billion), by Country 2025 & 2033
- Figure 37: Nordic Europe Biochar Market Revenue Share (%), by Country 2025 & 2033
- Figure 38: Turkey Europe Biochar Market Revenue (billion), by Technology 2025 & 2033
- Figure 39: Turkey Europe Biochar Market Revenue Share (%), by Technology 2025 & 2033
- Figure 40: Turkey Europe Biochar Market Revenue (billion), by Application 2025 & 2033
- Figure 41: Turkey Europe Biochar Market Revenue Share (%), by Application 2025 & 2033
- Figure 42: Turkey Europe Biochar Market Revenue (billion), by Country 2025 & 2033
- Figure 43: Turkey Europe Biochar Market Revenue Share (%), by Country 2025 & 2033
- Figure 44: Russia Europe Biochar Market Revenue (billion), by Technology 2025 & 2033
- Figure 45: Russia Europe Biochar Market Revenue Share (%), by Technology 2025 & 2033
- Figure 46: Russia Europe Biochar Market Revenue (billion), by Application 2025 & 2033
- Figure 47: Russia Europe Biochar Market Revenue Share (%), by Application 2025 & 2033
- Figure 48: Russia Europe Biochar Market Revenue (billion), by Country 2025 & 2033
- Figure 49: Russia Europe Biochar Market Revenue Share (%), by Country 2025 & 2033
- Figure 50: Rest of Europe Europe Biochar Market Revenue (billion), by Technology 2025 & 2033
- Figure 51: Rest of Europe Europe Biochar Market Revenue Share (%), by Technology 2025 & 2033
- Figure 52: Rest of Europe Europe Biochar Market Revenue (billion), by Application 2025 & 2033
- Figure 53: Rest of Europe Europe Biochar Market Revenue Share (%), by Application 2025 & 2033
- Figure 54: Rest of Europe Europe Biochar Market Revenue (billion), by Country 2025 & 2033
- Figure 55: Rest of Europe Europe Biochar Market Revenue Share (%), by Country 2025 & 2033
List of Tables
- Table 1: Global Europe Biochar Market Revenue billion Forecast, by Technology 2020 & 2033
- Table 2: Global Europe Biochar Market Revenue billion Forecast, by Application 2020 & 2033
- Table 3: Global Europe Biochar Market Revenue billion Forecast, by Region 2020 & 2033
- Table 4: Global Europe Biochar Market Revenue billion Forecast, by Technology 2020 & 2033
- Table 5: Global Europe Biochar Market Revenue billion Forecast, by Application 2020 & 2033
- Table 6: Global Europe Biochar Market Revenue billion Forecast, by Country 2020 & 2033
- Table 7: Global Europe Biochar Market Revenue billion Forecast, by Technology 2020 & 2033
- Table 8: Global Europe Biochar Market Revenue billion Forecast, by Application 2020 & 2033
- Table 9: Global Europe Biochar Market Revenue billion Forecast, by Country 2020 & 2033
- Table 10: Global Europe Biochar Market Revenue billion Forecast, by Technology 2020 & 2033
- Table 11: Global Europe Biochar Market Revenue billion Forecast, by Application 2020 & 2033
- Table 12: Global Europe Biochar Market Revenue billion Forecast, by Country 2020 & 2033
- Table 13: Global Europe Biochar Market Revenue billion Forecast, by Technology 2020 & 2033
- Table 14: Global Europe Biochar Market Revenue billion Forecast, by Application 2020 & 2033
- Table 15: Global Europe Biochar Market Revenue billion Forecast, by Country 2020 & 2033
- Table 16: Global Europe Biochar Market Revenue billion Forecast, by Technology 2020 & 2033
- Table 17: Global Europe Biochar Market Revenue billion Forecast, by Application 2020 & 2033
- Table 18: Global Europe Biochar Market Revenue billion Forecast, by Country 2020 & 2033
- Table 19: Global Europe Biochar Market Revenue billion Forecast, by Technology 2020 & 2033
- Table 20: Global Europe Biochar Market Revenue billion Forecast, by Application 2020 & 2033
- Table 21: Global Europe Biochar Market Revenue billion Forecast, by Country 2020 & 2033
- Table 22: Global Europe Biochar Market Revenue billion Forecast, by Technology 2020 & 2033
- Table 23: Global Europe Biochar Market Revenue billion Forecast, by Application 2020 & 2033
- Table 24: Global Europe Biochar Market Revenue billion Forecast, by Country 2020 & 2033
- Table 25: Global Europe Biochar Market Revenue billion Forecast, by Technology 2020 & 2033
- Table 26: Global Europe Biochar Market Revenue billion Forecast, by Application 2020 & 2033
- Table 27: Global Europe Biochar Market Revenue billion Forecast, by Country 2020 & 2033
- Table 28: Global Europe Biochar Market Revenue billion Forecast, by Technology 2020 & 2033
- Table 29: Global Europe Biochar Market Revenue billion Forecast, by Application 2020 & 2033
- Table 30: Global Europe Biochar Market Revenue billion Forecast, by Country 2020 & 2033
Frequently Asked Questions
1. What is the projected Compound Annual Growth Rate (CAGR) of the Europe Biochar Market?
The projected CAGR is approximately 15%.
2. Which companies are prominent players in the Europe Biochar Market?
Key companies in the market include Bussme Energy AB, Circular Carbon Gmbh, Carbofex Ltd, Carbon Centric, Carbon Finland Oy, Carbon Gold Ltd, Carbuna, Charline Gmbh, Egos Gmbh, Eoc Energy Ocean, Lucrat Gmbh, Nettenergy BV, Novocarbo Gmbh, Sonnenerde Gmbh, Verora AG*List Not Exhaustive.
3. What are the main segments of the Europe Biochar Market?
The market segments include Technology, Application.
4. Can you provide details about the market size?
The market size is estimated to be USD 0.62 billion as of 2022.
5. What are some drivers contributing to market growth?
Increasing Demand for Organic Farming in the Agricultural Industry; Increasing Focus on the Waste Management Sector; Others.
6. What are the notable trends driving market growth?
Increasing Demand from the Agricultural Industry.
7. Are there any restraints impacting market growth?
Increasing Demand for Organic Farming in the Agricultural Industry; Increasing Focus on the Waste Management Sector; Others.
8. Can you provide examples of recent developments in the market?
March 2024: Novocarbo raised EUR 25 million (USD 27 million) to construct 200 carbon removal parks in Europe by 2033. The company aims to expand the network for carbon capture and sequestration (CCS) and green heat across Europe.
9. What pricing options are available for accessing the report?
Pricing options include single-user, multi-user, and enterprise licenses priced at USD 4750, USD 5250, and USD 8750 respectively.
10. Is the market size provided in terms of value or volume?
The market size is provided in terms of value, measured in billion.
11. Are there any specific market keywords associated with the report?
Yes, the market keyword associated with the report is "Europe Biochar Market," which aids in identifying and referencing the specific market segment covered.
12. How do I determine which pricing option suits my needs best?
The pricing options vary based on user requirements and access needs. Individual users may opt for single-user licenses, while businesses requiring broader access may choose multi-user or enterprise licenses for cost-effective access to the report.
13. Are there any additional resources or data provided in the Europe Biochar Market report?
While the report offers comprehensive insights, it's advisable to review the specific contents or supplementary materials provided to ascertain if additional resources or data are available.
14. How can I stay updated on further developments or reports in the Europe Biochar Market?
To stay informed about further developments, trends, and reports in the Europe Biochar Market, consider subscribing to industry newsletters, following relevant companies and organizations, or regularly checking reputable industry news sources and publications.
Methodology
Step 1 - Identification of Relevant Samples Size from Population Database


Step 2 - Approaches for Defining Global Market Size (Value, Volume* & Price*)

Note*: In applicable scenarios
Step 3 - Data Sources
Primary Research
- Web Analytics
- Survey Reports
- Research Institute
- Latest Research Reports
- Opinion Leaders
Secondary Research
- Annual Reports
- White Paper
- Latest Press Release
- Industry Association
- Paid Database
- Investor Presentations

Step 4 - Data Triangulation
Involves using different sources of information in order to increase the validity of a study
These sources are likely to be stakeholders in a program - participants, other researchers, program staff, other community members, and so on.
Then we put all data in single framework & apply various statistical tools to find out the dynamic on the market.
During the analysis stage, feedback from the stakeholder groups would be compared to determine areas of agreement as well as areas of divergence