

Key Insights
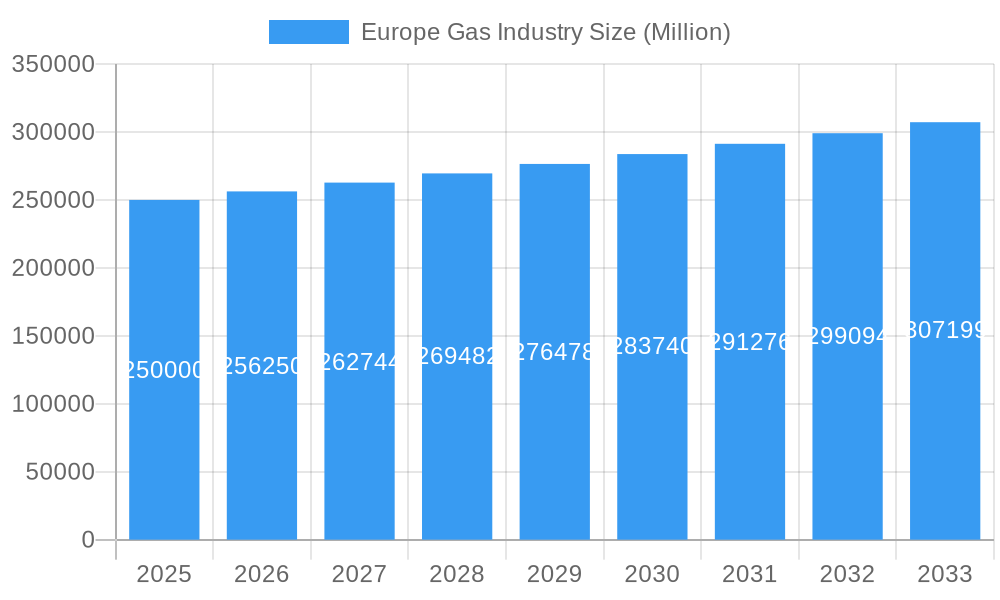
The European natural gas market, estimated at 1223.8 million in 2024, is poised for robust expansion. Projected to grow at a Compound Annual Growth Rate (CAGR) of 4.5% through 2033, this growth is underpinned by several critical drivers. Industrial sector expansion, particularly in manufacturing and energy production, is sustaining significant demand for natural gas. Concurrently, its role as a transitional fuel in the shift towards cleaner energy sources, offering a more sustainable alternative to coal in power generation, is a key contributor. Government initiatives prioritizing energy security and diversification are also stimulating investment in gas infrastructure and exploration.
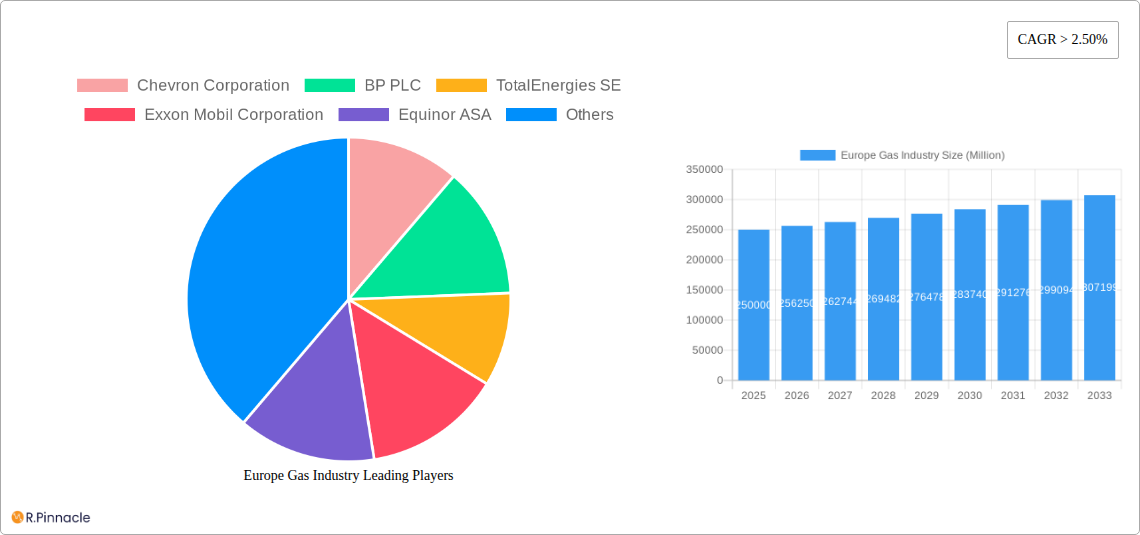
Europe Gas Industry Market Size (In Billion)
However, the market navigates several challenges. Volatile global energy prices introduce uncertainty in supply and demand dynamics. Environmental concerns regarding natural gas consumption and its carbon footprint are increasing pressure for stringent emission regulations and accelerated adoption of renewable energy. Geopolitical instability in key gas-producing regions presents risks to supply chain reliability. Market segmentation highlights varied demand across European nations. Leading industry players, including Chevron, BP, TotalEnergies, ExxonMobil, and Equinor, are actively engaged in exploration, production, and downstream operations. The long-term forecast indicates continued growth, driven by ongoing industrial requirements, though the pace will be influenced by renewable energy integration and evolving geopolitical landscapes.
Europe Gas Industry Company Market Share
The forecast period, 2025-2033, is anticipated to feature enhanced efficiency across the gas value chain, increased investment in Liquefied Natural Gas (LNG) infrastructure for improved import capacity, and a potential rise in Carbon Capture and Storage (CCS) technologies to address environmental impacts. The competitive environment will remain dynamic, with major companies pursuing strategic alliances, mergers, and technological innovations to fortify their market positions. Regulatory frameworks and policy shifts will continue to shape market direction, influencing investment strategies and potentially accelerating the adoption of alternative energy solutions. The market's sensitivity to geopolitical events and global economic trends remains a crucial factor in assessing its long-term growth trajectory.
Europe Gas Industry Market Report: 2019-2033 Forecast
This comprehensive report provides an in-depth analysis of the Europe gas industry, offering actionable insights for industry professionals, investors, and stakeholders. Covering the period 2019-2033, with a base year of 2025 and a forecast period of 2025-2033, this report leverages extensive data and expert analysis to illuminate market trends, dynamics, and future opportunities. The report meticulously analyzes market structure, innovation, dominant regions, leading players, and key developments, equipping readers with the knowledge needed to navigate the evolving landscape of the European gas market. Total market value predictions are in Millions.
Europe Gas Industry Market Structure & Innovation Trends
This section provides an in-depth analysis of the European gas industry's competitive landscape, exploring market concentration, key innovation drivers, evolving regulatory frameworks, and significant M&A activities. We delve into the dynamics of product substitution and analyze end-user demographics to offer a comprehensive understanding of the market structure, highlighting the ongoing transition towards cleaner and more sustainable energy solutions.
- Market Concentration: The European gas market is characterized by a moderately concentrated structure, with a few major players commanding a significant market share. The top five players currently hold approximately (xx)% of the market, indicating a competitive yet consolidated environment. This concentration influences pricing, investment strategies, and the pace of innovation.
- Innovation Drivers: A powerful confluence of stringent environmental regulations and a growing societal demand for cleaner energy sources is the primary catalyst for innovation within the gas industry. This is leading to significant advancements in gas technologies, including the accelerated exploration and integration of renewable gas sources (such as biomethane and hydrogen) and the critical development of Carbon Capture, Utilization, and Storage (CCUS) technologies.
- Regulatory Frameworks: The industry's operations are profoundly shaped by the prevailing regulatory environment. The complex mosaic of varied national regulations across Europe presents unique challenges for operators. Upcoming legislative initiatives, particularly those focused on methane emissions reduction and enhanced carbon pricing mechanisms, are poised to further redefine the market's trajectory and operational imperatives.
- Product Substitutes: Competition is intensifying from a range of renewable energy sources, most notably wind and solar power, which directly impact gas demand. Furthermore, the accelerating transition towards electric vehicles presents a notable challenge to gas consumption, particularly within the transportation sector, prompting diversification strategies within the industry.
- End-User Demographics: The industrial sector continues to be the largest consumer of gas, driven by its critical role in manufacturing processes and energy-intensive operations. This is followed by the residential and commercial sectors, which represent substantial demand. Industrial demand, in particular, is closely correlated with economic activity, manufacturing output, and industrial policy.
- M&A Activities: The European gas sector has experienced robust merger and acquisition (M&A) activity in recent years. Deal values during the historical period have aggregated to approximately xx Million Euros. These strategic transactions underscore companies' efforts to consolidate market share, achieve economies of scale, enhance operational efficiencies, and adapt to the evolving energy landscape.
Europe Gas Industry Market Dynamics & Trends
This section explores the key drivers and trends shaping the European gas market, examining growth rates, technological advancements, and consumer behavior. We analyze competitive dynamics, including market share evolution and strategic initiatives by key players.
The European gas market is projected to experience a Compound Annual Growth Rate (CAGR) of xx% during the forecast period (2025-2033). Market penetration of various gas segments is evaluated, including natural gas and liquefied natural gas (LNG). Factors influencing market growth include economic recovery, industrial activity, and regulatory changes. The increasing adoption of energy-efficient technologies and fluctuating prices have influenced consumer preference for gas. Competitive dynamics are largely driven by pricing strategies and investments in infrastructure upgrades.
Dominant Regions & Segments in Europe Gas Industry
This section pinpoints the leading geographical regions and key segments within the dynamic European gas market. We conduct a thorough analysis of the underlying factors contributing to regional dominance, including critical infrastructure, supportive economic policies, and the influence of specific regulatory frameworks.
-
Germany: Germany stands out as the dominant region, primarily due to its exceptionally high industrial output and substantial overall energy demands, which necessitate a significant and reliable gas supply.
-
Key Drivers for Germany's Dominance:
- A profoundly robust industrial base and a thriving manufacturing sector, which are inherently gas-intensive.
- An extensive and well-developed gas pipeline infrastructure network, ensuring efficient distribution and supply.
- Proactive government support for the development and modernization of energy infrastructure, fostering investment and growth.
-
Other Key Regions: Beyond Germany, other nations such as the United Kingdom, France, Italy, and the Netherlands maintain significant market positions. These countries' prominence is driven by a combination of similar factors, including industrial importance, established infrastructure, and national energy strategies.
-
Segment Analysis: While natural gas remains the predominant segment, the increasing adoption and strategic importance of Liquefied Natural Gas (LNG) are significant contributors to market expansion and flexibility. The industrial segment commands the largest market share, reflecting its critical role in the economy, though residential and commercial consumption also represent substantial and vital components of the overall market.
Europe Gas Industry Product Innovations
This section highlights key product developments in the European gas industry, focusing on technological advancements and their impact on market competitiveness. Technological trends that are shaping the market, include the development of improved gas transportation and storage systems, as well as the increased utilization of data analytics to optimize gas operations. New applications of gas, such as in the production of sustainable fuels, are also driving innovation.
Report Scope & Segmentation Analysis
This report segments the European gas market based on gas type (natural gas, LNG), end-use sector (residential, commercial, industrial), and region (Germany, UK, France, Italy, etc.). Each segment is thoroughly analyzed, providing market size estimates, growth projections, and competitive landscapes. Natural gas currently dominates the market, but LNG is expected to witness significant growth, driven by growing demand for flexible and secure gas supply.
Key Drivers of Europe Gas Industry Growth
A confluence of potent factors is actively propelling growth within the European gas industry. These include the sustained increase in industrial production, particularly within sectors that exhibit a high reliance on gas for their operations, coupled with robust government support for the development of essential gas infrastructure. The unyielding demand for energy reliability, a cornerstone of modern economies, further bolsters the industry. Furthermore, advancements in the exploration and development of new gas fields, alongside continuous improvements in extraction and processing technologies, are instrumental in ensuring a secure and consistent supply of natural gas to meet market needs.
Challenges in the Europe Gas Industry Sector
The European gas industry faces several challenges. These include: the increasing price volatility of natural gas, the transition to a lower-carbon energy system, concerns about energy security, and increasingly stringent environmental regulations, all contributing to operational complexity and increased costs for companies. Competition from renewable energy sources further intensifies these challenges.
Emerging Opportunities in Europe Gas Industry
Despite the inherent challenges and the evolving energy landscape, several compelling opportunities are emerging within the European gas industry. These include the escalating demand for Liquefied Natural Gas (LNG) as a flexible, scalable, and secure gas supply solution, particularly in light of geopolitical shifts. There is also a burgeoning interest and significant investment in renewable gas technologies, such as biomethane production from organic waste, offering a sustainable alternative. Expansion opportunities are also present in developing markets that are increasing their energy consumption. Moreover, the industry is well-positioned to capitalize on continuous innovations in gas storage, advanced distribution networks, and cutting-edge end-use technologies that enhance efficiency and reduce environmental impact.
Leading Players in the Europe Gas Industry Market
- Chevron Corporation
- BP PLC
- TotalEnergies SE
- Exxon Mobil Corporation
- Equinor ASA
- NK Lukoil PAO
- Gazprom PJSC ADR
- Rosneft Oil Co PJSC
- List Not Exhaustive
Key Developments in Europe Gas Industry Industry
- September 2022: Russia's Gazprom announced shipping 42.4 million cubic meters (mcm) of natural gas to Europe via Ukraine. This move was a strategic shift aimed at reducing reliance on the US dollar.
- September 2022: The Baltic Pipe was inaugurated, connecting Norway, Denmark, and Poland. This pipeline significantly increased gas import capacity to Poland from Norway (up to 10 billion cubic meters (bcm) annually) and allows gas transport between Poland and Denmark (up to three bcm annually). This development enhanced regional energy security and diversification of gas sources.
Future Outlook for Europe Gas Industry Market
The European gas industry is strategically positioned for continued growth, though this evolution will be characterized by a discernible shift towards a more sustainable and diversified energy mix. Key to sustained market growth will be strategic and substantial investments in LNG infrastructure, ensuring global supply chain resilience, alongside the aggressive exploration and integration of renewable gas options, such as hydrogen and advanced biomethane. An intensified focus on energy efficiency across all sectors and the proactive adoption of innovative technologies will be paramount in navigating future challenges, mitigating risks, and unlocking new avenues for growth and profitability in the evolving energy economy.
Europe Gas Industry Segmentation
-
1. Application
- 1.1. Utilities
- 1.2. Industrial
- 1.3. Commercial
Europe Gas Industry Segmentation By Geography
- 1. Germany
- 2. United Kingdom
- 3. France
- 4. Italy
- 5. Spain
- 6. Rest of Europe
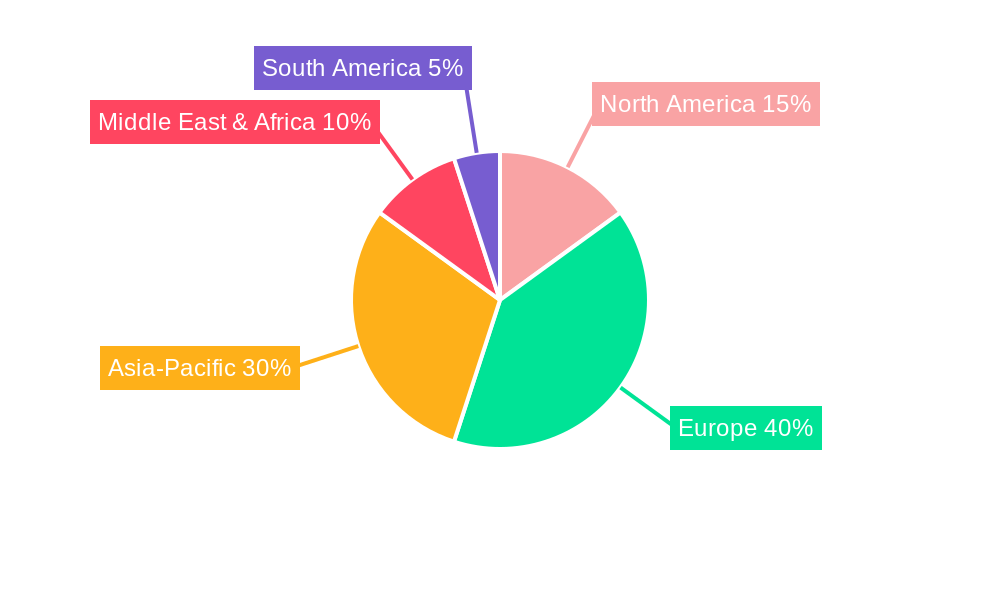
Europe Gas Industry Regional Market Share
Geographic Coverage of Europe Gas Industry
Europe Gas Industry REPORT HIGHLIGHTS
| Aspects | Details |
|---|---|
| Study Period | 2020-2034 |
| Base Year | 2025 |
| Estimated Year | 2026 |
| Forecast Period | 2026-2034 |
| Historical Period | 2020-2025 |
| Growth Rate | CAGR of 4.5% from 2020-2034 |
| Segmentation |
|
Table of Contents
- 1. Introduction
- 1.1. Research Scope
- 1.2. Market Segmentation
- 1.3. Research Objective
- 1.4. Definitions and Assumptions
- 2. Executive Summary
- 2.1. Market Snapshot
- 3. Market Dynamics
- 3.1. Market Drivers
- 3.2. Market Restrains
- 3.3. Market Trends
- 3.4. Market Opportunities
- 4. Market Factor Analysis
- 4.1. Porters Five Forces
- 4.1.1. Bargaining Power of Suppliers
- 4.1.2. Bargaining Power of Buyers
- 4.1.3. Threat of New Entrants
- 4.1.4. Threat of Substitutes
- 4.1.5. Competitive Rivalry
- 4.2. PESTEL analysis
- 4.3. BCG Analysis
- 4.3.1. Stars (High Growth, High Market Share)
- 4.3.2. Cash Cows (Low Growth, High Market Share)
- 4.3.3. Question Mark (High Growth, Low Market Share)
- 4.3.4. Dogs (Low Growth, Low Market Share)
- 4.4. Ansoff Matrix Analysis
- 4.5. Supply Chain Analysis
- 4.6. Regulatory Landscape
- 4.7. Current Market Potential and Opportunity Assessment (TAM–SAM–SOM Framework)
- 4.8. PRI Analyst Note
- 4.1. Porters Five Forces
- 5. Market Analysis, Insights and Forecast 2021-2033
- 5.1. Market Analysis, Insights and Forecast - by Application
- 5.1.1. Utilities
- 5.1.2. Industrial
- 5.1.3. Commercial
- 5.2. Market Analysis, Insights and Forecast - by Region
- 5.2.1. Germany
- 5.2.2. United Kingdom
- 5.2.3. France
- 5.2.4. Italy
- 5.2.5. Spain
- 5.2.6. Rest of Europe
- 5.1. Market Analysis, Insights and Forecast - by Application
- 6. Global Europe Gas Industry Analysis, Insights and Forecast, 2021-2033
- 6.1. Market Analysis, Insights and Forecast - by Application
- 6.1.1. Utilities
- 6.1.2. Industrial
- 6.1.3. Commercial
- 6.1. Market Analysis, Insights and Forecast - by Application
- 7. Germany Europe Gas Industry Analysis, Insights and Forecast, 2020-2032
- 7.1. Market Analysis, Insights and Forecast - by Application
- 7.1.1. Utilities
- 7.1.2. Industrial
- 7.1.3. Commercial
- 7.1. Market Analysis, Insights and Forecast - by Application
- 8. United Kingdom Europe Gas Industry Analysis, Insights and Forecast, 2020-2032
- 8.1. Market Analysis, Insights and Forecast - by Application
- 8.1.1. Utilities
- 8.1.2. Industrial
- 8.1.3. Commercial
- 8.1. Market Analysis, Insights and Forecast - by Application
- 9. France Europe Gas Industry Analysis, Insights and Forecast, 2020-2032
- 9.1. Market Analysis, Insights and Forecast - by Application
- 9.1.1. Utilities
- 9.1.2. Industrial
- 9.1.3. Commercial
- 9.1. Market Analysis, Insights and Forecast - by Application
- 10. Italy Europe Gas Industry Analysis, Insights and Forecast, 2020-2032
- 10.1. Market Analysis, Insights and Forecast - by Application
- 10.1.1. Utilities
- 10.1.2. Industrial
- 10.1.3. Commercial
- 10.1. Market Analysis, Insights and Forecast - by Application
- 11. Spain Europe Gas Industry Analysis, Insights and Forecast, 2020-2032
- 11.1. Market Analysis, Insights and Forecast - by Application
- 11.1.1. Utilities
- 11.1.2. Industrial
- 11.1.3. Commercial
- 11.1. Market Analysis, Insights and Forecast - by Application
- 12. Rest of Europe Europe Gas Industry Analysis, Insights and Forecast, 2020-2032
- 12.1. Market Analysis, Insights and Forecast - by Application
- 12.1.1. Utilities
- 12.1.2. Industrial
- 12.1.3. Commercial
- 12.1. Market Analysis, Insights and Forecast - by Application
- 13. Competitive Analysis
- 13.1. Company Profiles
- 13.1.1 Chevron Corporation
- 13.1.1.1. Company Overview
- 13.1.1.2. Products
- 13.1.1.3. Company Financials
- 13.1.1.4. SWOT Analysis
- 13.1.2 BP PLC
- 13.1.2.1. Company Overview
- 13.1.2.2. Products
- 13.1.2.3. Company Financials
- 13.1.2.4. SWOT Analysis
- 13.1.3 TotalEnergies SE
- 13.1.3.1. Company Overview
- 13.1.3.2. Products
- 13.1.3.3. Company Financials
- 13.1.3.4. SWOT Analysis
- 13.1.4 Exxon Mobil Corporation
- 13.1.4.1. Company Overview
- 13.1.4.2. Products
- 13.1.4.3. Company Financials
- 13.1.4.4. SWOT Analysis
- 13.1.5 Equinor ASA
- 13.1.5.1. Company Overview
- 13.1.5.2. Products
- 13.1.5.3. Company Financials
- 13.1.5.4. SWOT Analysis
- 13.1.6 NK Lukoil PAO
- 13.1.6.1. Company Overview
- 13.1.6.2. Products
- 13.1.6.3. Company Financials
- 13.1.6.4. SWOT Analysis
- 13.1.7 Gazprom PJSC ADR
- 13.1.7.1. Company Overview
- 13.1.7.2. Products
- 13.1.7.3. Company Financials
- 13.1.7.4. SWOT Analysis
- 13.1.8 Rosneft Oil Co PJSC*List Not Exhaustive
- 13.1.8.1. Company Overview
- 13.1.8.2. Products
- 13.1.8.3. Company Financials
- 13.1.8.4. SWOT Analysis
- 13.1.1 Chevron Corporation
- 13.2. Market Entropy
- 13.2.1 Company's Key Areas Served
- 13.2.2 Recent Developments
- 13.3. Company Market Share Analysis 2025
- 13.3.1 Top 5 Companies Market Share Analysis
- 13.3.2 Top 3 Companies Market Share Analysis
- 13.4. List of Potential Customers
- 14. Research Methodology
List of Figures
- Figure 1: Global Europe Gas Industry Revenue Breakdown (million, %) by Region 2025 & 2033
- Figure 2: Germany Europe Gas Industry Revenue (million), by Application 2025 & 2033
- Figure 3: Germany Europe Gas Industry Revenue Share (%), by Application 2025 & 2033
- Figure 4: Germany Europe Gas Industry Revenue (million), by Country 2025 & 2033
- Figure 5: Germany Europe Gas Industry Revenue Share (%), by Country 2025 & 2033
- Figure 6: United Kingdom Europe Gas Industry Revenue (million), by Application 2025 & 2033
- Figure 7: United Kingdom Europe Gas Industry Revenue Share (%), by Application 2025 & 2033
- Figure 8: United Kingdom Europe Gas Industry Revenue (million), by Country 2025 & 2033
- Figure 9: United Kingdom Europe Gas Industry Revenue Share (%), by Country 2025 & 2033
- Figure 10: France Europe Gas Industry Revenue (million), by Application 2025 & 2033
- Figure 11: France Europe Gas Industry Revenue Share (%), by Application 2025 & 2033
- Figure 12: France Europe Gas Industry Revenue (million), by Country 2025 & 2033
- Figure 13: France Europe Gas Industry Revenue Share (%), by Country 2025 & 2033
- Figure 14: Italy Europe Gas Industry Revenue (million), by Application 2025 & 2033
- Figure 15: Italy Europe Gas Industry Revenue Share (%), by Application 2025 & 2033
- Figure 16: Italy Europe Gas Industry Revenue (million), by Country 2025 & 2033
- Figure 17: Italy Europe Gas Industry Revenue Share (%), by Country 2025 & 2033
- Figure 18: Spain Europe Gas Industry Revenue (million), by Application 2025 & 2033
- Figure 19: Spain Europe Gas Industry Revenue Share (%), by Application 2025 & 2033
- Figure 20: Spain Europe Gas Industry Revenue (million), by Country 2025 & 2033
- Figure 21: Spain Europe Gas Industry Revenue Share (%), by Country 2025 & 2033
- Figure 22: Rest of Europe Europe Gas Industry Revenue (million), by Application 2025 & 2033
- Figure 23: Rest of Europe Europe Gas Industry Revenue Share (%), by Application 2025 & 2033
- Figure 24: Rest of Europe Europe Gas Industry Revenue (million), by Country 2025 & 2033
- Figure 25: Rest of Europe Europe Gas Industry Revenue Share (%), by Country 2025 & 2033
List of Tables
- Table 1: Global Europe Gas Industry Revenue million Forecast, by Application 2020 & 2033
- Table 2: Global Europe Gas Industry Revenue million Forecast, by Region 2020 & 2033
- Table 3: Global Europe Gas Industry Revenue million Forecast, by Application 2020 & 2033
- Table 4: Global Europe Gas Industry Revenue million Forecast, by Country 2020 & 2033
- Table 5: Global Europe Gas Industry Revenue million Forecast, by Application 2020 & 2033
- Table 6: Global Europe Gas Industry Revenue million Forecast, by Country 2020 & 2033
- Table 7: Global Europe Gas Industry Revenue million Forecast, by Application 2020 & 2033
- Table 8: Global Europe Gas Industry Revenue million Forecast, by Country 2020 & 2033
- Table 9: Global Europe Gas Industry Revenue million Forecast, by Application 2020 & 2033
- Table 10: Global Europe Gas Industry Revenue million Forecast, by Country 2020 & 2033
- Table 11: Global Europe Gas Industry Revenue million Forecast, by Application 2020 & 2033
- Table 12: Global Europe Gas Industry Revenue million Forecast, by Country 2020 & 2033
- Table 13: Global Europe Gas Industry Revenue million Forecast, by Application 2020 & 2033
- Table 14: Global Europe Gas Industry Revenue million Forecast, by Country 2020 & 2033
Frequently Asked Questions
1. What is the projected Compound Annual Growth Rate (CAGR) of the Europe Gas Industry?
The projected CAGR is approximately 4.5%.
2. Which companies are prominent players in the Europe Gas Industry?
Key companies in the market include Chevron Corporation, BP PLC, TotalEnergies SE, Exxon Mobil Corporation, Equinor ASA, NK Lukoil PAO, Gazprom PJSC ADR, Rosneft Oil Co PJSC*List Not Exhaustive.
3. What are the main segments of the Europe Gas Industry?
The market segments include Application.
4. Can you provide details about the market size?
The market size is estimated to be USD 1223.8 million as of 2022.
5. What are some drivers contributing to market growth?
N/A
6. What are the notable trends driving market growth?
Utility Sector (i.e.. Power Generation) Sector Expected to Dominate the Market.
7. Are there any restraints impacting market growth?
N/A
8. Can you provide examples of recent developments in the market?
September 2022: Russia's Gazprom announced shipping 42.4 million cubic meters (mcm) of natural gas to Europe via Ukraine. The shift was part of a push by Russia to reduce its reliance on the US dollar.
9. What pricing options are available for accessing the report?
Pricing options include single-user, multi-user, and enterprise licenses priced at USD 4750, USD 5250, and USD 8750 respectively.
10. Is the market size provided in terms of value or volume?
The market size is provided in terms of value, measured in million.
11. Are there any specific market keywords associated with the report?
Yes, the market keyword associated with the report is "Europe Gas Industry," which aids in identifying and referencing the specific market segment covered.
12. How do I determine which pricing option suits my needs best?
The pricing options vary based on user requirements and access needs. Individual users may opt for single-user licenses, while businesses requiring broader access may choose multi-user or enterprise licenses for cost-effective access to the report.
13. Are there any additional resources or data provided in the Europe Gas Industry report?
While the report offers comprehensive insights, it's advisable to review the specific contents or supplementary materials provided to ascertain if additional resources or data are available.
14. How can I stay updated on further developments or reports in the Europe Gas Industry?
To stay informed about further developments, trends, and reports in the Europe Gas Industry, consider subscribing to industry newsletters, following relevant companies and organizations, or regularly checking reputable industry news sources and publications.
Methodology
Step 1 - Identification of Relevant Samples Size from Population Database


Step 2 - Approaches for Defining Global Market Size (Value, Volume* & Price*)

Note*: In applicable scenarios
Step 3 - Data Sources
Primary Research
- Web Analytics
- Survey Reports
- Research Institute
- Latest Research Reports
- Opinion Leaders
Secondary Research
- Annual Reports
- White Paper
- Latest Press Release
- Industry Association
- Paid Database
- Investor Presentations

Step 4 - Data Triangulation
Involves using different sources of information in order to increase the validity of a study
These sources are likely to be stakeholders in a program - participants, other researchers, program staff, other community members, and so on.
Then we put all data in single framework & apply various statistical tools to find out the dynamic on the market.
During the analysis stage, feedback from the stakeholder groups would be compared to determine areas of agreement as well as areas of divergence