

Key Insights
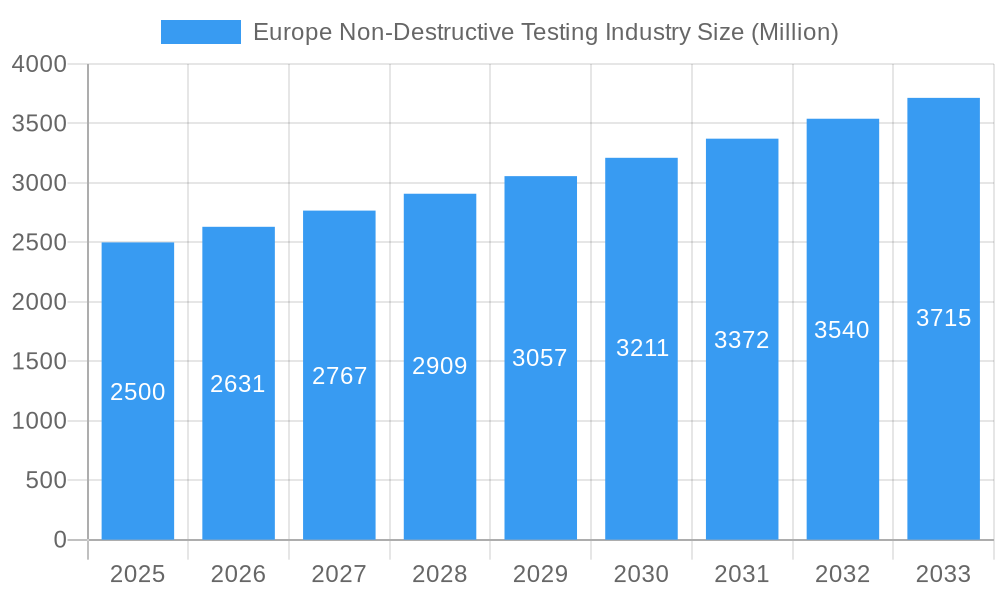
The European Non-Destructive Testing (NDT) market is forecast to reach 5564.55 million by 2033, expanding at a compound annual growth rate (CAGR) of 6.5% from a base year of 2024. This growth is propelled by escalating demand for superior safety and quality assurance across key industries such as aerospace & defense, automotive, and energy. Stringent regulatory mandates for regular inspections further accelerate market adoption. Innovations in advanced imaging techniques (e.g., radiography, ultrasonic testing) and automated inspection systems enhance efficiency and accuracy, driving wider implementation. The increasing complexity of manufacturing and the emphasis on predictive maintenance also contribute to market expansion. Germany, the UK, and France lead the European market due to their strong industrial foundations and regulatory frameworks.
Europe Non-Destructive Testing Industry Market Size (In Billion)
Market challenges include the significant upfront investment for advanced NDT equipment and skilled labor, which can impede smaller enterprises. The inherent cyclicality of certain sectors, like construction, may affect demand. Intense competition and emerging technological disrupters are also key market dynamics. Despite these factors, the European NDT market presents a positive long-term outlook, fueled by ongoing industrialization, infrastructure development, and a growing focus on asset integrity management. Segmentation by NDT type (equipment and services) and testing technology (radiography, ultrasonic, etc.) reveals specific growth opportunities. Continuous innovation and adoption of advanced NDT solutions will be vital for sustained market growth.
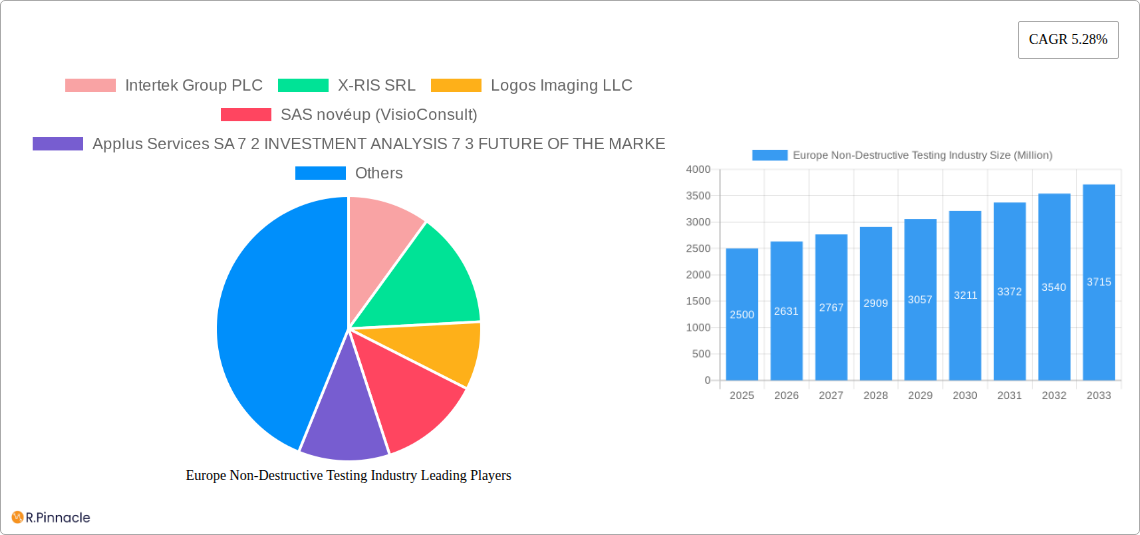
Europe Non-Destructive Testing Industry Company Market Share
Europe Non-Destructive Testing (NDT) Industry Market Report: 2019-2033
This comprehensive report provides an in-depth analysis of the European Non-Destructive Testing (NDT) industry, offering invaluable insights for industry professionals, investors, and strategic decision-makers. Covering the period from 2019 to 2033, with a focus on 2025, this report leverages rigorous data analysis and expert insights to illuminate market dynamics, growth drivers, and future opportunities. The market size is projected to reach XX Million by 2033.
Europe Non-Destructive Testing Industry Market Structure & Innovation Trends
The European NDT market is characterized by a moderately concentrated landscape with several multinational corporations and specialized firms competing. Key players such as Intertek Group PLC, Bureau Veritas SA, and Olympus Corporation hold significant market share, estimated at approximately XX Million collectively in 2025. However, smaller, specialized companies like X-RIS SRL and Logos Imaging LLC are also making significant contributions, particularly in niche areas. Innovation is primarily driven by the need for enhanced inspection accuracy, faster testing speeds, and the adoption of advanced technologies like AI and machine learning. Regulatory frameworks, particularly within the aerospace and defense sectors, significantly influence the adoption of specific NDT technologies and equipment. The market also witnesses substantial M&A activity, with deal values exceeding XX Million in recent years, reflecting the consolidation trend and the desire to expand technological capabilities. Product substitutes, such as advanced material analysis techniques, represent potential challenges to traditional NDT methods. The end-user demographics are diverse, spanning various industries, with a significant focus on sectors requiring stringent quality control and safety measures.
- Market Concentration: Moderately concentrated, with key players holding XX% market share.
- Innovation Drivers: Enhanced accuracy, speed, AI/ML integration.
- Regulatory Frameworks: Stringent standards in aerospace, defense, etc. impacting technology adoption.
- M&A Activity: Deal values exceeding XX Million in recent years.
Europe Non-Destructive Testing Industry Market Dynamics & Trends
The European NDT market is experiencing robust growth, driven by increasing demand across diverse end-user industries. The projected Compound Annual Growth Rate (CAGR) for the period 2025-2033 is estimated at XX%, fueled by factors such as rising infrastructure development, stringent safety regulations, and the growing adoption of advanced NDT technologies. Technological disruptions, particularly the integration of AI and automation, are improving testing efficiency and accuracy. Consumer preferences are shifting towards non-destructive solutions that minimize material damage and downtime. Competitive dynamics are characterized by intense competition among established players and the emergence of innovative start-ups. Market penetration of advanced NDT technologies like phased array ultrasonic testing is gradually increasing, reaching an estimated XX% in 2025.
Dominant Regions & Segments in Europe Non-Destructive Testing Industry
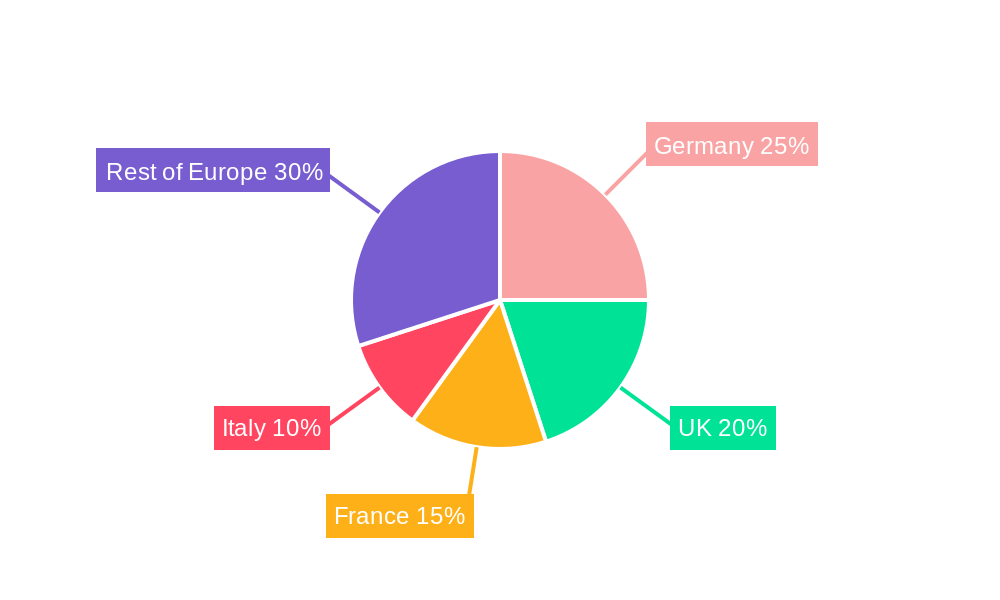
Germany and the United Kingdom are the leading markets in Europe, contributing approximately XX Million and XX Million respectively to the overall market value in 2025. This dominance is fueled by strong industrial bases, robust infrastructure investment, and a relatively mature regulatory environment.
Key Drivers:
- Germany: Strong automotive and manufacturing industries, robust R&D investments.
- United Kingdom: Significant investments in infrastructure projects, stringent safety regulations.
- France: Growing aerospace and energy sectors.
- Italy: Active construction and manufacturing sectors.
By Type: The Services segment currently dominates the market, accounting for approximately XX% of the total market value in 2025, primarily due to the high demand for specialized expertise and customized solutions.
By Testing Technology: Ultrasonic testing holds the largest market share, followed by radiography. This reflects the versatility and wide applicability of these technologies across various industries.
By End-user Industry: The Aerospace and Defense, and Oil & Gas sectors are major contributors, driven by the critical need for rigorous quality assurance and safety protocols.
Europe Non-Destructive Testing Industry Product Innovations
Recent innovations include the development of portable and more user-friendly NDT equipment, along with software advancements for automated data analysis and interpretation. These innovations enhance efficiency, reduce human error, and allow for real-time analysis. The integration of AI and machine learning algorithms promises further improvements in accuracy and speed. The market fit for these innovations is strong, given the industry’s ongoing need for enhanced testing capabilities and reduced operational costs.
Report Scope & Segmentation Analysis
This report segments the European NDT market by type (Equipment, Services), testing technology (Radiography, Ultrasonic, Magnetic Particle, Liquid Penetrant, Visual Inspection, Other Technologies), and end-user industry (Oil and Gas, Aerospace and Defense, Automotive and Transportation, Power and Energy, Construction, Other End-user Industries). Each segment's growth projections, market sizes, and competitive dynamics are comprehensively analyzed, offering a granular view of the market's composition and future trajectory. Country-level analysis is provided for the United Kingdom, Germany, France, Italy, Russia, and the Rest of Europe. Market sizes for each segment are estimated at several Million Euro, with significant variations depending on the specific segment and country.
Key Drivers of Europe Non-Destructive Testing Industry Growth
The European NDT industry's growth is primarily driven by several key factors: increasing demand for quality control and safety in critical infrastructure projects, stringent regulatory compliance requirements in various sectors (especially aerospace and energy), technological advancements improving testing accuracy and efficiency, and rising awareness of the importance of preventative maintenance to reduce operational costs.
Challenges in the Europe Non-Destructive Testing Industry Sector
The European NDT industry faces challenges such as the high cost of advanced equipment, the need for skilled personnel, and intense competition from both established players and emerging start-ups. Supply chain disruptions and the complexity of regulatory compliance further impact market dynamics. These factors collectively constrain market growth to some extent.
Emerging Opportunities in Europe Non-Destructive Testing Industry
Emerging opportunities are driven by advancements in AI and machine learning-based NDT solutions, the growth of the renewable energy sector necessitating advanced NDT for wind turbine inspection and maintenance, and increasing demand for NDT in emerging industries such as 3D printing and additive manufacturing. These trends offer significant potential for expansion and innovation.
Leading Players in the Europe Non-Destructive Testing Industry Market
- Intertek Group PLC
- X-RIS SRL
- Logos Imaging LLC
- SAS novéup (VisioConsult)
- Applus Services SA
- Teledyne ICM
- Novo DR Ltd
- Zetec Inc
- 3DX-RAY Ltd (Image Scan Holdings Plc)
- YXLON International GmbH (COMET Group)
- Bureau Veritas SA
- Olympus Corporation
- Magnaflux Corp
- Scanna MSC
- GE Measurement and Control
Key Developments in Europe Non-Destructive Testing Industry Industry
- 2023-Q3: Olympus Corporation launched a new series of phased array ultrasonic testing equipment.
- 2022-Q4: Intertek Group PLC acquired a specialized NDT services provider in Germany.
- 2021-Q2: Bureau Veritas SA invested in the development of AI-powered NDT software. (Further developments will be detailed in the full report)
Future Outlook for Europe Non-Destructive Testing Industry Market
The future of the European NDT market is bright, driven by consistent growth in major end-user sectors, the continued adoption of advanced technologies, and a growing focus on preventative maintenance. Strategic partnerships and investments in R&D will play a crucial role in shaping the market’s future trajectory. The market is poised for further consolidation and expansion, with significant growth potential in emerging technologies and applications.
Europe Non-Destructive Testing Industry Segmentation
-
1. Type
- 1.1. Equipment
- 1.2. Services
-
2. Testing Technology
- 2.1. Radiography
- 2.2. Ultrasonic
- 2.3. Magnetic Particle
- 2.4. Liquid Penetrant
- 2.5. Visual Inspection
- 2.6. Other Technologies
-
3. End-user Industry
- 3.1. Oil and Gas
- 3.2. Aerospace and Defense
- 3.3. Automotive and Transportation
- 3.4. Power and Energy
- 3.5. Construction
- 3.6. Other End-user Industries (Manufacturing, etc.)
Europe Non-Destructive Testing Industry Segmentation By Geography
-
1. Europe
- 1.1. United Kingdom
- 1.2. Germany
- 1.3. France
- 1.4. Italy
- 1.5. Spain
- 1.6. Netherlands
- 1.7. Belgium
- 1.8. Sweden
- 1.9. Norway
- 1.10. Poland
- 1.11. Denmark
Europe Non-Destructive Testing Industry Regional Market Share
Geographic Coverage of Europe Non-Destructive Testing Industry
Europe Non-Destructive Testing Industry REPORT HIGHLIGHTS
| Aspects | Details |
|---|---|
| Study Period | 2020-2034 |
| Base Year | 2025 |
| Estimated Year | 2026 |
| Forecast Period | 2026-2034 |
| Historical Period | 2020-2025 |
| Growth Rate | CAGR of 6.5% from 2020-2034 |
| Segmentation |
|
Table of Contents
- 1. Introduction
- 1.1. Research Scope
- 1.2. Market Segmentation
- 1.3. Research Objective
- 1.4. Definitions and Assumptions
- 2. Executive Summary
- 2.1. Market Snapshot
- 3. Market Dynamics
- 3.1. Market Drivers
- 3.2. Market Restrains
- 3.3. Market Trends
- 3.4. Market Opportunities
- 4. Market Factor Analysis
- 4.1. Porters Five Forces
- 4.1.1. Bargaining Power of Suppliers
- 4.1.2. Bargaining Power of Buyers
- 4.1.3. Threat of New Entrants
- 4.1.4. Threat of Substitutes
- 4.1.5. Competitive Rivalry
- 4.2. PESTEL analysis
- 4.3. BCG Analysis
- 4.3.1. Stars (High Growth, High Market Share)
- 4.3.2. Cash Cows (Low Growth, High Market Share)
- 4.3.3. Question Mark (High Growth, Low Market Share)
- 4.3.4. Dogs (Low Growth, Low Market Share)
- 4.4. Ansoff Matrix Analysis
- 4.5. Supply Chain Analysis
- 4.6. Regulatory Landscape
- 4.7. Current Market Potential and Opportunity Assessment (TAM–SAM–SOM Framework)
- 4.8. PRI Analyst Note
- 4.1. Porters Five Forces
- 5. Market Analysis, Insights and Forecast 2021-2033
- 5.1. Market Analysis, Insights and Forecast - by Type
- 5.1.1. Equipment
- 5.1.2. Services
- 5.2. Market Analysis, Insights and Forecast - by Testing Technology
- 5.2.1. Radiography
- 5.2.2. Ultrasonic
- 5.2.3. Magnetic Particle
- 5.2.4. Liquid Penetrant
- 5.2.5. Visual Inspection
- 5.2.6. Other Technologies
- 5.3. Market Analysis, Insights and Forecast - by End-user Industry
- 5.3.1. Oil and Gas
- 5.3.2. Aerospace and Defense
- 5.3.3. Automotive and Transportation
- 5.3.4. Power and Energy
- 5.3.5. Construction
- 5.3.6. Other End-user Industries (Manufacturing, etc.)
- 5.4. Market Analysis, Insights and Forecast - by Region
- 5.4.1. Europe
- 5.1. Market Analysis, Insights and Forecast - by Type
- 6. Europe Non-Destructive Testing Industry Analysis, Insights and Forecast, 2021-2033
- 6.1. Market Analysis, Insights and Forecast - by Type
- 6.1.1. Equipment
- 6.1.2. Services
- 6.2. Market Analysis, Insights and Forecast - by Testing Technology
- 6.2.1. Radiography
- 6.2.2. Ultrasonic
- 6.2.3. Magnetic Particle
- 6.2.4. Liquid Penetrant
- 6.2.5. Visual Inspection
- 6.2.6. Other Technologies
- 6.3. Market Analysis, Insights and Forecast - by End-user Industry
- 6.3.1. Oil and Gas
- 6.3.2. Aerospace and Defense
- 6.3.3. Automotive and Transportation
- 6.3.4. Power and Energy
- 6.3.5. Construction
- 6.3.6. Other End-user Industries (Manufacturing, etc.)
- 6.1. Market Analysis, Insights and Forecast - by Type
- 7. Competitive Analysis
- 7.1. Company Profiles
- 7.1.1 Intertek Group PLC
- 7.1.1.1. Company Overview
- 7.1.1.2. Products
- 7.1.1.3. Company Financials
- 7.1.1.4. SWOT Analysis
- 7.1.2 X-RIS SRL
- 7.1.2.1. Company Overview
- 7.1.2.2. Products
- 7.1.2.3. Company Financials
- 7.1.2.4. SWOT Analysis
- 7.1.3 Logos Imaging LLC
- 7.1.3.1. Company Overview
- 7.1.3.2. Products
- 7.1.3.3. Company Financials
- 7.1.3.4. SWOT Analysis
- 7.1.4 SAS novéup (VisioConsult)
- 7.1.4.1. Company Overview
- 7.1.4.2. Products
- 7.1.4.3. Company Financials
- 7.1.4.4. SWOT Analysis
- 7.1.5 Applus Services SA 7 2 INVESTMENT ANALYSIS 7 3 FUTURE OF THE MARKE
- 7.1.5.1. Company Overview
- 7.1.5.2. Products
- 7.1.5.3. Company Financials
- 7.1.5.4. SWOT Analysis
- 7.1.6 Teledyne ICM
- 7.1.6.1. Company Overview
- 7.1.6.2. Products
- 7.1.6.3. Company Financials
- 7.1.6.4. SWOT Analysis
- 7.1.7 Novo DR Ltd
- 7.1.7.1. Company Overview
- 7.1.7.2. Products
- 7.1.7.3. Company Financials
- 7.1.7.4. SWOT Analysis
- 7.1.8 Zetec Inc
- 7.1.8.1. Company Overview
- 7.1.8.2. Products
- 7.1.8.3. Company Financials
- 7.1.8.4. SWOT Analysis
- 7.1.9 3DX-RAY Ltd (Image Scan Holdings Plc)
- 7.1.9.1. Company Overview
- 7.1.9.2. Products
- 7.1.9.3. Company Financials
- 7.1.9.4. SWOT Analysis
- 7.1.10 YXLON International GmbH ( COMET Group)
- 7.1.10.1. Company Overview
- 7.1.10.2. Products
- 7.1.10.3. Company Financials
- 7.1.10.4. SWOT Analysis
- 7.1.11 Bureau Veritas SA
- 7.1.11.1. Company Overview
- 7.1.11.2. Products
- 7.1.11.3. Company Financials
- 7.1.11.4. SWOT Analysis
- 7.1.12 Olympus Corporation
- 7.1.12.1. Company Overview
- 7.1.12.2. Products
- 7.1.12.3. Company Financials
- 7.1.12.4. SWOT Analysis
- 7.1.13 Magnaflux Corp
- 7.1.13.1. Company Overview
- 7.1.13.2. Products
- 7.1.13.3. Company Financials
- 7.1.13.4. SWOT Analysis
- 7.1.14 Scanna MSC
- 7.1.14.1. Company Overview
- 7.1.14.2. Products
- 7.1.14.3. Company Financials
- 7.1.14.4. SWOT Analysis
- 7.1.15 GE Measurement and Control
- 7.1.15.1. Company Overview
- 7.1.15.2. Products
- 7.1.15.3. Company Financials
- 7.1.15.4. SWOT Analysis
- 7.1.1 Intertek Group PLC
- 7.2. Market Entropy
- 7.2.1 Company's Key Areas Served
- 7.2.2 Recent Developments
- 7.3. Company Market Share Analysis 2025
- 7.3.1 Top 5 Companies Market Share Analysis
- 7.3.2 Top 3 Companies Market Share Analysis
- 7.4. List of Potential Customers
- 8. Research Methodology
List of Figures
- Figure 1: Europe Non-Destructive Testing Industry Revenue Breakdown (million, %) by Product 2025 & 2033
- Figure 2: Europe Non-Destructive Testing Industry Share (%) by Company 2025
List of Tables
- Table 1: Europe Non-Destructive Testing Industry Revenue million Forecast, by Type 2020 & 2033
- Table 2: Europe Non-Destructive Testing Industry Revenue million Forecast, by Testing Technology 2020 & 2033
- Table 3: Europe Non-Destructive Testing Industry Revenue million Forecast, by End-user Industry 2020 & 2033
- Table 4: Europe Non-Destructive Testing Industry Revenue million Forecast, by Region 2020 & 2033
- Table 5: Europe Non-Destructive Testing Industry Revenue million Forecast, by Type 2020 & 2033
- Table 6: Europe Non-Destructive Testing Industry Revenue million Forecast, by Testing Technology 2020 & 2033
- Table 7: Europe Non-Destructive Testing Industry Revenue million Forecast, by End-user Industry 2020 & 2033
- Table 8: Europe Non-Destructive Testing Industry Revenue million Forecast, by Country 2020 & 2033
- Table 9: United Kingdom Europe Non-Destructive Testing Industry Revenue (million) Forecast, by Application 2020 & 2033
- Table 10: Germany Europe Non-Destructive Testing Industry Revenue (million) Forecast, by Application 2020 & 2033
- Table 11: France Europe Non-Destructive Testing Industry Revenue (million) Forecast, by Application 2020 & 2033
- Table 12: Italy Europe Non-Destructive Testing Industry Revenue (million) Forecast, by Application 2020 & 2033
- Table 13: Spain Europe Non-Destructive Testing Industry Revenue (million) Forecast, by Application 2020 & 2033
- Table 14: Netherlands Europe Non-Destructive Testing Industry Revenue (million) Forecast, by Application 2020 & 2033
- Table 15: Belgium Europe Non-Destructive Testing Industry Revenue (million) Forecast, by Application 2020 & 2033
- Table 16: Sweden Europe Non-Destructive Testing Industry Revenue (million) Forecast, by Application 2020 & 2033
- Table 17: Norway Europe Non-Destructive Testing Industry Revenue (million) Forecast, by Application 2020 & 2033
- Table 18: Poland Europe Non-Destructive Testing Industry Revenue (million) Forecast, by Application 2020 & 2033
- Table 19: Denmark Europe Non-Destructive Testing Industry Revenue (million) Forecast, by Application 2020 & 2033
Frequently Asked Questions
1. What is the projected Compound Annual Growth Rate (CAGR) of the Europe Non-Destructive Testing Industry?
The projected CAGR is approximately 6.5%.
2. Which companies are prominent players in the Europe Non-Destructive Testing Industry?
Key companies in the market include Intertek Group PLC, X-RIS SRL, Logos Imaging LLC, SAS novéup (VisioConsult), Applus Services SA 7 2 INVESTMENT ANALYSIS 7 3 FUTURE OF THE MARKE, Teledyne ICM, Novo DR Ltd, Zetec Inc, 3DX-RAY Ltd (Image Scan Holdings Plc), YXLON International GmbH ( COMET Group), Bureau Veritas SA, Olympus Corporation, Magnaflux Corp, Scanna MSC, GE Measurement and Control.
3. What are the main segments of the Europe Non-Destructive Testing Industry?
The market segments include Type, Testing Technology, End-user Industry.
4. Can you provide details about the market size?
The market size is estimated to be USD 5564.55 million as of 2022.
5. What are some drivers contributing to market growth?
; Stringent Regulations Mandating Safety Standards; Increasing Investment in Aerospace and Defense.
6. What are the notable trends driving market growth?
Power and Energy Sector to Dominate the Market.
7. Are there any restraints impacting market growth?
; Lack of Skilled Personnel and Training Facilities.
8. Can you provide examples of recent developments in the market?
N/A
9. What pricing options are available for accessing the report?
Pricing options include single-user, multi-user, and enterprise licenses priced at USD 4750, USD 4950, and USD 6800 respectively.
10. Is the market size provided in terms of value or volume?
The market size is provided in terms of value, measured in million.
11. Are there any specific market keywords associated with the report?
Yes, the market keyword associated with the report is "Europe Non-Destructive Testing Industry," which aids in identifying and referencing the specific market segment covered.
12. How do I determine which pricing option suits my needs best?
The pricing options vary based on user requirements and access needs. Individual users may opt for single-user licenses, while businesses requiring broader access may choose multi-user or enterprise licenses for cost-effective access to the report.
13. Are there any additional resources or data provided in the Europe Non-Destructive Testing Industry report?
While the report offers comprehensive insights, it's advisable to review the specific contents or supplementary materials provided to ascertain if additional resources or data are available.
14. How can I stay updated on further developments or reports in the Europe Non-Destructive Testing Industry?
To stay informed about further developments, trends, and reports in the Europe Non-Destructive Testing Industry, consider subscribing to industry newsletters, following relevant companies and organizations, or regularly checking reputable industry news sources and publications.
Methodology
Step 1 - Identification of Relevant Samples Size from Population Database


Step 2 - Approaches for Defining Global Market Size (Value, Volume* & Price*)

Note*: In applicable scenarios
Step 3 - Data Sources
Primary Research
- Web Analytics
- Survey Reports
- Research Institute
- Latest Research Reports
- Opinion Leaders
Secondary Research
- Annual Reports
- White Paper
- Latest Press Release
- Industry Association
- Paid Database
- Investor Presentations

Step 4 - Data Triangulation
Involves using different sources of information in order to increase the validity of a study
These sources are likely to be stakeholders in a program - participants, other researchers, program staff, other community members, and so on.
Then we put all data in single framework & apply various statistical tools to find out the dynamic on the market.
During the analysis stage, feedback from the stakeholder groups would be compared to determine areas of agreement as well as areas of divergence