Key Insights
The global Faraday Rotator Crystals market is poised for significant expansion, projected to reach USD 344 million by 2025 and grow at a robust CAGR of 5.2% through 2033. This growth is primarily fueled by the escalating demand for advanced optical components across a spectrum of high-growth industries. Key drivers include the increasing adoption of optical isolators in telecommunications, data centers, and laser systems, where precise control of light polarization is paramount. The burgeoning field of quantum computing and the continuous innovation in scientific research instrumentation are also contributing to a sustained demand for high-performance Faraday rotator crystals. Furthermore, the growing use of these crystals in medical imaging technologies and defense applications, where signal integrity and reliability are critical, underscores their expanding market influence.
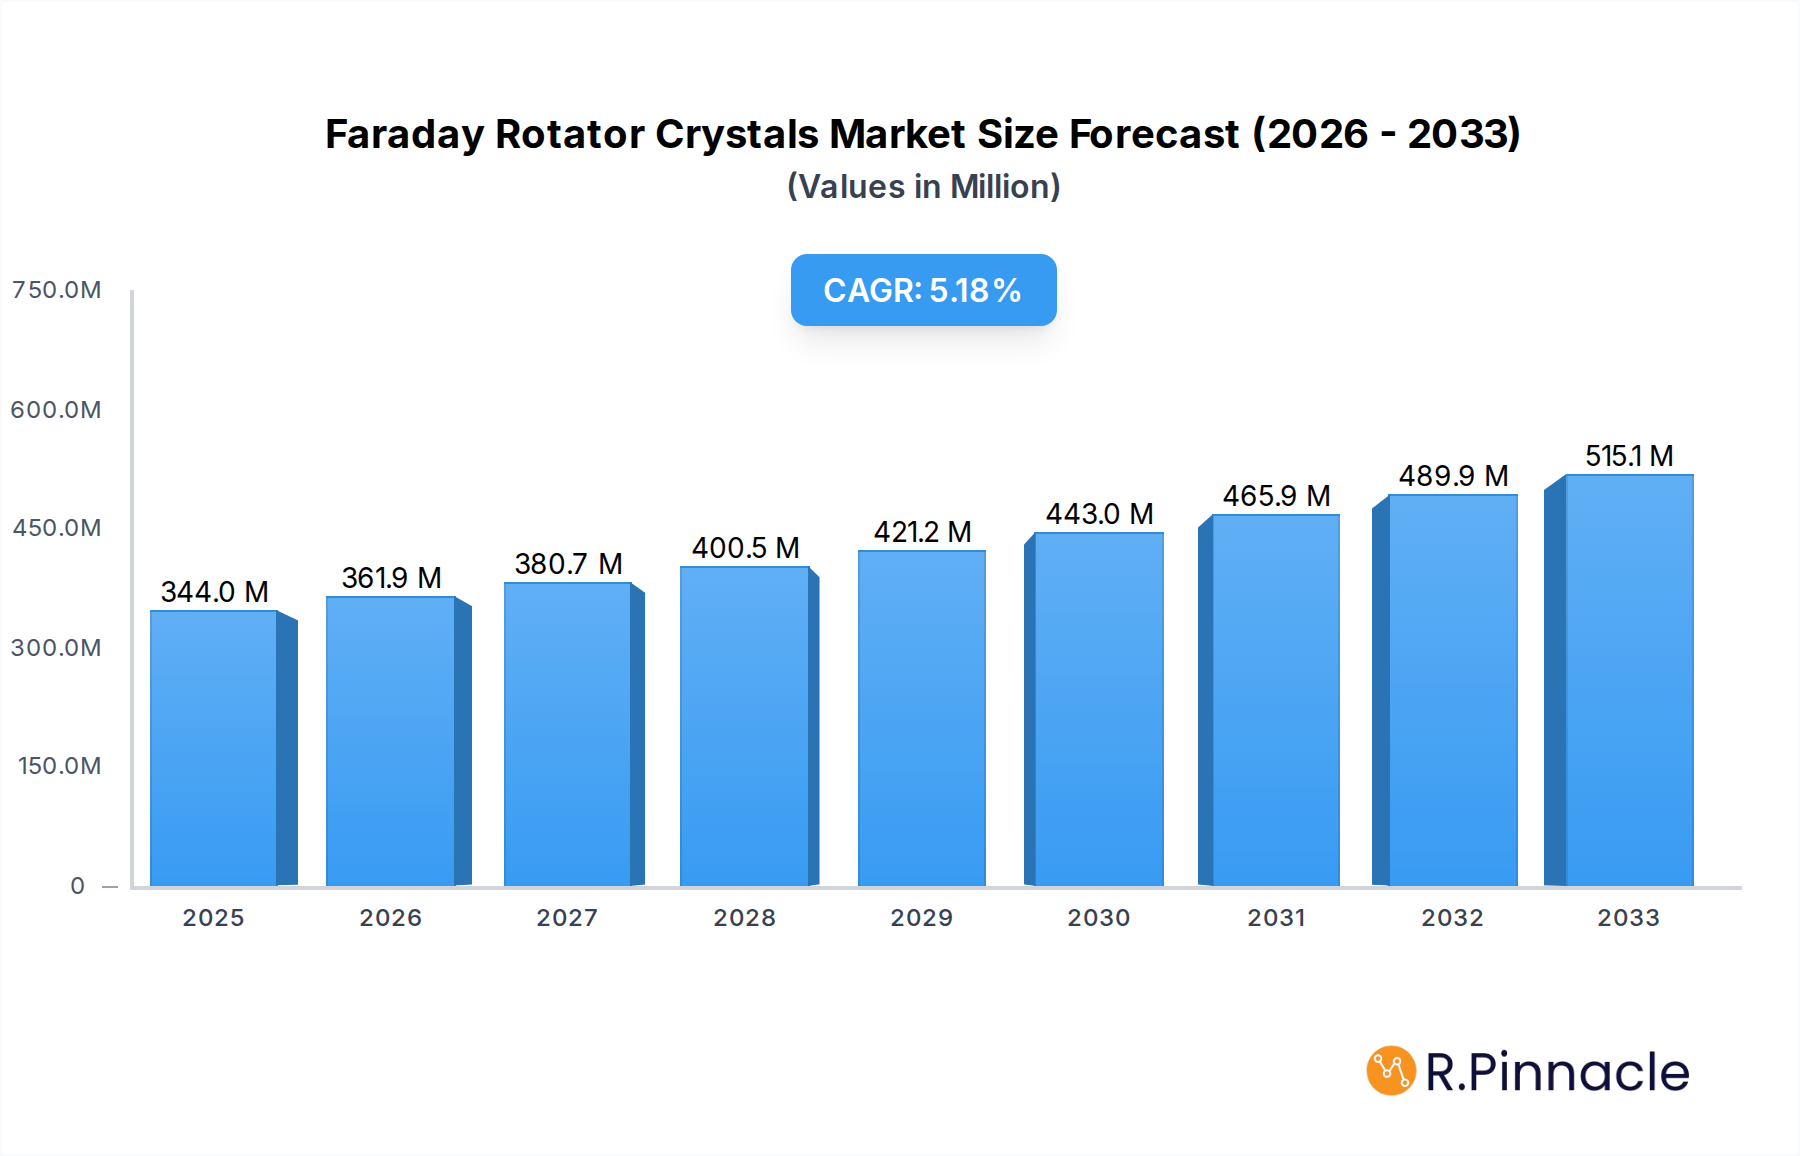
Faraday Rotator Crystals Market Size (In Million)
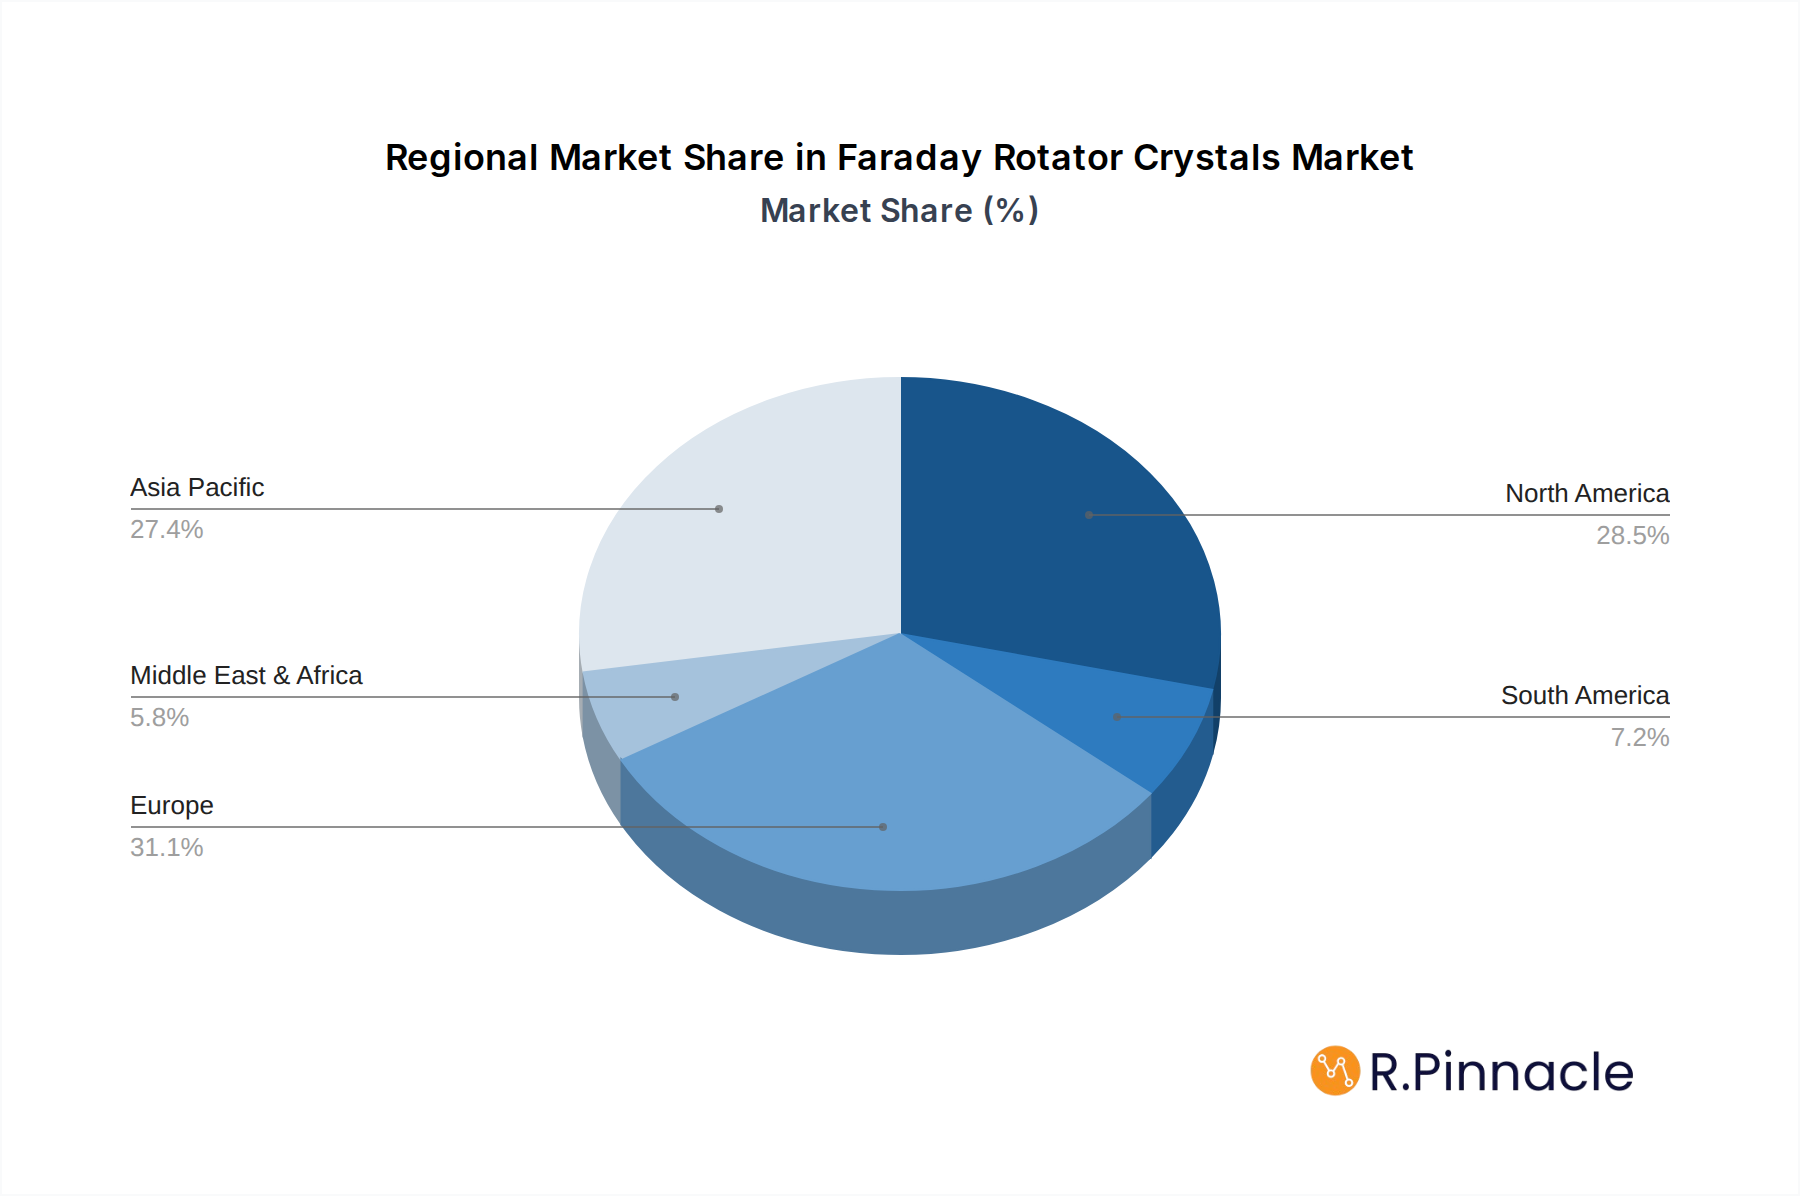
The market landscape is characterized by a dynamic interplay of technological advancements and evolving application needs. The primary applications segment, Faraday Rotators, is expected to dominate the market, closely followed by Optical Isolators, reflecting their widespread utility. The market is segmented by material types, with TGG crystals leading in adoption due to their superior magneto-optical properties, though TSAG and other emerging materials are gaining traction. Leading companies like OXIDE, Coherent, and Northrop Grumman are at the forefront of innovation, investing in research and development to enhance crystal performance and explore new applications. Geographically, Asia Pacific, driven by China and Japan, is emerging as a major hub for both production and consumption, while North America and Europe continue to represent substantial markets due to their established technological infrastructure and significant R&D investments.

Faraday Rotator Crystals Company Market Share
The Faraday rotator crystals market exhibits a moderate concentration, with key players such as OXIDE, Coherent, Northrop Grumman, Teledyne FLIR, CASTECH, Crylink, Crystro, HG Optronics, YOFC, and DIEN TECH holding significant market share. Innovation is primarily driven by advancements in crystal growth techniques and material science, leading to enhanced Verdet constants, improved transmission, and reduced optical losses. Regulatory frameworks, while not overly burdensome, focus on material purity and safety standards, influencing manufacturing processes. Product substitutes, such as non-reciprocal optical devices employing other principles, are limited in their ability to match the performance and efficiency of Faraday rotators in specific high-power and broad-bandwidth applications. End-user demographics are predominantly research institutions, telecommunications companies, and defense contractors, all seeking high-performance optical components. Mergers and acquisitions (M&A) activities, though not at extremely high values in recent history, are strategically focused on acquiring niche technological expertise and expanding product portfolios. For instance, past M&A deals have averaged around xx million, aiming to integrate advanced crystal manufacturing capabilities. The trend suggests a continued consolidation for specialized crystal producers.
Faraday Rotator Crystals Market Dynamics & Trends
The Faraday rotator crystals market is poised for substantial growth, projected to expand at a Compound Annual Growth Rate (CAGR) of approximately 8.5% from the base year 2025 through 2033. This upward trajectory is primarily fueled by escalating demand from burgeoning sectors like telecommunications, where optical isolators are crucial for signal integrity, and the defense industry, which relies on these components for advanced laser systems and optical sensing. Technological disruptions, such as the development of new magneto-optic materials with higher Verdet constants and wider operating temperature ranges, are significantly impacting market penetration. Companies are continuously investing in research and development to produce crystals that can withstand higher power densities and offer broader spectral response, thereby expanding the application landscape. Consumer preferences are shifting towards smaller, more efficient, and cost-effective Faraday rotator solutions, pushing manufacturers to innovate in miniaturization and integrated optics. Competitive dynamics are intensifying, with established players differentiating themselves through superior material quality, customized solutions, and robust supply chains. Emerging market entrants are often focused on disruptive technologies or niche applications, further stimulating innovation. The market penetration of advanced Faraday rotator crystals is expected to reach xx% by 2033, driven by both technological advancements and increasing adoption across various industries. The continuous pursuit of higher performance metrics, such as lower insertion loss and higher isolation, remains a key factor influencing consumer choices and market trends.
Dominant Regions & Segments in Faraday Rotator Crystals
North America is anticipated to maintain its dominance in the Faraday rotator crystals market throughout the forecast period, driven by a robust defense industry, significant investments in telecommunications infrastructure, and a strong presence of leading research institutions and advanced manufacturing companies. The United States, in particular, is a major hub for optical technology development and adoption. Key drivers for this regional dominance include substantial government funding for defense research and development, a proactive approach to adopting cutting-edge technologies, and a well-established ecosystem for high-tech manufacturing. Economic policies that favor innovation and technological advancement, coupled with significant infrastructure investments in broadband and 5G networks, further bolster the demand for Faraday rotator crystals.
Application Segment Dominance: The Optical Isolator application segment is expected to lead the market, accounting for an estimated xx% of the total market share by 2033. This is due to the indispensable role of optical isolators in protecting sensitive lasers from back-reflected light in fiber optic communication systems, industrial laser processing, and scientific instrumentation. The increasing deployment of high-speed optical networks worldwide directly translates into a higher demand for reliable optical isolators.
Type Segment Dominance: Within the Types segmentation, TGG (Terbium Gallium Garnet) crystals are projected to retain their leading position, representing approximately xx% of the market. TGG crystals are favored for their excellent magneto-optic properties, including a high Verdet constant and good transparency across a wide spectral range, making them ideal for demanding applications requiring high optical isolation and minimal signal loss. While TSAG (Terbium Scandium Aluminum Garnet) and other novel crystal types are gaining traction for specific niche applications, TGG's proven performance and established manufacturing processes ensure its continued market leadership.
Faraday Rotator Crystals Product Innovations
Product innovations in the Faraday rotator crystals sector are currently focused on enhancing the Verdet constant, reducing optical absorption and scattering losses, and improving thermal stability for high-power applications. Manufacturers are developing crystals capable of operating over a wider temperature range and spectral bandwidth. Competitive advantages are being established through proprietary crystal growth techniques, advanced doping processes for tailored magneto-optic properties, and miniaturization of rotator designs for integration into compact optical systems. These advancements are crucial for meeting the evolving demands of telecommunications, defense, and scientific research.
Report Scope & Segmentation Analysis
This report provides a comprehensive analysis of the Faraday rotator crystals market, segmenting it across key applications and crystal types. The Application segmentation includes Faraday Rotator, Optical Isolator, and Others. The Faraday Rotator segment is expected to grow at a CAGR of xx% from 2025 to 2033, driven by specialized laser systems. The Optical Isolator segment, projected to reach xx million by 2033, is the largest and fastest-growing, propelled by the telecommunications boom. The Others segment, encompassing applications like optical modulators and sensors, is anticipated to experience steady growth. The Types segmentation covers TGG, TSAG, and Others. TGG crystals, with a projected market size of xx million in 2033, will continue to dominate due to their well-established performance. TSAG crystals, expected to grow at xx% CAGR, are carving out niches in high-power scenarios. The Others category includes emerging materials with unique properties.
Key Drivers of Faraday Rotator Crystals Growth
The growth of the Faraday rotator crystals market is propelled by several interconnected factors. Technologically, the relentless demand for higher performance in optical communication systems, necessitating improved signal integrity and reduced data loss, is a primary driver. Advances in laser technology for industrial applications, such as materials processing and scientific research, also create a need for efficient optical isolation. Economically, significant global investments in 5G infrastructure and the expansion of data centers are directly fueling the demand for optical isolators. Furthermore, increasing defense spending globally, particularly on advanced laser weaponry, surveillance, and optical countermeasures, significantly contributes to market expansion. Regulatory support for technological innovation in critical sectors also plays a role.
Challenges in the Faraday Rotator Crystals Sector
The Faraday rotator crystals sector faces several challenges that could hinder its growth trajectory. Regulatory hurdles, particularly concerning the sourcing of rare-earth elements used in crystal production and adherence to stringent environmental standards, can lead to increased manufacturing costs and lead times. Supply chain issues, exacerbated by geopolitical tensions and the concentration of raw material suppliers, pose a significant risk of material shortages and price volatility, impacting the cost-effectiveness of crystal production. Competitive pressures from alternative optical isolation technologies, though currently limited in high-performance niches, represent a potential long-term threat. The high cost of specialized crystal growth and processing, coupled with the need for rigorous quality control, also acts as a barrier to widespread adoption in cost-sensitive applications.
Emerging Opportunities in Faraday Rotator Crystals
Emerging opportunities in the Faraday rotator crystals market are centered around several key areas. The rapid expansion of quantum computing and quantum sensing technologies presents a significant new frontier, requiring highly specialized magneto-optic components for precise manipulation of quantum states. Advancements in materials science are leading to the development of novel crystal compositions with superior Verdet constants and broader operational ranges, opening doors for applications in high-energy physics and advanced photonics. The growing demand for miniaturized and integrated optical modules in fields like augmented reality and advanced medical devices offers opportunities for developing smaller, more efficient Faraday rotators. Furthermore, the increasing focus on sustainability and circular economy principles could drive innovation in recycling and remanufacturing processes for rare-earth materials used in crystal production.
Leading Players in the Faraday Rotator Crystals Market
- OXIDE
- Coherent
- Northrop Grumman
- Teledyne FLIR
- CASTECH
- Crylink
- Crystro
- HG Optronics
- YOFC
- DIEN TECH
Key Developments in Faraday Rotator Crystals Industry
- 2023: Introduction of novel TSAG crystal compositions with enhanced Verdet constants for high-power laser applications by Crylink.
- 2022: Northrop Grumman announces advancements in manufacturing techniques for large-aperture TGG crystals for defense laser systems.
- 2021: CASTECH expands its product portfolio to include custom-engineered Faraday rotator crystals for niche scientific research applications.
- 2020: YOFC invests in R&D for next-generation magneto-optic materials to support the evolving telecommunications infrastructure.
- 2019: OXIDE patents a new method for improving the optical uniformity of TGG crystals, leading to lower insertion losses.
Future Outlook for Faraday Rotator Crystals Market
The future outlook for the Faraday rotator crystals market is highly positive, characterized by sustained growth and strategic evolution. The continued expansion of 5G networks, the burgeoning demand for optical isolators in data centers, and significant investments in defense laser technologies will remain key growth accelerators. Emerging fields like quantum computing and advanced photonics are expected to unlock entirely new application segments, demanding novel crystal properties and custom solutions. Companies that focus on material innovation, process optimization for cost reduction, and the development of integrated magneto-optic modules will be well-positioned to capitalize on future market potential. Strategic collaborations and acquisitions aimed at expanding technological capabilities and market reach will continue to shape the competitive landscape.
Faraday Rotator Crystals Segmentation
-
1. Application
- 1.1. Faraday Rotator
- 1.2. Optical Isolator
- 1.3. Others
-
2. Types
- 2.1. TGG
- 2.2. TSAG
- 2.3. Others
Faraday Rotator Crystals Segmentation By Geography
-
1. North America
- 1.1. United States
- 1.2. Canada
- 1.3. Mexico
-
2. South America
- 2.1. Brazil
- 2.2. Argentina
- 2.3. Rest of South America
-
3. Europe
- 3.1. United Kingdom
- 3.2. Germany
- 3.3. France
- 3.4. Italy
- 3.5. Spain
- 3.6. Russia
- 3.7. Benelux
- 3.8. Nordics
- 3.9. Rest of Europe
-
4. Middle East & Africa
- 4.1. Turkey
- 4.2. Israel
- 4.3. GCC
- 4.4. North Africa
- 4.5. South Africa
- 4.6. Rest of Middle East & Africa
-
5. Asia Pacific
- 5.1. China
- 5.2. India
- 5.3. Japan
- 5.4. South Korea
- 5.5. ASEAN
- 5.6. Oceania
- 5.7. Rest of Asia Pacific
Faraday Rotator Crystals Regional Market Share
Geographic Coverage of Faraday Rotator Crystals
Faraday Rotator Crystals REPORT HIGHLIGHTS
| Aspects | Details |
|---|---|
| Study Period | 2020-2034 |
| Base Year | 2025 |
| Estimated Year | 2026 |
| Forecast Period | 2026-2034 |
| Historical Period | 2020-2025 |
| Growth Rate | CAGR of 5.2% from 2020-2034 |
| Segmentation |
|
Table of Contents
- 1. Introduction
- 1.1. Research Scope
- 1.2. Market Segmentation
- 1.3. Research Methodology
- 1.4. Definitions and Assumptions
- 2. Executive Summary
- 2.1. Introduction
- 3. Market Dynamics
- 3.1. Introduction
- 3.2. Market Drivers
- 3.3. Market Restrains
- 3.4. Market Trends
- 4. Market Factor Analysis
- 4.1. Porters Five Forces
- 4.2. Supply/Value Chain
- 4.3. PESTEL analysis
- 4.4. Market Entropy
- 4.5. Patent/Trademark Analysis
- 5. Global Faraday Rotator Crystals Analysis, Insights and Forecast, 2020-2032
- 5.1. Market Analysis, Insights and Forecast - by Application
- 5.1.1. Faraday Rotator
- 5.1.2. Optical Isolator
- 5.1.3. Others
- 5.2. Market Analysis, Insights and Forecast - by Types
- 5.2.1. TGG
- 5.2.2. TSAG
- 5.2.3. Others
- 5.3. Market Analysis, Insights and Forecast - by Region
- 5.3.1. North America
- 5.3.2. South America
- 5.3.3. Europe
- 5.3.4. Middle East & Africa
- 5.3.5. Asia Pacific
- 5.1. Market Analysis, Insights and Forecast - by Application
- 6. North America Faraday Rotator Crystals Analysis, Insights and Forecast, 2020-2032
- 6.1. Market Analysis, Insights and Forecast - by Application
- 6.1.1. Faraday Rotator
- 6.1.2. Optical Isolator
- 6.1.3. Others
- 6.2. Market Analysis, Insights and Forecast - by Types
- 6.2.1. TGG
- 6.2.2. TSAG
- 6.2.3. Others
- 6.1. Market Analysis, Insights and Forecast - by Application
- 7. South America Faraday Rotator Crystals Analysis, Insights and Forecast, 2020-2032
- 7.1. Market Analysis, Insights and Forecast - by Application
- 7.1.1. Faraday Rotator
- 7.1.2. Optical Isolator
- 7.1.3. Others
- 7.2. Market Analysis, Insights and Forecast - by Types
- 7.2.1. TGG
- 7.2.2. TSAG
- 7.2.3. Others
- 7.1. Market Analysis, Insights and Forecast - by Application
- 8. Europe Faraday Rotator Crystals Analysis, Insights and Forecast, 2020-2032
- 8.1. Market Analysis, Insights and Forecast - by Application
- 8.1.1. Faraday Rotator
- 8.1.2. Optical Isolator
- 8.1.3. Others
- 8.2. Market Analysis, Insights and Forecast - by Types
- 8.2.1. TGG
- 8.2.2. TSAG
- 8.2.3. Others
- 8.1. Market Analysis, Insights and Forecast - by Application
- 9. Middle East & Africa Faraday Rotator Crystals Analysis, Insights and Forecast, 2020-2032
- 9.1. Market Analysis, Insights and Forecast - by Application
- 9.1.1. Faraday Rotator
- 9.1.2. Optical Isolator
- 9.1.3. Others
- 9.2. Market Analysis, Insights and Forecast - by Types
- 9.2.1. TGG
- 9.2.2. TSAG
- 9.2.3. Others
- 9.1. Market Analysis, Insights and Forecast - by Application
- 10. Asia Pacific Faraday Rotator Crystals Analysis, Insights and Forecast, 2020-2032
- 10.1. Market Analysis, Insights and Forecast - by Application
- 10.1.1. Faraday Rotator
- 10.1.2. Optical Isolator
- 10.1.3. Others
- 10.2. Market Analysis, Insights and Forecast - by Types
- 10.2.1. TGG
- 10.2.2. TSAG
- 10.2.3. Others
- 10.1. Market Analysis, Insights and Forecast - by Application
- 11. Competitive Analysis
- 11.1. Global Market Share Analysis 2025
- 11.2. Company Profiles
- 11.2.1 OXIDE
- 11.2.1.1. Overview
- 11.2.1.2. Products
- 11.2.1.3. SWOT Analysis
- 11.2.1.4. Recent Developments
- 11.2.1.5. Financials (Based on Availability)
- 11.2.2 Coherent
- 11.2.2.1. Overview
- 11.2.2.2. Products
- 11.2.2.3. SWOT Analysis
- 11.2.2.4. Recent Developments
- 11.2.2.5. Financials (Based on Availability)
- 11.2.3 Northrop Grumman
- 11.2.3.1. Overview
- 11.2.3.2. Products
- 11.2.3.3. SWOT Analysis
- 11.2.3.4. Recent Developments
- 11.2.3.5. Financials (Based on Availability)
- 11.2.4 Teledyne FLIR
- 11.2.4.1. Overview
- 11.2.4.2. Products
- 11.2.4.3. SWOT Analysis
- 11.2.4.4. Recent Developments
- 11.2.4.5. Financials (Based on Availability)
- 11.2.5 CASTECH
- 11.2.5.1. Overview
- 11.2.5.2. Products
- 11.2.5.3. SWOT Analysis
- 11.2.5.4. Recent Developments
- 11.2.5.5. Financials (Based on Availability)
- 11.2.6 Crylink
- 11.2.6.1. Overview
- 11.2.6.2. Products
- 11.2.6.3. SWOT Analysis
- 11.2.6.4. Recent Developments
- 11.2.6.5. Financials (Based on Availability)
- 11.2.7 Crystro
- 11.2.7.1. Overview
- 11.2.7.2. Products
- 11.2.7.3. SWOT Analysis
- 11.2.7.4. Recent Developments
- 11.2.7.5. Financials (Based on Availability)
- 11.2.8 HG Optronics
- 11.2.8.1. Overview
- 11.2.8.2. Products
- 11.2.8.3. SWOT Analysis
- 11.2.8.4. Recent Developments
- 11.2.8.5. Financials (Based on Availability)
- 11.2.9 YOFC
- 11.2.9.1. Overview
- 11.2.9.2. Products
- 11.2.9.3. SWOT Analysis
- 11.2.9.4. Recent Developments
- 11.2.9.5. Financials (Based on Availability)
- 11.2.10 DIEN TECH
- 11.2.10.1. Overview
- 11.2.10.2. Products
- 11.2.10.3. SWOT Analysis
- 11.2.10.4. Recent Developments
- 11.2.10.5. Financials (Based on Availability)
- 11.2.1 OXIDE
List of Figures
- Figure 1: Global Faraday Rotator Crystals Revenue Breakdown (million, %) by Region 2025 & 2033
- Figure 2: Global Faraday Rotator Crystals Volume Breakdown (K, %) by Region 2025 & 2033
- Figure 3: North America Faraday Rotator Crystals Revenue (million), by Application 2025 & 2033
- Figure 4: North America Faraday Rotator Crystals Volume (K), by Application 2025 & 2033
- Figure 5: North America Faraday Rotator Crystals Revenue Share (%), by Application 2025 & 2033
- Figure 6: North America Faraday Rotator Crystals Volume Share (%), by Application 2025 & 2033
- Figure 7: North America Faraday Rotator Crystals Revenue (million), by Types 2025 & 2033
- Figure 8: North America Faraday Rotator Crystals Volume (K), by Types 2025 & 2033
- Figure 9: North America Faraday Rotator Crystals Revenue Share (%), by Types 2025 & 2033
- Figure 10: North America Faraday Rotator Crystals Volume Share (%), by Types 2025 & 2033
- Figure 11: North America Faraday Rotator Crystals Revenue (million), by Country 2025 & 2033
- Figure 12: North America Faraday Rotator Crystals Volume (K), by Country 2025 & 2033
- Figure 13: North America Faraday Rotator Crystals Revenue Share (%), by Country 2025 & 2033
- Figure 14: North America Faraday Rotator Crystals Volume Share (%), by Country 2025 & 2033
- Figure 15: South America Faraday Rotator Crystals Revenue (million), by Application 2025 & 2033
- Figure 16: South America Faraday Rotator Crystals Volume (K), by Application 2025 & 2033
- Figure 17: South America Faraday Rotator Crystals Revenue Share (%), by Application 2025 & 2033
- Figure 18: South America Faraday Rotator Crystals Volume Share (%), by Application 2025 & 2033
- Figure 19: South America Faraday Rotator Crystals Revenue (million), by Types 2025 & 2033
- Figure 20: South America Faraday Rotator Crystals Volume (K), by Types 2025 & 2033
- Figure 21: South America Faraday Rotator Crystals Revenue Share (%), by Types 2025 & 2033
- Figure 22: South America Faraday Rotator Crystals Volume Share (%), by Types 2025 & 2033
- Figure 23: South America Faraday Rotator Crystals Revenue (million), by Country 2025 & 2033
- Figure 24: South America Faraday Rotator Crystals Volume (K), by Country 2025 & 2033
- Figure 25: South America Faraday Rotator Crystals Revenue Share (%), by Country 2025 & 2033
- Figure 26: South America Faraday Rotator Crystals Volume Share (%), by Country 2025 & 2033
- Figure 27: Europe Faraday Rotator Crystals Revenue (million), by Application 2025 & 2033
- Figure 28: Europe Faraday Rotator Crystals Volume (K), by Application 2025 & 2033
- Figure 29: Europe Faraday Rotator Crystals Revenue Share (%), by Application 2025 & 2033
- Figure 30: Europe Faraday Rotator Crystals Volume Share (%), by Application 2025 & 2033
- Figure 31: Europe Faraday Rotator Crystals Revenue (million), by Types 2025 & 2033
- Figure 32: Europe Faraday Rotator Crystals Volume (K), by Types 2025 & 2033
- Figure 33: Europe Faraday Rotator Crystals Revenue Share (%), by Types 2025 & 2033
- Figure 34: Europe Faraday Rotator Crystals Volume Share (%), by Types 2025 & 2033
- Figure 35: Europe Faraday Rotator Crystals Revenue (million), by Country 2025 & 2033
- Figure 36: Europe Faraday Rotator Crystals Volume (K), by Country 2025 & 2033
- Figure 37: Europe Faraday Rotator Crystals Revenue Share (%), by Country 2025 & 2033
- Figure 38: Europe Faraday Rotator Crystals Volume Share (%), by Country 2025 & 2033
- Figure 39: Middle East & Africa Faraday Rotator Crystals Revenue (million), by Application 2025 & 2033
- Figure 40: Middle East & Africa Faraday Rotator Crystals Volume (K), by Application 2025 & 2033
- Figure 41: Middle East & Africa Faraday Rotator Crystals Revenue Share (%), by Application 2025 & 2033
- Figure 42: Middle East & Africa Faraday Rotator Crystals Volume Share (%), by Application 2025 & 2033
- Figure 43: Middle East & Africa Faraday Rotator Crystals Revenue (million), by Types 2025 & 2033
- Figure 44: Middle East & Africa Faraday Rotator Crystals Volume (K), by Types 2025 & 2033
- Figure 45: Middle East & Africa Faraday Rotator Crystals Revenue Share (%), by Types 2025 & 2033
- Figure 46: Middle East & Africa Faraday Rotator Crystals Volume Share (%), by Types 2025 & 2033
- Figure 47: Middle East & Africa Faraday Rotator Crystals Revenue (million), by Country 2025 & 2033
- Figure 48: Middle East & Africa Faraday Rotator Crystals Volume (K), by Country 2025 & 2033
- Figure 49: Middle East & Africa Faraday Rotator Crystals Revenue Share (%), by Country 2025 & 2033
- Figure 50: Middle East & Africa Faraday Rotator Crystals Volume Share (%), by Country 2025 & 2033
- Figure 51: Asia Pacific Faraday Rotator Crystals Revenue (million), by Application 2025 & 2033
- Figure 52: Asia Pacific Faraday Rotator Crystals Volume (K), by Application 2025 & 2033
- Figure 53: Asia Pacific Faraday Rotator Crystals Revenue Share (%), by Application 2025 & 2033
- Figure 54: Asia Pacific Faraday Rotator Crystals Volume Share (%), by Application 2025 & 2033
- Figure 55: Asia Pacific Faraday Rotator Crystals Revenue (million), by Types 2025 & 2033
- Figure 56: Asia Pacific Faraday Rotator Crystals Volume (K), by Types 2025 & 2033
- Figure 57: Asia Pacific Faraday Rotator Crystals Revenue Share (%), by Types 2025 & 2033
- Figure 58: Asia Pacific Faraday Rotator Crystals Volume Share (%), by Types 2025 & 2033
- Figure 59: Asia Pacific Faraday Rotator Crystals Revenue (million), by Country 2025 & 2033
- Figure 60: Asia Pacific Faraday Rotator Crystals Volume (K), by Country 2025 & 2033
- Figure 61: Asia Pacific Faraday Rotator Crystals Revenue Share (%), by Country 2025 & 2033
- Figure 62: Asia Pacific Faraday Rotator Crystals Volume Share (%), by Country 2025 & 2033
List of Tables
- Table 1: Global Faraday Rotator Crystals Revenue million Forecast, by Application 2020 & 2033
- Table 2: Global Faraday Rotator Crystals Volume K Forecast, by Application 2020 & 2033
- Table 3: Global Faraday Rotator Crystals Revenue million Forecast, by Types 2020 & 2033
- Table 4: Global Faraday Rotator Crystals Volume K Forecast, by Types 2020 & 2033
- Table 5: Global Faraday Rotator Crystals Revenue million Forecast, by Region 2020 & 2033
- Table 6: Global Faraday Rotator Crystals Volume K Forecast, by Region 2020 & 2033
- Table 7: Global Faraday Rotator Crystals Revenue million Forecast, by Application 2020 & 2033
- Table 8: Global Faraday Rotator Crystals Volume K Forecast, by Application 2020 & 2033
- Table 9: Global Faraday Rotator Crystals Revenue million Forecast, by Types 2020 & 2033
- Table 10: Global Faraday Rotator Crystals Volume K Forecast, by Types 2020 & 2033
- Table 11: Global Faraday Rotator Crystals Revenue million Forecast, by Country 2020 & 2033
- Table 12: Global Faraday Rotator Crystals Volume K Forecast, by Country 2020 & 2033
- Table 13: United States Faraday Rotator Crystals Revenue (million) Forecast, by Application 2020 & 2033
- Table 14: United States Faraday Rotator Crystals Volume (K) Forecast, by Application 2020 & 2033
- Table 15: Canada Faraday Rotator Crystals Revenue (million) Forecast, by Application 2020 & 2033
- Table 16: Canada Faraday Rotator Crystals Volume (K) Forecast, by Application 2020 & 2033
- Table 17: Mexico Faraday Rotator Crystals Revenue (million) Forecast, by Application 2020 & 2033
- Table 18: Mexico Faraday Rotator Crystals Volume (K) Forecast, by Application 2020 & 2033
- Table 19: Global Faraday Rotator Crystals Revenue million Forecast, by Application 2020 & 2033
- Table 20: Global Faraday Rotator Crystals Volume K Forecast, by Application 2020 & 2033
- Table 21: Global Faraday Rotator Crystals Revenue million Forecast, by Types 2020 & 2033
- Table 22: Global Faraday Rotator Crystals Volume K Forecast, by Types 2020 & 2033
- Table 23: Global Faraday Rotator Crystals Revenue million Forecast, by Country 2020 & 2033
- Table 24: Global Faraday Rotator Crystals Volume K Forecast, by Country 2020 & 2033
- Table 25: Brazil Faraday Rotator Crystals Revenue (million) Forecast, by Application 2020 & 2033
- Table 26: Brazil Faraday Rotator Crystals Volume (K) Forecast, by Application 2020 & 2033
- Table 27: Argentina Faraday Rotator Crystals Revenue (million) Forecast, by Application 2020 & 2033
- Table 28: Argentina Faraday Rotator Crystals Volume (K) Forecast, by Application 2020 & 2033
- Table 29: Rest of South America Faraday Rotator Crystals Revenue (million) Forecast, by Application 2020 & 2033
- Table 30: Rest of South America Faraday Rotator Crystals Volume (K) Forecast, by Application 2020 & 2033
- Table 31: Global Faraday Rotator Crystals Revenue million Forecast, by Application 2020 & 2033
- Table 32: Global Faraday Rotator Crystals Volume K Forecast, by Application 2020 & 2033
- Table 33: Global Faraday Rotator Crystals Revenue million Forecast, by Types 2020 & 2033
- Table 34: Global Faraday Rotator Crystals Volume K Forecast, by Types 2020 & 2033
- Table 35: Global Faraday Rotator Crystals Revenue million Forecast, by Country 2020 & 2033
- Table 36: Global Faraday Rotator Crystals Volume K Forecast, by Country 2020 & 2033
- Table 37: United Kingdom Faraday Rotator Crystals Revenue (million) Forecast, by Application 2020 & 2033
- Table 38: United Kingdom Faraday Rotator Crystals Volume (K) Forecast, by Application 2020 & 2033
- Table 39: Germany Faraday Rotator Crystals Revenue (million) Forecast, by Application 2020 & 2033
- Table 40: Germany Faraday Rotator Crystals Volume (K) Forecast, by Application 2020 & 2033
- Table 41: France Faraday Rotator Crystals Revenue (million) Forecast, by Application 2020 & 2033
- Table 42: France Faraday Rotator Crystals Volume (K) Forecast, by Application 2020 & 2033
- Table 43: Italy Faraday Rotator Crystals Revenue (million) Forecast, by Application 2020 & 2033
- Table 44: Italy Faraday Rotator Crystals Volume (K) Forecast, by Application 2020 & 2033
- Table 45: Spain Faraday Rotator Crystals Revenue (million) Forecast, by Application 2020 & 2033
- Table 46: Spain Faraday Rotator Crystals Volume (K) Forecast, by Application 2020 & 2033
- Table 47: Russia Faraday Rotator Crystals Revenue (million) Forecast, by Application 2020 & 2033
- Table 48: Russia Faraday Rotator Crystals Volume (K) Forecast, by Application 2020 & 2033
- Table 49: Benelux Faraday Rotator Crystals Revenue (million) Forecast, by Application 2020 & 2033
- Table 50: Benelux Faraday Rotator Crystals Volume (K) Forecast, by Application 2020 & 2033
- Table 51: Nordics Faraday Rotator Crystals Revenue (million) Forecast, by Application 2020 & 2033
- Table 52: Nordics Faraday Rotator Crystals Volume (K) Forecast, by Application 2020 & 2033
- Table 53: Rest of Europe Faraday Rotator Crystals Revenue (million) Forecast, by Application 2020 & 2033
- Table 54: Rest of Europe Faraday Rotator Crystals Volume (K) Forecast, by Application 2020 & 2033
- Table 55: Global Faraday Rotator Crystals Revenue million Forecast, by Application 2020 & 2033
- Table 56: Global Faraday Rotator Crystals Volume K Forecast, by Application 2020 & 2033
- Table 57: Global Faraday Rotator Crystals Revenue million Forecast, by Types 2020 & 2033
- Table 58: Global Faraday Rotator Crystals Volume K Forecast, by Types 2020 & 2033
- Table 59: Global Faraday Rotator Crystals Revenue million Forecast, by Country 2020 & 2033
- Table 60: Global Faraday Rotator Crystals Volume K Forecast, by Country 2020 & 2033
- Table 61: Turkey Faraday Rotator Crystals Revenue (million) Forecast, by Application 2020 & 2033
- Table 62: Turkey Faraday Rotator Crystals Volume (K) Forecast, by Application 2020 & 2033
- Table 63: Israel Faraday Rotator Crystals Revenue (million) Forecast, by Application 2020 & 2033
- Table 64: Israel Faraday Rotator Crystals Volume (K) Forecast, by Application 2020 & 2033
- Table 65: GCC Faraday Rotator Crystals Revenue (million) Forecast, by Application 2020 & 2033
- Table 66: GCC Faraday Rotator Crystals Volume (K) Forecast, by Application 2020 & 2033
- Table 67: North Africa Faraday Rotator Crystals Revenue (million) Forecast, by Application 2020 & 2033
- Table 68: North Africa Faraday Rotator Crystals Volume (K) Forecast, by Application 2020 & 2033
- Table 69: South Africa Faraday Rotator Crystals Revenue (million) Forecast, by Application 2020 & 2033
- Table 70: South Africa Faraday Rotator Crystals Volume (K) Forecast, by Application 2020 & 2033
- Table 71: Rest of Middle East & Africa Faraday Rotator Crystals Revenue (million) Forecast, by Application 2020 & 2033
- Table 72: Rest of Middle East & Africa Faraday Rotator Crystals Volume (K) Forecast, by Application 2020 & 2033
- Table 73: Global Faraday Rotator Crystals Revenue million Forecast, by Application 2020 & 2033
- Table 74: Global Faraday Rotator Crystals Volume K Forecast, by Application 2020 & 2033
- Table 75: Global Faraday Rotator Crystals Revenue million Forecast, by Types 2020 & 2033
- Table 76: Global Faraday Rotator Crystals Volume K Forecast, by Types 2020 & 2033
- Table 77: Global Faraday Rotator Crystals Revenue million Forecast, by Country 2020 & 2033
- Table 78: Global Faraday Rotator Crystals Volume K Forecast, by Country 2020 & 2033
- Table 79: China Faraday Rotator Crystals Revenue (million) Forecast, by Application 2020 & 2033
- Table 80: China Faraday Rotator Crystals Volume (K) Forecast, by Application 2020 & 2033
- Table 81: India Faraday Rotator Crystals Revenue (million) Forecast, by Application 2020 & 2033
- Table 82: India Faraday Rotator Crystals Volume (K) Forecast, by Application 2020 & 2033
- Table 83: Japan Faraday Rotator Crystals Revenue (million) Forecast, by Application 2020 & 2033
- Table 84: Japan Faraday Rotator Crystals Volume (K) Forecast, by Application 2020 & 2033
- Table 85: South Korea Faraday Rotator Crystals Revenue (million) Forecast, by Application 2020 & 2033
- Table 86: South Korea Faraday Rotator Crystals Volume (K) Forecast, by Application 2020 & 2033
- Table 87: ASEAN Faraday Rotator Crystals Revenue (million) Forecast, by Application 2020 & 2033
- Table 88: ASEAN Faraday Rotator Crystals Volume (K) Forecast, by Application 2020 & 2033
- Table 89: Oceania Faraday Rotator Crystals Revenue (million) Forecast, by Application 2020 & 2033
- Table 90: Oceania Faraday Rotator Crystals Volume (K) Forecast, by Application 2020 & 2033
- Table 91: Rest of Asia Pacific Faraday Rotator Crystals Revenue (million) Forecast, by Application 2020 & 2033
- Table 92: Rest of Asia Pacific Faraday Rotator Crystals Volume (K) Forecast, by Application 2020 & 2033
Frequently Asked Questions
1. What is the projected Compound Annual Growth Rate (CAGR) of the Faraday Rotator Crystals?
The projected CAGR is approximately 5.2%.
2. Which companies are prominent players in the Faraday Rotator Crystals?
Key companies in the market include OXIDE, Coherent, Northrop Grumman, Teledyne FLIR, CASTECH, Crylink, Crystro, HG Optronics, YOFC, DIEN TECH.
3. What are the main segments of the Faraday Rotator Crystals?
The market segments include Application, Types.
4. Can you provide details about the market size?
The market size is estimated to be USD 344 million as of 2022.
5. What are some drivers contributing to market growth?
N/A
6. What are the notable trends driving market growth?
N/A
7. Are there any restraints impacting market growth?
N/A
8. Can you provide examples of recent developments in the market?
N/A
9. What pricing options are available for accessing the report?
Pricing options include single-user, multi-user, and enterprise licenses priced at USD 3950.00, USD 5925.00, and USD 7900.00 respectively.
10. Is the market size provided in terms of value or volume?
The market size is provided in terms of value, measured in million and volume, measured in K.
11. Are there any specific market keywords associated with the report?
Yes, the market keyword associated with the report is "Faraday Rotator Crystals," which aids in identifying and referencing the specific market segment covered.
12. How do I determine which pricing option suits my needs best?
The pricing options vary based on user requirements and access needs. Individual users may opt for single-user licenses, while businesses requiring broader access may choose multi-user or enterprise licenses for cost-effective access to the report.
13. Are there any additional resources or data provided in the Faraday Rotator Crystals report?
While the report offers comprehensive insights, it's advisable to review the specific contents or supplementary materials provided to ascertain if additional resources or data are available.
14. How can I stay updated on further developments or reports in the Faraday Rotator Crystals?
To stay informed about further developments, trends, and reports in the Faraday Rotator Crystals, consider subscribing to industry newsletters, following relevant companies and organizations, or regularly checking reputable industry news sources and publications.
Methodology
Step 1 - Identification of Relevant Samples Size from Population Database


Step 2 - Approaches for Defining Global Market Size (Value, Volume* & Price*)

Note*: In applicable scenarios
Step 3 - Data Sources
Primary Research
- Web Analytics
- Survey Reports
- Research Institute
- Latest Research Reports
- Opinion Leaders
Secondary Research
- Annual Reports
- White Paper
- Latest Press Release
- Industry Association
- Paid Database
- Investor Presentations

Step 4 - Data Triangulation
Involves using different sources of information in order to increase the validity of a study
These sources are likely to be stakeholders in a program - participants, other researchers, program staff, other community members, and so on.
Then we put all data in single framework & apply various statistical tools to find out the dynamic on the market.
During the analysis stage, feedback from the stakeholder groups would be compared to determine areas of agreement as well as areas of divergence

