

Key Insights
The Fatty Acid Methyl Ester (FAME) market is experiencing substantial expansion, propelled by escalating demand for biofuels and sustainable alternatives to petrochemicals. The market, valued at $23.2 billion in 2024, is projected to achieve a Compound Annual Growth Rate (CAGR) of 5.6% through 2033. Key growth drivers include robust environmental regulations mandating biofuel adoption, heightened consumer and corporate awareness of sustainability, and the inherent versatility of FAMEs across various applications. The biofuel sector currently leads market share, supported by government incentives and mandates for renewable energy. Significant growth opportunities are also identified within the lubricants, coatings, and personal care industries, attributed to the eco-friendly attributes and performance benefits of FAMEs. Rapeseed methyl ester and soy methyl ester represent the dominant FAME types, leveraging readily available feedstock and established manufacturing infrastructure. The competitive landscape features both established chemical conglomerates and specialized producers contending for market dominance. Geographically, North America and Europe currently lead market expansion, with the Asia-Pacific region demonstrating rapid growth.
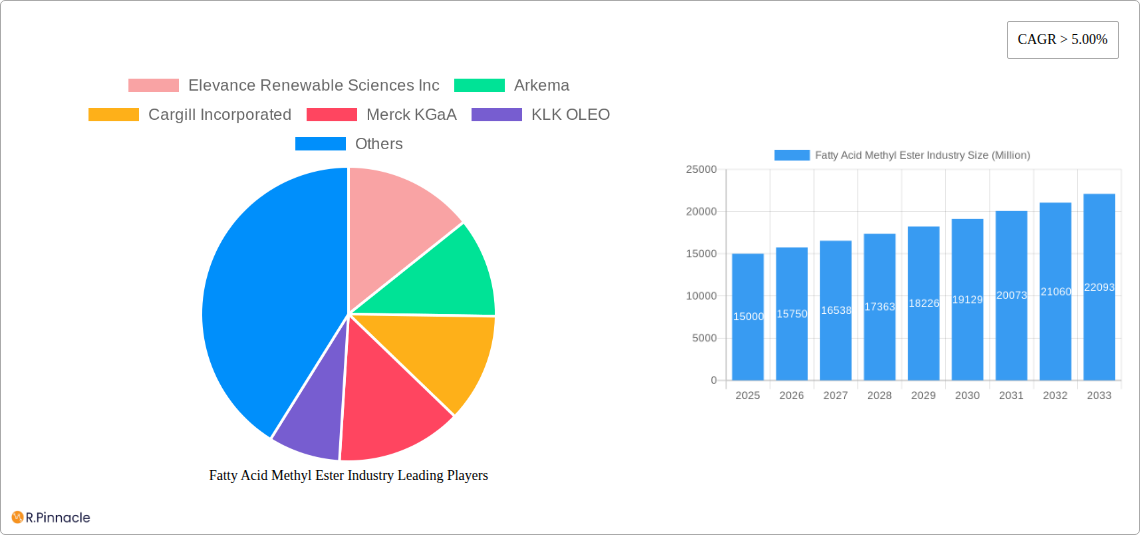
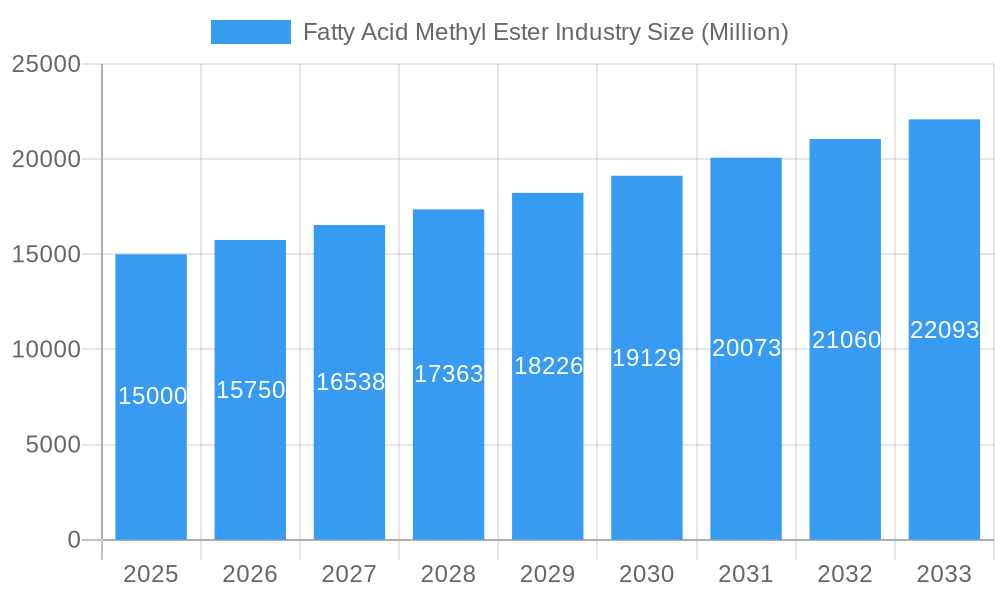
Fatty Acid Methyl Ester Industry Market Size (In Billion)
Challenges to market growth include feedstock price volatility, competition from alternative biofuels, and the imperative for enhanced FAME production efficiency and cost-effectiveness through technological advancements. Future market expansion will be shaped by continued governmental support for biofuels, innovations in FAME production technologies, and feedstock diversification. Conversely, fluctuating crude oil prices, competition from other renewable energy sources, and potential supply chain disruptions represent significant risks. The market landscape, populated by key players such as Elevance Renewable Sciences, Arkema, and Cargill, offers avenues for strategic alliances and collaborative innovation. While developed markets are expected to maintain their lead, emerging economies in the Asia-Pacific region are poised for substantial growth, driven by industrialization and increasing environmental consciousness. Overall, the long-term outlook for the FAME industry is highly positive, aligning with global efforts to reduce reliance on fossil fuels and adopt sustainable solutions.
Fatty Acid Methyl Ester Industry Company Market Share
Fatty Acid Methyl Ester (FAME) Industry Report: 2019-2033
This comprehensive report provides an in-depth analysis of the global Fatty Acid Methyl Ester (FAME) industry, offering invaluable insights for industry professionals, investors, and strategic decision-makers. The report covers the period from 2019 to 2033, with a base year of 2025 and a forecast period of 2025-2033. The market is segmented by application (Fuel, Lubricants, Coatings, Food and Agriculture, Metalworking Fluids, Personal Care Products, Other Applications) and type (Rapeseed Methyl Ester, Soy Methyl Ester, Palm Oil Methyl Ester, Other Types). Expect detailed analysis of market size (in Millions), CAGR, and key industry trends.
Fatty Acid Methyl Ester Industry Market Structure & Innovation Trends
This section analyzes the competitive landscape of the FAME industry, exploring market concentration, innovation drivers, regulatory frameworks, and key market dynamics. We examine the impact of mergers and acquisitions (M&A) activity, evaluating deal values and their influence on market share. The report includes a detailed assessment of product substitutes and evolving end-user demographics. Key players such as Elevance Renewable Sciences Inc, Arkema, Cargill Incorporated, Merck KGaA, KLK OLEO, Wilmar International Ltd, TCI Chemicals (India) Pvt Ltd, BASF SE, Krishi Oils Limited, Larodan AB (ABITEC), Univar Solutions Inc, and Cayman Chemical are analyzed for their market positioning and strategic initiatives. We estimate that the total market size in 2025 will be xx Million, with a xx% market share held by the top three players. The report will reveal the average M&A deal value for the period 2019-2024 to be xx Million.
- Analysis of market concentration ratios (e.g., CR4, CR8).
- Detailed examination of innovation drivers, including technological advancements and sustainability initiatives.
- Assessment of the impact of regulatory frameworks and environmental regulations on market growth.
- Identification of key product substitutes and their market impact.
- Analysis of end-user demographics and their preferences influencing FAME demand.
- Comprehensive overview of M&A activities with deal values.
Fatty Acid Methyl Ester Industry Market Dynamics & Trends
This section delves into the key factors driving market growth, exploring technological disruptions, shifting consumer preferences, and competitive dynamics within the FAME industry. The report analyzes the Compound Annual Growth Rate (CAGR) and market penetration rate for various segments. We project a CAGR of xx% for the forecast period (2025-2033), driven by factors such as increasing demand for biofuels, stringent environmental regulations, and growing applications in various industries. The impact of technological advancements on production efficiency and cost reduction will also be extensively analyzed. Specific market trends such as the adoption of sustainable sourcing practices and the development of novel FAME applications will also be examined. The report also accounts for the influence of fluctuating raw material prices on market dynamics.
Dominant Regions & Segments in Fatty Acid Methyl Ester Industry
This section identifies the leading geographical regions and application/type segments within the global FAME market. The analysis will pinpoint the dominant regions based on factors like economic policies, infrastructure development, and consumer demand. For example, the report will detail why a specific region holds a significant market share in the Fuel application segment or why a certain type of FAME (e.g., Soy Methyl Ester) dominates in a particular region. Key drivers specific to each leading region and segment will be highlighted using bullet points. This detailed analysis will provide strategic insights for market entry and expansion.
- Key Drivers for Dominant Regions:
- Government incentives and policies supporting biofuel production.
- Robust infrastructure for FAME production and distribution.
- Strong consumer demand for sustainable and environmentally friendly products.
- Favorable economic conditions and high disposable income.
- Dominant Segments: Detailed analysis of the leading application segments (e.g., Fuel, Lubricants) and FAME types (e.g., Soy Methyl Ester, Palm Oil Methyl Ester).
Fatty Acid Methyl Ester Industry Product Innovations
This section showcases the latest advancements in FAME technology, highlighting key product developments, applications, and competitive advantages. The analysis will emphasize how technological advancements and market fit are driving product innovation within the FAME industry. We will focus on the trends shaping product development and the competitive dynamics influenced by these innovations. This will include analysis of product differentiation strategies employed by major players.
Report Scope & Segmentation Analysis
This report segments the FAME market by Application (Fuel, Lubricants, Coatings, Food and Agriculture, Metalworking Fluids, Personal Care Products, Other Applications) and Type (Rapeseed Methyl Ester, Soy Methyl Ester, Palm Oil Methyl Ester, Other Types). Each segment’s growth projections, market size (in Millions), and competitive dynamics are explored, providing a granular view of the market landscape. Each segment will have its own paragraph, detailing its characteristics, growth potential, and competitive dynamics. Growth projections will be presented for the forecast period (2025-2033).
Key Drivers of Fatty Acid Methyl Ester Industry Growth
This section pinpoints the core factors propelling FAME market growth. These include technological advancements (e.g., improved production processes, enhanced catalyst efficiency), favorable economic conditions (e.g., increased disposable income, growing industrialization), and supportive government regulations (e.g., biofuel mandates, environmental policies). Specific examples and quantifiable data will be used to support the analysis.
Challenges in the Fatty Acid Methyl Ester Industry Sector
This section identifies and analyzes the key challenges hindering FAME market growth. This includes regulatory hurdles (e.g., complex permitting processes, stringent environmental standards), supply chain disruptions (e.g., volatility in raw material prices, logistical challenges), and intense competitive pressure (e.g., price wars, technological competition). We will also quantify the impact of these challenges, highlighting their effect on market growth and profitability.
Emerging Opportunities in Fatty Acid Methyl Ester Industry
This section highlights the emerging opportunities in the FAME market, including the expansion into new applications (e.g., bioplastics, specialty chemicals), the adoption of advanced technologies (e.g., AI-powered optimization, sustainable production methods), and catering to evolving consumer preferences (e.g., demand for sustainable and eco-friendly products). We also examine potential market expansion into new geographic regions.
Leading Players in the Fatty Acid Methyl Ester Industry Market
- Elevance Renewable Sciences Inc
- Arkema
- Cargill Incorporated
- Merck KGaA
- KLK OLEO
- Wilmar International Ltd
- TCI Chemicals (India) Pvt Ltd
- BASF SE
- Krishi Oils Limited
- Larodan AB (ABITEC)
- Univar Solutions Inc
- Cayman Chemical
Key Developments in Fatty Acid Methyl Ester Industry Industry
- [Date]: [Development – e.g., New product launch by Company X]
- [Date]: [Development – e.g., Merger between Company Y and Company Z]
- [Date]: [Development – e.g., New regulatory framework implemented in Region A]
- …and further developments as detailed in the full report.
Future Outlook for Fatty Acid Methyl Ester Industry Market
The FAME industry is poised for significant growth over the next decade, driven by factors such as the increasing adoption of biofuels, growing demand for sustainable products, and technological advancements. Strategic opportunities abound for companies to capitalize on this growth, including investments in research and development, expansion into new markets, and development of innovative products. This necessitates strategic planning by industry players to maintain competitiveness and leverage emerging trends.
Fatty Acid Methyl Ester Industry Segmentation
-
1. Type
- 1.1. Rapeseed Methyl Ester
- 1.2. Soy Methyl Ester
- 1.3. Palm Oil Methyl Ester
- 1.4. Other Types
-
2. Application
- 2.1. Fuel
- 2.2. Lubricants
- 2.3. Coatings
- 2.4. Food and Agriculture
- 2.5. Metalworking Fluids
- 2.6. Personal Care Products
- 2.7. Other Applications
Fatty Acid Methyl Ester Industry Segmentation By Geography
-
1. Asia Pacific
- 1.1. China
- 1.2. India
- 1.3. Japan
- 1.4. South Korea
- 1.5. Rest of Asia Pacific
-
2. North America
- 2.1. United States
- 2.2. Canada
- 2.3. Mexico
-
3. Europe
- 3.1. Germany
- 3.2. United Kingdom
- 3.3. France
- 3.4. Italy
- 3.5. Rest of Europe
-
4. South America
- 4.1. Brazil
- 4.2. Argentina
- 4.3. Rest of South America
-
5. Middle East and Africa
- 5.1. Saudi Arabia
- 5.2. South Africa
- 5.3. Rest of Middle East and Africa
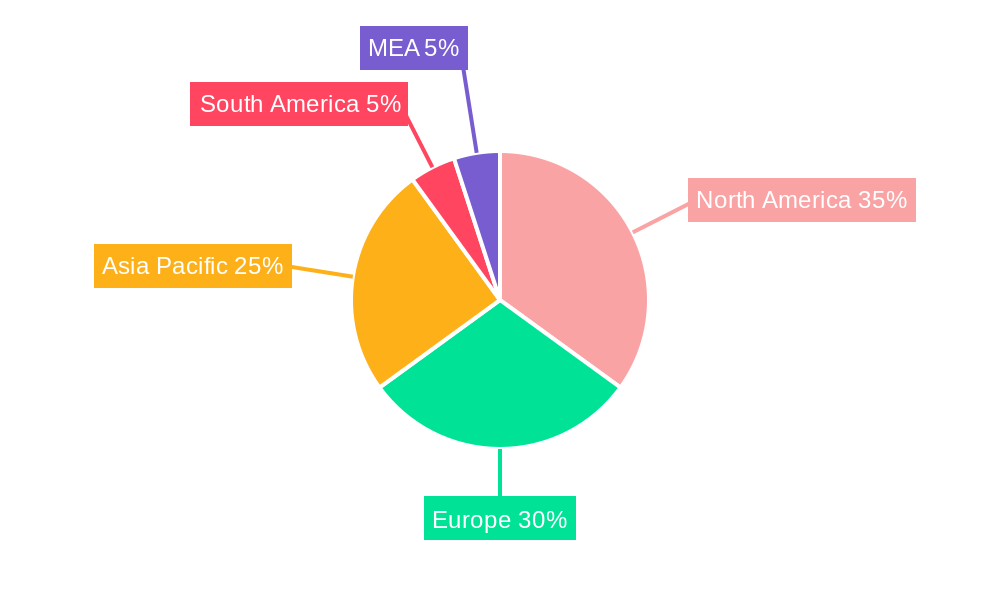
Fatty Acid Methyl Ester Industry Regional Market Share
Geographic Coverage of Fatty Acid Methyl Ester Industry
Fatty Acid Methyl Ester Industry REPORT HIGHLIGHTS
| Aspects | Details |
|---|---|
| Study Period | 2020-2034 |
| Base Year | 2025 |
| Estimated Year | 2026 |
| Forecast Period | 2026-2034 |
| Historical Period | 2020-2025 |
| Growth Rate | CAGR of 5.6% from 2020-2034 |
| Segmentation |
|
Table of Contents
- 1. Introduction
- 1.1. Research Scope
- 1.2. Market Segmentation
- 1.3. Research Objective
- 1.4. Definitions and Assumptions
- 2. Executive Summary
- 2.1. Market Snapshot
- 3. Market Dynamics
- 3.1. Market Drivers
- 3.2. Market Restrains
- 3.3. Market Trends
- 3.4. Market Opportunities
- 4. Market Factor Analysis
- 4.1. Porters Five Forces
- 4.1.1. Bargaining Power of Suppliers
- 4.1.2. Bargaining Power of Buyers
- 4.1.3. Threat of New Entrants
- 4.1.4. Threat of Substitutes
- 4.1.5. Competitive Rivalry
- 4.2. PESTEL analysis
- 4.3. BCG Analysis
- 4.3.1. Stars (High Growth, High Market Share)
- 4.3.2. Cash Cows (Low Growth, High Market Share)
- 4.3.3. Question Mark (High Growth, Low Market Share)
- 4.3.4. Dogs (Low Growth, Low Market Share)
- 4.4. Ansoff Matrix Analysis
- 4.5. Supply Chain Analysis
- 4.6. Regulatory Landscape
- 4.7. Current Market Potential and Opportunity Assessment (TAM–SAM–SOM Framework)
- 4.8. PRI Analyst Note
- 4.1. Porters Five Forces
- 5. Market Analysis, Insights and Forecast 2021-2033
- 5.1. Market Analysis, Insights and Forecast - by Type
- 5.1.1. Rapeseed Methyl Ester
- 5.1.2. Soy Methyl Ester
- 5.1.3. Palm Oil Methyl Ester
- 5.1.4. Other Types
- 5.2. Market Analysis, Insights and Forecast - by Application
- 5.2.1. Fuel
- 5.2.2. Lubricants
- 5.2.3. Coatings
- 5.2.4. Food and Agriculture
- 5.2.5. Metalworking Fluids
- 5.2.6. Personal Care Products
- 5.2.7. Other Applications
- 5.3. Market Analysis, Insights and Forecast - by Region
- 5.3.1. Asia Pacific
- 5.3.2. North America
- 5.3.3. Europe
- 5.3.4. South America
- 5.3.5. Middle East and Africa
- 5.1. Market Analysis, Insights and Forecast - by Type
- 6. Global Fatty Acid Methyl Ester Industry Analysis, Insights and Forecast, 2021-2033
- 6.1. Market Analysis, Insights and Forecast - by Type
- 6.1.1. Rapeseed Methyl Ester
- 6.1.2. Soy Methyl Ester
- 6.1.3. Palm Oil Methyl Ester
- 6.1.4. Other Types
- 6.2. Market Analysis, Insights and Forecast - by Application
- 6.2.1. Fuel
- 6.2.2. Lubricants
- 6.2.3. Coatings
- 6.2.4. Food and Agriculture
- 6.2.5. Metalworking Fluids
- 6.2.6. Personal Care Products
- 6.2.7. Other Applications
- 6.1. Market Analysis, Insights and Forecast - by Type
- 7. Asia Pacific Fatty Acid Methyl Ester Industry Analysis, Insights and Forecast, 2020-2032
- 7.1. Market Analysis, Insights and Forecast - by Type
- 7.1.1. Rapeseed Methyl Ester
- 7.1.2. Soy Methyl Ester
- 7.1.3. Palm Oil Methyl Ester
- 7.1.4. Other Types
- 7.2. Market Analysis, Insights and Forecast - by Application
- 7.2.1. Fuel
- 7.2.2. Lubricants
- 7.2.3. Coatings
- 7.2.4. Food and Agriculture
- 7.2.5. Metalworking Fluids
- 7.2.6. Personal Care Products
- 7.2.7. Other Applications
- 7.1. Market Analysis, Insights and Forecast - by Type
- 8. North America Fatty Acid Methyl Ester Industry Analysis, Insights and Forecast, 2020-2032
- 8.1. Market Analysis, Insights and Forecast - by Type
- 8.1.1. Rapeseed Methyl Ester
- 8.1.2. Soy Methyl Ester
- 8.1.3. Palm Oil Methyl Ester
- 8.1.4. Other Types
- 8.2. Market Analysis, Insights and Forecast - by Application
- 8.2.1. Fuel
- 8.2.2. Lubricants
- 8.2.3. Coatings
- 8.2.4. Food and Agriculture
- 8.2.5. Metalworking Fluids
- 8.2.6. Personal Care Products
- 8.2.7. Other Applications
- 8.1. Market Analysis, Insights and Forecast - by Type
- 9. Europe Fatty Acid Methyl Ester Industry Analysis, Insights and Forecast, 2020-2032
- 9.1. Market Analysis, Insights and Forecast - by Type
- 9.1.1. Rapeseed Methyl Ester
- 9.1.2. Soy Methyl Ester
- 9.1.3. Palm Oil Methyl Ester
- 9.1.4. Other Types
- 9.2. Market Analysis, Insights and Forecast - by Application
- 9.2.1. Fuel
- 9.2.2. Lubricants
- 9.2.3. Coatings
- 9.2.4. Food and Agriculture
- 9.2.5. Metalworking Fluids
- 9.2.6. Personal Care Products
- 9.2.7. Other Applications
- 9.1. Market Analysis, Insights and Forecast - by Type
- 10. South America Fatty Acid Methyl Ester Industry Analysis, Insights and Forecast, 2020-2032
- 10.1. Market Analysis, Insights and Forecast - by Type
- 10.1.1. Rapeseed Methyl Ester
- 10.1.2. Soy Methyl Ester
- 10.1.3. Palm Oil Methyl Ester
- 10.1.4. Other Types
- 10.2. Market Analysis, Insights and Forecast - by Application
- 10.2.1. Fuel
- 10.2.2. Lubricants
- 10.2.3. Coatings
- 10.2.4. Food and Agriculture
- 10.2.5. Metalworking Fluids
- 10.2.6. Personal Care Products
- 10.2.7. Other Applications
- 10.1. Market Analysis, Insights and Forecast - by Type
- 11. Middle East and Africa Fatty Acid Methyl Ester Industry Analysis, Insights and Forecast, 2020-2032
- 11.1. Market Analysis, Insights and Forecast - by Type
- 11.1.1. Rapeseed Methyl Ester
- 11.1.2. Soy Methyl Ester
- 11.1.3. Palm Oil Methyl Ester
- 11.1.4. Other Types
- 11.2. Market Analysis, Insights and Forecast - by Application
- 11.2.1. Fuel
- 11.2.2. Lubricants
- 11.2.3. Coatings
- 11.2.4. Food and Agriculture
- 11.2.5. Metalworking Fluids
- 11.2.6. Personal Care Products
- 11.2.7. Other Applications
- 11.1. Market Analysis, Insights and Forecast - by Type
- 12. Competitive Analysis
- 12.1. Company Profiles
- 12.1.1 Elevance Renewable Sciences Inc
- 12.1.1.1. Company Overview
- 12.1.1.2. Products
- 12.1.1.3. Company Financials
- 12.1.1.4. SWOT Analysis
- 12.1.2 Arkema
- 12.1.2.1. Company Overview
- 12.1.2.2. Products
- 12.1.2.3. Company Financials
- 12.1.2.4. SWOT Analysis
- 12.1.3 Cargill Incorporated
- 12.1.3.1. Company Overview
- 12.1.3.2. Products
- 12.1.3.3. Company Financials
- 12.1.3.4. SWOT Analysis
- 12.1.4 Merck KGaA
- 12.1.4.1. Company Overview
- 12.1.4.2. Products
- 12.1.4.3. Company Financials
- 12.1.4.4. SWOT Analysis
- 12.1.5 KLK OLEO
- 12.1.5.1. Company Overview
- 12.1.5.2. Products
- 12.1.5.3. Company Financials
- 12.1.5.4. SWOT Analysis
- 12.1.6 Wilmar International Ltd
- 12.1.6.1. Company Overview
- 12.1.6.2. Products
- 12.1.6.3. Company Financials
- 12.1.6.4. SWOT Analysis
- 12.1.7 TCI Chemicals (India) Pvt Ltd
- 12.1.7.1. Company Overview
- 12.1.7.2. Products
- 12.1.7.3. Company Financials
- 12.1.7.4. SWOT Analysis
- 12.1.8 BASF SE
- 12.1.8.1. Company Overview
- 12.1.8.2. Products
- 12.1.8.3. Company Financials
- 12.1.8.4. SWOT Analysis
- 12.1.9 Krishi Oils Limited
- 12.1.9.1. Company Overview
- 12.1.9.2. Products
- 12.1.9.3. Company Financials
- 12.1.9.4. SWOT Analysis
- 12.1.10 Larodan AB (ABITEC)
- 12.1.10.1. Company Overview
- 12.1.10.2. Products
- 12.1.10.3. Company Financials
- 12.1.10.4. SWOT Analysis
- 12.1.11 Univar Solutions Inc
- 12.1.11.1. Company Overview
- 12.1.11.2. Products
- 12.1.11.3. Company Financials
- 12.1.11.4. SWOT Analysis
- 12.1.12 Cayman Chemical
- 12.1.12.1. Company Overview
- 12.1.12.2. Products
- 12.1.12.3. Company Financials
- 12.1.12.4. SWOT Analysis
- 12.1.1 Elevance Renewable Sciences Inc
- 12.2. Market Entropy
- 12.2.1 Company's Key Areas Served
- 12.2.2 Recent Developments
- 12.3. Company Market Share Analysis 2025
- 12.3.1 Top 5 Companies Market Share Analysis
- 12.3.2 Top 3 Companies Market Share Analysis
- 12.4. List of Potential Customers
- 13. Research Methodology
List of Figures
- Figure 1: Global Fatty Acid Methyl Ester Industry Revenue Breakdown (billion, %) by Region 2025 & 2033
- Figure 2: Global Fatty Acid Methyl Ester Industry Volume Breakdown (K Tons, %) by Region 2025 & 2033
- Figure 3: Asia Pacific Fatty Acid Methyl Ester Industry Revenue (billion), by Type 2025 & 2033
- Figure 4: Asia Pacific Fatty Acid Methyl Ester Industry Volume (K Tons), by Type 2025 & 2033
- Figure 5: Asia Pacific Fatty Acid Methyl Ester Industry Revenue Share (%), by Type 2025 & 2033
- Figure 6: Asia Pacific Fatty Acid Methyl Ester Industry Volume Share (%), by Type 2025 & 2033
- Figure 7: Asia Pacific Fatty Acid Methyl Ester Industry Revenue (billion), by Application 2025 & 2033
- Figure 8: Asia Pacific Fatty Acid Methyl Ester Industry Volume (K Tons), by Application 2025 & 2033
- Figure 9: Asia Pacific Fatty Acid Methyl Ester Industry Revenue Share (%), by Application 2025 & 2033
- Figure 10: Asia Pacific Fatty Acid Methyl Ester Industry Volume Share (%), by Application 2025 & 2033
- Figure 11: Asia Pacific Fatty Acid Methyl Ester Industry Revenue (billion), by Country 2025 & 2033
- Figure 12: Asia Pacific Fatty Acid Methyl Ester Industry Volume (K Tons), by Country 2025 & 2033
- Figure 13: Asia Pacific Fatty Acid Methyl Ester Industry Revenue Share (%), by Country 2025 & 2033
- Figure 14: Asia Pacific Fatty Acid Methyl Ester Industry Volume Share (%), by Country 2025 & 2033
- Figure 15: North America Fatty Acid Methyl Ester Industry Revenue (billion), by Type 2025 & 2033
- Figure 16: North America Fatty Acid Methyl Ester Industry Volume (K Tons), by Type 2025 & 2033
- Figure 17: North America Fatty Acid Methyl Ester Industry Revenue Share (%), by Type 2025 & 2033
- Figure 18: North America Fatty Acid Methyl Ester Industry Volume Share (%), by Type 2025 & 2033
- Figure 19: North America Fatty Acid Methyl Ester Industry Revenue (billion), by Application 2025 & 2033
- Figure 20: North America Fatty Acid Methyl Ester Industry Volume (K Tons), by Application 2025 & 2033
- Figure 21: North America Fatty Acid Methyl Ester Industry Revenue Share (%), by Application 2025 & 2033
- Figure 22: North America Fatty Acid Methyl Ester Industry Volume Share (%), by Application 2025 & 2033
- Figure 23: North America Fatty Acid Methyl Ester Industry Revenue (billion), by Country 2025 & 2033
- Figure 24: North America Fatty Acid Methyl Ester Industry Volume (K Tons), by Country 2025 & 2033
- Figure 25: North America Fatty Acid Methyl Ester Industry Revenue Share (%), by Country 2025 & 2033
- Figure 26: North America Fatty Acid Methyl Ester Industry Volume Share (%), by Country 2025 & 2033
- Figure 27: Europe Fatty Acid Methyl Ester Industry Revenue (billion), by Type 2025 & 2033
- Figure 28: Europe Fatty Acid Methyl Ester Industry Volume (K Tons), by Type 2025 & 2033
- Figure 29: Europe Fatty Acid Methyl Ester Industry Revenue Share (%), by Type 2025 & 2033
- Figure 30: Europe Fatty Acid Methyl Ester Industry Volume Share (%), by Type 2025 & 2033
- Figure 31: Europe Fatty Acid Methyl Ester Industry Revenue (billion), by Application 2025 & 2033
- Figure 32: Europe Fatty Acid Methyl Ester Industry Volume (K Tons), by Application 2025 & 2033
- Figure 33: Europe Fatty Acid Methyl Ester Industry Revenue Share (%), by Application 2025 & 2033
- Figure 34: Europe Fatty Acid Methyl Ester Industry Volume Share (%), by Application 2025 & 2033
- Figure 35: Europe Fatty Acid Methyl Ester Industry Revenue (billion), by Country 2025 & 2033
- Figure 36: Europe Fatty Acid Methyl Ester Industry Volume (K Tons), by Country 2025 & 2033
- Figure 37: Europe Fatty Acid Methyl Ester Industry Revenue Share (%), by Country 2025 & 2033
- Figure 38: Europe Fatty Acid Methyl Ester Industry Volume Share (%), by Country 2025 & 2033
- Figure 39: South America Fatty Acid Methyl Ester Industry Revenue (billion), by Type 2025 & 2033
- Figure 40: South America Fatty Acid Methyl Ester Industry Volume (K Tons), by Type 2025 & 2033
- Figure 41: South America Fatty Acid Methyl Ester Industry Revenue Share (%), by Type 2025 & 2033
- Figure 42: South America Fatty Acid Methyl Ester Industry Volume Share (%), by Type 2025 & 2033
- Figure 43: South America Fatty Acid Methyl Ester Industry Revenue (billion), by Application 2025 & 2033
- Figure 44: South America Fatty Acid Methyl Ester Industry Volume (K Tons), by Application 2025 & 2033
- Figure 45: South America Fatty Acid Methyl Ester Industry Revenue Share (%), by Application 2025 & 2033
- Figure 46: South America Fatty Acid Methyl Ester Industry Volume Share (%), by Application 2025 & 2033
- Figure 47: South America Fatty Acid Methyl Ester Industry Revenue (billion), by Country 2025 & 2033
- Figure 48: South America Fatty Acid Methyl Ester Industry Volume (K Tons), by Country 2025 & 2033
- Figure 49: South America Fatty Acid Methyl Ester Industry Revenue Share (%), by Country 2025 & 2033
- Figure 50: South America Fatty Acid Methyl Ester Industry Volume Share (%), by Country 2025 & 2033
- Figure 51: Middle East and Africa Fatty Acid Methyl Ester Industry Revenue (billion), by Type 2025 & 2033
- Figure 52: Middle East and Africa Fatty Acid Methyl Ester Industry Volume (K Tons), by Type 2025 & 2033
- Figure 53: Middle East and Africa Fatty Acid Methyl Ester Industry Revenue Share (%), by Type 2025 & 2033
- Figure 54: Middle East and Africa Fatty Acid Methyl Ester Industry Volume Share (%), by Type 2025 & 2033
- Figure 55: Middle East and Africa Fatty Acid Methyl Ester Industry Revenue (billion), by Application 2025 & 2033
- Figure 56: Middle East and Africa Fatty Acid Methyl Ester Industry Volume (K Tons), by Application 2025 & 2033
- Figure 57: Middle East and Africa Fatty Acid Methyl Ester Industry Revenue Share (%), by Application 2025 & 2033
- Figure 58: Middle East and Africa Fatty Acid Methyl Ester Industry Volume Share (%), by Application 2025 & 2033
- Figure 59: Middle East and Africa Fatty Acid Methyl Ester Industry Revenue (billion), by Country 2025 & 2033
- Figure 60: Middle East and Africa Fatty Acid Methyl Ester Industry Volume (K Tons), by Country 2025 & 2033
- Figure 61: Middle East and Africa Fatty Acid Methyl Ester Industry Revenue Share (%), by Country 2025 & 2033
- Figure 62: Middle East and Africa Fatty Acid Methyl Ester Industry Volume Share (%), by Country 2025 & 2033
List of Tables
- Table 1: Global Fatty Acid Methyl Ester Industry Revenue billion Forecast, by Type 2020 & 2033
- Table 2: Global Fatty Acid Methyl Ester Industry Volume K Tons Forecast, by Type 2020 & 2033
- Table 3: Global Fatty Acid Methyl Ester Industry Revenue billion Forecast, by Application 2020 & 2033
- Table 4: Global Fatty Acid Methyl Ester Industry Volume K Tons Forecast, by Application 2020 & 2033
- Table 5: Global Fatty Acid Methyl Ester Industry Revenue billion Forecast, by Region 2020 & 2033
- Table 6: Global Fatty Acid Methyl Ester Industry Volume K Tons Forecast, by Region 2020 & 2033
- Table 7: Global Fatty Acid Methyl Ester Industry Revenue billion Forecast, by Type 2020 & 2033
- Table 8: Global Fatty Acid Methyl Ester Industry Volume K Tons Forecast, by Type 2020 & 2033
- Table 9: Global Fatty Acid Methyl Ester Industry Revenue billion Forecast, by Application 2020 & 2033
- Table 10: Global Fatty Acid Methyl Ester Industry Volume K Tons Forecast, by Application 2020 & 2033
- Table 11: Global Fatty Acid Methyl Ester Industry Revenue billion Forecast, by Country 2020 & 2033
- Table 12: Global Fatty Acid Methyl Ester Industry Volume K Tons Forecast, by Country 2020 & 2033
- Table 13: China Fatty Acid Methyl Ester Industry Revenue (billion) Forecast, by Application 2020 & 2033
- Table 14: China Fatty Acid Methyl Ester Industry Volume (K Tons) Forecast, by Application 2020 & 2033
- Table 15: India Fatty Acid Methyl Ester Industry Revenue (billion) Forecast, by Application 2020 & 2033
- Table 16: India Fatty Acid Methyl Ester Industry Volume (K Tons) Forecast, by Application 2020 & 2033
- Table 17: Japan Fatty Acid Methyl Ester Industry Revenue (billion) Forecast, by Application 2020 & 2033
- Table 18: Japan Fatty Acid Methyl Ester Industry Volume (K Tons) Forecast, by Application 2020 & 2033
- Table 19: South Korea Fatty Acid Methyl Ester Industry Revenue (billion) Forecast, by Application 2020 & 2033
- Table 20: South Korea Fatty Acid Methyl Ester Industry Volume (K Tons) Forecast, by Application 2020 & 2033
- Table 21: Rest of Asia Pacific Fatty Acid Methyl Ester Industry Revenue (billion) Forecast, by Application 2020 & 2033
- Table 22: Rest of Asia Pacific Fatty Acid Methyl Ester Industry Volume (K Tons) Forecast, by Application 2020 & 2033
- Table 23: Global Fatty Acid Methyl Ester Industry Revenue billion Forecast, by Type 2020 & 2033
- Table 24: Global Fatty Acid Methyl Ester Industry Volume K Tons Forecast, by Type 2020 & 2033
- Table 25: Global Fatty Acid Methyl Ester Industry Revenue billion Forecast, by Application 2020 & 2033
- Table 26: Global Fatty Acid Methyl Ester Industry Volume K Tons Forecast, by Application 2020 & 2033
- Table 27: Global Fatty Acid Methyl Ester Industry Revenue billion Forecast, by Country 2020 & 2033
- Table 28: Global Fatty Acid Methyl Ester Industry Volume K Tons Forecast, by Country 2020 & 2033
- Table 29: United States Fatty Acid Methyl Ester Industry Revenue (billion) Forecast, by Application 2020 & 2033
- Table 30: United States Fatty Acid Methyl Ester Industry Volume (K Tons) Forecast, by Application 2020 & 2033
- Table 31: Canada Fatty Acid Methyl Ester Industry Revenue (billion) Forecast, by Application 2020 & 2033
- Table 32: Canada Fatty Acid Methyl Ester Industry Volume (K Tons) Forecast, by Application 2020 & 2033
- Table 33: Mexico Fatty Acid Methyl Ester Industry Revenue (billion) Forecast, by Application 2020 & 2033
- Table 34: Mexico Fatty Acid Methyl Ester Industry Volume (K Tons) Forecast, by Application 2020 & 2033
- Table 35: Global Fatty Acid Methyl Ester Industry Revenue billion Forecast, by Type 2020 & 2033
- Table 36: Global Fatty Acid Methyl Ester Industry Volume K Tons Forecast, by Type 2020 & 2033
- Table 37: Global Fatty Acid Methyl Ester Industry Revenue billion Forecast, by Application 2020 & 2033
- Table 38: Global Fatty Acid Methyl Ester Industry Volume K Tons Forecast, by Application 2020 & 2033
- Table 39: Global Fatty Acid Methyl Ester Industry Revenue billion Forecast, by Country 2020 & 2033
- Table 40: Global Fatty Acid Methyl Ester Industry Volume K Tons Forecast, by Country 2020 & 2033
- Table 41: Germany Fatty Acid Methyl Ester Industry Revenue (billion) Forecast, by Application 2020 & 2033
- Table 42: Germany Fatty Acid Methyl Ester Industry Volume (K Tons) Forecast, by Application 2020 & 2033
- Table 43: United Kingdom Fatty Acid Methyl Ester Industry Revenue (billion) Forecast, by Application 2020 & 2033
- Table 44: United Kingdom Fatty Acid Methyl Ester Industry Volume (K Tons) Forecast, by Application 2020 & 2033
- Table 45: France Fatty Acid Methyl Ester Industry Revenue (billion) Forecast, by Application 2020 & 2033
- Table 46: France Fatty Acid Methyl Ester Industry Volume (K Tons) Forecast, by Application 2020 & 2033
- Table 47: Italy Fatty Acid Methyl Ester Industry Revenue (billion) Forecast, by Application 2020 & 2033
- Table 48: Italy Fatty Acid Methyl Ester Industry Volume (K Tons) Forecast, by Application 2020 & 2033
- Table 49: Rest of Europe Fatty Acid Methyl Ester Industry Revenue (billion) Forecast, by Application 2020 & 2033
- Table 50: Rest of Europe Fatty Acid Methyl Ester Industry Volume (K Tons) Forecast, by Application 2020 & 2033
- Table 51: Global Fatty Acid Methyl Ester Industry Revenue billion Forecast, by Type 2020 & 2033
- Table 52: Global Fatty Acid Methyl Ester Industry Volume K Tons Forecast, by Type 2020 & 2033
- Table 53: Global Fatty Acid Methyl Ester Industry Revenue billion Forecast, by Application 2020 & 2033
- Table 54: Global Fatty Acid Methyl Ester Industry Volume K Tons Forecast, by Application 2020 & 2033
- Table 55: Global Fatty Acid Methyl Ester Industry Revenue billion Forecast, by Country 2020 & 2033
- Table 56: Global Fatty Acid Methyl Ester Industry Volume K Tons Forecast, by Country 2020 & 2033
- Table 57: Brazil Fatty Acid Methyl Ester Industry Revenue (billion) Forecast, by Application 2020 & 2033
- Table 58: Brazil Fatty Acid Methyl Ester Industry Volume (K Tons) Forecast, by Application 2020 & 2033
- Table 59: Argentina Fatty Acid Methyl Ester Industry Revenue (billion) Forecast, by Application 2020 & 2033
- Table 60: Argentina Fatty Acid Methyl Ester Industry Volume (K Tons) Forecast, by Application 2020 & 2033
- Table 61: Rest of South America Fatty Acid Methyl Ester Industry Revenue (billion) Forecast, by Application 2020 & 2033
- Table 62: Rest of South America Fatty Acid Methyl Ester Industry Volume (K Tons) Forecast, by Application 2020 & 2033
- Table 63: Global Fatty Acid Methyl Ester Industry Revenue billion Forecast, by Type 2020 & 2033
- Table 64: Global Fatty Acid Methyl Ester Industry Volume K Tons Forecast, by Type 2020 & 2033
- Table 65: Global Fatty Acid Methyl Ester Industry Revenue billion Forecast, by Application 2020 & 2033
- Table 66: Global Fatty Acid Methyl Ester Industry Volume K Tons Forecast, by Application 2020 & 2033
- Table 67: Global Fatty Acid Methyl Ester Industry Revenue billion Forecast, by Country 2020 & 2033
- Table 68: Global Fatty Acid Methyl Ester Industry Volume K Tons Forecast, by Country 2020 & 2033
- Table 69: Saudi Arabia Fatty Acid Methyl Ester Industry Revenue (billion) Forecast, by Application 2020 & 2033
- Table 70: Saudi Arabia Fatty Acid Methyl Ester Industry Volume (K Tons) Forecast, by Application 2020 & 2033
- Table 71: South Africa Fatty Acid Methyl Ester Industry Revenue (billion) Forecast, by Application 2020 & 2033
- Table 72: South Africa Fatty Acid Methyl Ester Industry Volume (K Tons) Forecast, by Application 2020 & 2033
- Table 73: Rest of Middle East and Africa Fatty Acid Methyl Ester Industry Revenue (billion) Forecast, by Application 2020 & 2033
- Table 74: Rest of Middle East and Africa Fatty Acid Methyl Ester Industry Volume (K Tons) Forecast, by Application 2020 & 2033
Frequently Asked Questions
1. What is the projected Compound Annual Growth Rate (CAGR) of the Fatty Acid Methyl Ester Industry?
The projected CAGR is approximately 5.6%.
2. Which companies are prominent players in the Fatty Acid Methyl Ester Industry?
Key companies in the market include Elevance Renewable Sciences Inc, Arkema, Cargill Incorporated, Merck KGaA, KLK OLEO, Wilmar International Ltd, TCI Chemicals (India) Pvt Ltd, BASF SE, Krishi Oils Limited, Larodan AB (ABITEC), Univar Solutions Inc, Cayman Chemical.
3. What are the main segments of the Fatty Acid Methyl Ester Industry?
The market segments include Type, Application.
4. Can you provide details about the market size?
The market size is estimated to be USD 23.2 billion as of 2022.
5. What are some drivers contributing to market growth?
Growing Production of Biodiesel; Other Drivers.
6. What are the notable trends driving market growth?
The Fuel Sector is Expected to Dominate the Market.
7. Are there any restraints impacting market growth?
High Manufacturing Cost Due to Volatile Raw Material Price; Other Restraints.
8. Can you provide examples of recent developments in the market?
Recent developments will be provided in the complete report.
9. What pricing options are available for accessing the report?
Pricing options include single-user, multi-user, and enterprise licenses priced at USD 4750, USD 5250, and USD 8750 respectively.
10. Is the market size provided in terms of value or volume?
The market size is provided in terms of value, measured in billion and volume, measured in K Tons.
11. Are there any specific market keywords associated with the report?
Yes, the market keyword associated with the report is "Fatty Acid Methyl Ester Industry," which aids in identifying and referencing the specific market segment covered.
12. How do I determine which pricing option suits my needs best?
The pricing options vary based on user requirements and access needs. Individual users may opt for single-user licenses, while businesses requiring broader access may choose multi-user or enterprise licenses for cost-effective access to the report.
13. Are there any additional resources or data provided in the Fatty Acid Methyl Ester Industry report?
While the report offers comprehensive insights, it's advisable to review the specific contents or supplementary materials provided to ascertain if additional resources or data are available.
14. How can I stay updated on further developments or reports in the Fatty Acid Methyl Ester Industry?
To stay informed about further developments, trends, and reports in the Fatty Acid Methyl Ester Industry, consider subscribing to industry newsletters, following relevant companies and organizations, or regularly checking reputable industry news sources and publications.
Methodology
Step 1 - Identification of Relevant Samples Size from Population Database


Step 2 - Approaches for Defining Global Market Size (Value, Volume* & Price*)

Note*: In applicable scenarios
Step 3 - Data Sources
Primary Research
- Web Analytics
- Survey Reports
- Research Institute
- Latest Research Reports
- Opinion Leaders
Secondary Research
- Annual Reports
- White Paper
- Latest Press Release
- Industry Association
- Paid Database
- Investor Presentations

Step 4 - Data Triangulation
Involves using different sources of information in order to increase the validity of a study
These sources are likely to be stakeholders in a program - participants, other researchers, program staff, other community members, and so on.
Then we put all data in single framework & apply various statistical tools to find out the dynamic on the market.
During the analysis stage, feedback from the stakeholder groups would be compared to determine areas of agreement as well as areas of divergence