
Key Insights
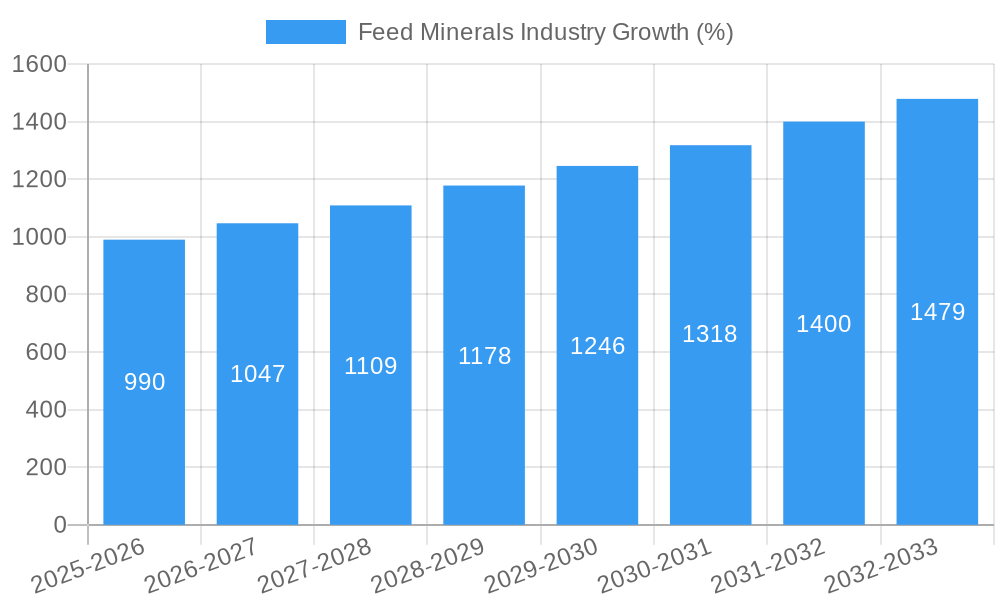
The global feed minerals market is experiencing robust growth, projected to maintain a Compound Annual Growth Rate (CAGR) of 6.40% from 2025 to 2033. This expansion is driven by several key factors. Firstly, the increasing global demand for animal protein, fueled by rising populations and changing dietary habits, necessitates higher feed production. This directly translates into a greater need for essential minerals crucial for animal health, productivity, and overall feed efficiency. Secondly, advancements in animal nutrition understanding and the development of specialized mineral formulations are contributing to market growth. Producers are increasingly adopting precise mineral supplementation strategies to optimize animal health and performance, leading to higher yields and profitability. Furthermore, stringent regulations regarding animal feed quality and safety are driving the adoption of high-quality, traceable mineral sources, boosting the market for premium products. Finally, the growing awareness of the role of minerals in sustainable livestock farming practices is contributing to the market's positive trajectory.
However, the market faces certain challenges. Fluctuations in raw material prices, particularly for essential minerals like zinc and copper, can impact profitability and market stability. Geopolitical factors and supply chain disruptions can also lead to price volatility and limited availability. Additionally, competition from alternative feed additives and the need for continuous innovation to meet evolving consumer demands for sustainably produced animal products pose ongoing challenges for market players. Segmentation analysis reveals that the aquaculture sector is a significant driver, with a high demand for minerals to support efficient fish farming and sustainable aquaculture practices. Similarly, swine and ruminant sectors contribute significantly, with specific mineral requirements tailored to optimize productivity in these segments. Within the sub-additive categories, both macrominerals (e.g., calcium, phosphorus) and microminerals (e.g., zinc, copper, selenium) represent substantial market segments, reflecting the diverse nutritional needs of various animal species. The market is dominated by a number of established players, indicating a competitive landscape characterized by both innovation and consolidation.
Feed Minerals Industry Market Report: 2019-2033
This comprehensive report provides an in-depth analysis of the global feed minerals industry, offering valuable insights for industry professionals, investors, and stakeholders. Covering the period 2019-2033, with a focus on the estimated year 2025, this report unveils market dynamics, growth drivers, challenges, and future opportunities within this crucial sector. The report projects a market size of xx Million by 2033, offering detailed segmentation and competitive landscape analysis.
Feed Minerals Industry Market Structure & Innovation Trends
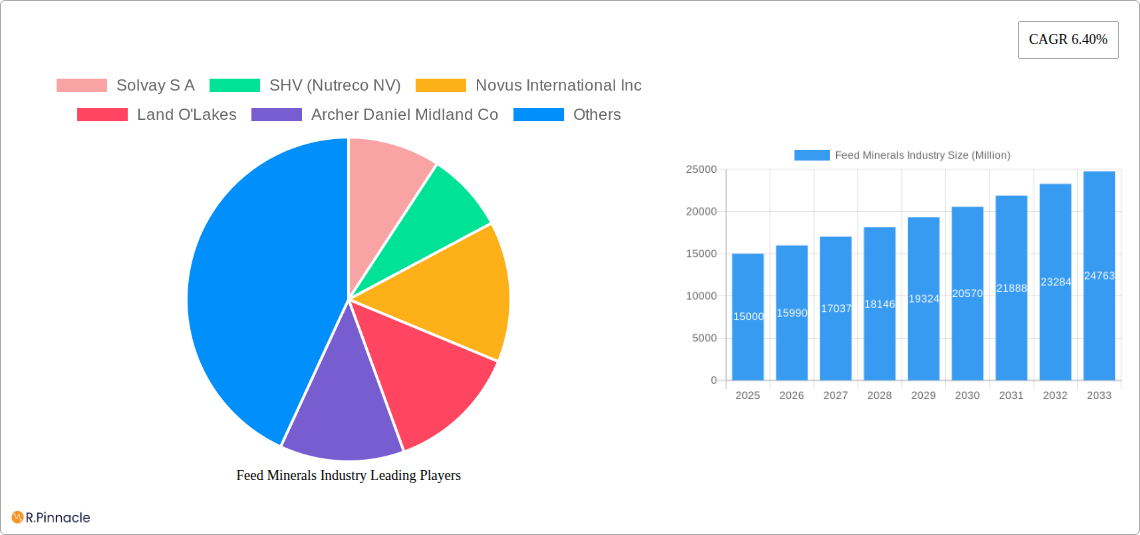
The feed minerals market is characterized by a moderately concentrated structure, with key players like Solvay S.A., SHV (Nutreco NV), Novus International Inc., Land O'Lakes, Archer Daniel Midland Co., BASF SE, Alltech Inc., Cargill Inc., Adisseo, and Yara International AS holding significant market share. Market concentration is further influenced by mergers and acquisitions (M&A) activity, with deals totaling approximately xx Million in the past five years. Innovation drivers include the increasing demand for sustainable and efficient animal feed solutions, stringent regulatory frameworks promoting animal health and welfare, and the growing need for trace minerals in animal diets. Product substitutes, such as organic alternatives and synthetic amino acids, exert competitive pressure. End-user demographics are shifting towards larger-scale, integrated farming operations, influencing market demand and distribution channels.
- Market Share: Cargill and Solvay hold an estimated xx% and xx% market share respectively (2024 data).
- M&A Activity: Significant deals include Novus International's acquisition of Agrivida (2023) valued at xx Million.
- Regulatory Landscape: Regulations regarding mineral content and sustainability are increasingly stringent, driving innovation in feed formulations.
Feed Minerals Industry Market Dynamics & Trends
The feed minerals market is experiencing robust growth, driven by factors such as the rising global population and increasing demand for animal protein. The compound annual growth rate (CAGR) is projected to be xx% during the forecast period (2025-2033). Technological disruptions, such as precision feeding and the use of AI in feed formulation, are optimizing mineral utilization and reducing waste. Consumer preferences for sustainably produced animal products are influencing demand for feed additives derived from renewable sources. Intense competitive dynamics among leading players are driving innovation, mergers, and acquisitions, and price adjustments. Market penetration in emerging economies remains substantial, representing a significant growth opportunity.
Dominant Regions & Segments in Feed Minerals Industry
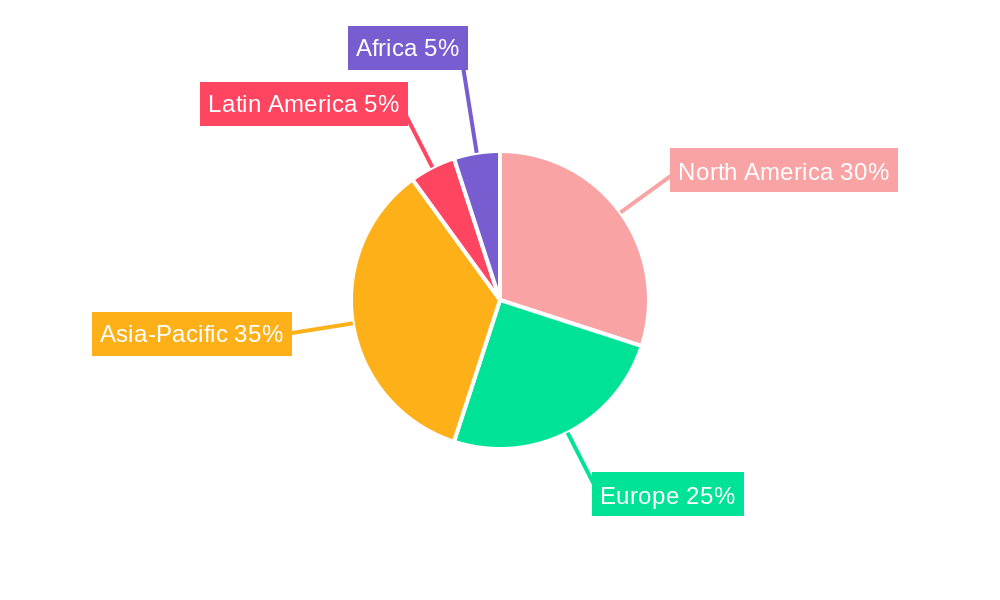
The Asia-Pacific region dominates the feed minerals market, driven by factors like rapid economic growth, increasing livestock production, and high consumption of animal protein. Within the animal feed segment, swine feed demonstrates high growth potential due to rapidly increasing pork consumption in developing nations. Within sub-additives, microminerals currently hold a larger market share owing to their pivotal role in animal health.
- Key Drivers (Asia-Pacific): Rapid economic growth, rising meat consumption, increasing livestock density.
- Key Drivers (Swine Feed Segment): Growing pork demand, intensification of swine farming practices.
- Key Drivers (Microminerals): Essential role in animal health and productivity, increasing awareness of their importance in animal nutrition.
Feed Minerals Industry Product Innovations
Recent product innovations focus on enhanced bioavailability, improved nutrient absorption, and sustainable sourcing of minerals. Companies are developing customized feed mineral blends tailored to specific animal species and dietary needs. Technological advancements include the use of nanotechnology to improve mineral delivery, resulting in optimized feed efficiency and reduced environmental impact. These innovations cater to market demands for higher productivity, improved animal health, and environmentally responsible practices.
Report Scope & Segmentation Analysis
This report segments the feed minerals market based on animal type (Aquaculture, Other Ruminants, Swine, Other Animals) and sub-additive type (Macrominerals, Microminerals). Each segment is analyzed based on its market size, growth rate, and competitive landscape. For example, the aquaculture segment is projected to experience significant growth due to increasing global seafood demand, while the microminerals segment benefits from rising awareness of their importance in animal nutrition. Market sizes and growth projections are detailed for each segment throughout the report.
Key Drivers of Feed Minerals Industry Growth
The growth of the feed minerals industry is propelled by several key factors: increasing global meat consumption driving demand for animal feed; the need for enhanced animal health and productivity leading to the increased use of feed additives; technological advancements in feed formulation, offering improved efficiency and reduced environmental impact. Favorable government policies supporting sustainable animal farming also contribute to market expansion.
Challenges in the Feed Minerals Industry Sector
The feed minerals sector faces challenges such as fluctuating raw material prices impacting profitability; stringent regulatory requirements and compliance costs adding to operational expenses; and intense competition among established players hindering market entry for smaller companies. Supply chain disruptions can also significantly impact production and distribution, leading to shortages and price volatility. These challenges require proactive strategies for cost management, compliance, and supply chain resilience.
Emerging Opportunities in Feed Minerals Industry
Emerging opportunities include the growing demand for organic and sustainably sourced feed minerals; the development of innovative feed additives, like probiotics and prebiotics; the expansion into emerging markets with high growth potential in livestock production. These opportunities present avenues for growth and market diversification.
Leading Players in the Feed Minerals Industry Market
- Solvay S A
- SHV (Nutreco NV)
- Novus International Inc
- Land O'Lakes
- Archer Daniel Midland Co
- BASF SE
- Alltech Inc
- Cargill Inc
- Adisseo
- Yara International AS
Key Developments in Feed Minerals Industry Industry
- July 2022: Cargill extended its partnership with Innovafeed, enhancing aquafarming solutions.
- November 2022: Alltech Inc. established a new organic trace mineral facility in Vietnam (7,000 metric tons annual capacity).
- January 2023: Novus International acquired Agrivida, expanding its feed additive portfolio.
Future Outlook for Feed Minerals Industry Market
The future of the feed minerals market looks promising, driven by sustained global demand for animal protein, technological innovations in feed formulation, and increased focus on animal health and welfare. Strategic partnerships, acquisitions, and investments in research and development will shape future market dynamics. The industry is poised for continued growth, driven by a commitment to sustainability and efficiency in animal feed production.
Feed Minerals Industry Segmentation
-
1. Sub Additive
- 1.1. Macrominerals
- 1.2. Microminerals
-
2. Animal
-
2.1. Aquaculture
-
2.1.1. By Sub Animal
- 2.1.1.1. Fish
- 2.1.1.2. Shrimp
- 2.1.1.3. Other Aquaculture Species
-
2.1.1. By Sub Animal
-
2.2. Poultry
- 2.2.1. Broiler
- 2.2.2. Layer
- 2.2.3. Other Poultry Birds
-
2.3. Ruminants
- 2.3.1. Beef Cattle
- 2.3.2. Dairy Cattle
- 2.3.3. Other Ruminants
- 2.4. Swine
- 2.5. Other Animals
-
2.1. Aquaculture
Feed Minerals Industry Segmentation By Geography
-
1. North America
- 1.1. United States
- 1.2. Canada
- 1.3. Mexico
-
2. South America
- 2.1. Brazil
- 2.2. Argentina
- 2.3. Rest of South America
-
3. Europe
- 3.1. United Kingdom
- 3.2. Germany
- 3.3. France
- 3.4. Italy
- 3.5. Spain
- 3.6. Russia
- 3.7. Benelux
- 3.8. Nordics
- 3.9. Rest of Europe
-
4. Middle East & Africa
- 4.1. Turkey
- 4.2. Israel
- 4.3. GCC
- 4.4. North Africa
- 4.5. South Africa
- 4.6. Rest of Middle East & Africa
-
5. Asia Pacific
- 5.1. China
- 5.2. India
- 5.3. Japan
- 5.4. South Korea
- 5.5. ASEAN
- 5.6. Oceania
- 5.7. Rest of Asia Pacific
Feed Minerals Industry REPORT HIGHLIGHTS
| Aspects | Details |
|---|---|
| Study Period | 2019-2033 |
| Base Year | 2024 |
| Estimated Year | 2025 |
| Forecast Period | 2025-2033 |
| Historical Period | 2019-2024 |
| Growth Rate | CAGR of 6.40% from 2019-2033 |
| Segmentation |
|
Table of Contents
- 1. Introduction
- 1.1. Research Scope
- 1.2. Market Segmentation
- 1.3. Research Methodology
- 1.4. Definitions and Assumptions
- 2. Executive Summary
- 2.1. Introduction
- 3. Market Dynamics
- 3.1. Introduction
- 3.2. Market Drivers
- 3.2.1. Growing Livestock Population; Area Under Forage Production is Increasing; Increasing Demand for Animal Products
- 3.3. Market Restrains
- 3.3.1. Competition Amongst Industries and High Input Prices; Growing Shift Toward Vegan-Based Diet
- 3.4. Market Trends
- 3.4.1. OTHER KEY INDUSTRY TRENDS COVERED IN THE REPORT
- 4. Market Factor Analysis
- 4.1. Porters Five Forces
- 4.2. Supply/Value Chain
- 4.3. PESTEL analysis
- 4.4. Market Entropy
- 4.5. Patent/Trademark Analysis
- 5. Global Feed Minerals Industry Analysis, Insights and Forecast, 2019-2031
- 5.1. Market Analysis, Insights and Forecast - by Sub Additive
- 5.1.1. Macrominerals
- 5.1.2. Microminerals
- 5.2. Market Analysis, Insights and Forecast - by Animal
- 5.2.1. Aquaculture
- 5.2.1.1. By Sub Animal
- 5.2.1.1.1. Fish
- 5.2.1.1.2. Shrimp
- 5.2.1.1.3. Other Aquaculture Species
- 5.2.1.1. By Sub Animal
- 5.2.2. Poultry
- 5.2.2.1. Broiler
- 5.2.2.2. Layer
- 5.2.2.3. Other Poultry Birds
- 5.2.3. Ruminants
- 5.2.3.1. Beef Cattle
- 5.2.3.2. Dairy Cattle
- 5.2.3.3. Other Ruminants
- 5.2.4. Swine
- 5.2.5. Other Animals
- 5.2.1. Aquaculture
- 5.3. Market Analysis, Insights and Forecast - by Region
- 5.3.1. North America
- 5.3.2. South America
- 5.3.3. Europe
- 5.3.4. Middle East & Africa
- 5.3.5. Asia Pacific
- 5.1. Market Analysis, Insights and Forecast - by Sub Additive
- 6. North America Feed Minerals Industry Analysis, Insights and Forecast, 2019-2031
- 6.1. Market Analysis, Insights and Forecast - by Sub Additive
- 6.1.1. Macrominerals
- 6.1.2. Microminerals
- 6.2. Market Analysis, Insights and Forecast - by Animal
- 6.2.1. Aquaculture
- 6.2.1.1. By Sub Animal
- 6.2.1.1.1. Fish
- 6.2.1.1.2. Shrimp
- 6.2.1.1.3. Other Aquaculture Species
- 6.2.1.1. By Sub Animal
- 6.2.2. Poultry
- 6.2.2.1. Broiler
- 6.2.2.2. Layer
- 6.2.2.3. Other Poultry Birds
- 6.2.3. Ruminants
- 6.2.3.1. Beef Cattle
- 6.2.3.2. Dairy Cattle
- 6.2.3.3. Other Ruminants
- 6.2.4. Swine
- 6.2.5. Other Animals
- 6.2.1. Aquaculture
- 6.1. Market Analysis, Insights and Forecast - by Sub Additive
- 7. South America Feed Minerals Industry Analysis, Insights and Forecast, 2019-2031
- 7.1. Market Analysis, Insights and Forecast - by Sub Additive
- 7.1.1. Macrominerals
- 7.1.2. Microminerals
- 7.2. Market Analysis, Insights and Forecast - by Animal
- 7.2.1. Aquaculture
- 7.2.1.1. By Sub Animal
- 7.2.1.1.1. Fish
- 7.2.1.1.2. Shrimp
- 7.2.1.1.3. Other Aquaculture Species
- 7.2.1.1. By Sub Animal
- 7.2.2. Poultry
- 7.2.2.1. Broiler
- 7.2.2.2. Layer
- 7.2.2.3. Other Poultry Birds
- 7.2.3. Ruminants
- 7.2.3.1. Beef Cattle
- 7.2.3.2. Dairy Cattle
- 7.2.3.3. Other Ruminants
- 7.2.4. Swine
- 7.2.5. Other Animals
- 7.2.1. Aquaculture
- 7.1. Market Analysis, Insights and Forecast - by Sub Additive
- 8. Europe Feed Minerals Industry Analysis, Insights and Forecast, 2019-2031
- 8.1. Market Analysis, Insights and Forecast - by Sub Additive
- 8.1.1. Macrominerals
- 8.1.2. Microminerals
- 8.2. Market Analysis, Insights and Forecast - by Animal
- 8.2.1. Aquaculture
- 8.2.1.1. By Sub Animal
- 8.2.1.1.1. Fish
- 8.2.1.1.2. Shrimp
- 8.2.1.1.3. Other Aquaculture Species
- 8.2.1.1. By Sub Animal
- 8.2.2. Poultry
- 8.2.2.1. Broiler
- 8.2.2.2. Layer
- 8.2.2.3. Other Poultry Birds
- 8.2.3. Ruminants
- 8.2.3.1. Beef Cattle
- 8.2.3.2. Dairy Cattle
- 8.2.3.3. Other Ruminants
- 8.2.4. Swine
- 8.2.5. Other Animals
- 8.2.1. Aquaculture
- 8.1. Market Analysis, Insights and Forecast - by Sub Additive
- 9. Middle East & Africa Feed Minerals Industry Analysis, Insights and Forecast, 2019-2031
- 9.1. Market Analysis, Insights and Forecast - by Sub Additive
- 9.1.1. Macrominerals
- 9.1.2. Microminerals
- 9.2. Market Analysis, Insights and Forecast - by Animal
- 9.2.1. Aquaculture
- 9.2.1.1. By Sub Animal
- 9.2.1.1.1. Fish
- 9.2.1.1.2. Shrimp
- 9.2.1.1.3. Other Aquaculture Species
- 9.2.1.1. By Sub Animal
- 9.2.2. Poultry
- 9.2.2.1. Broiler
- 9.2.2.2. Layer
- 9.2.2.3. Other Poultry Birds
- 9.2.3. Ruminants
- 9.2.3.1. Beef Cattle
- 9.2.3.2. Dairy Cattle
- 9.2.3.3. Other Ruminants
- 9.2.4. Swine
- 9.2.5. Other Animals
- 9.2.1. Aquaculture
- 9.1. Market Analysis, Insights and Forecast - by Sub Additive
- 10. Asia Pacific Feed Minerals Industry Analysis, Insights and Forecast, 2019-2031
- 10.1. Market Analysis, Insights and Forecast - by Sub Additive
- 10.1.1. Macrominerals
- 10.1.2. Microminerals
- 10.2. Market Analysis, Insights and Forecast - by Animal
- 10.2.1. Aquaculture
- 10.2.1.1. By Sub Animal
- 10.2.1.1.1. Fish
- 10.2.1.1.2. Shrimp
- 10.2.1.1.3. Other Aquaculture Species
- 10.2.1.1. By Sub Animal
- 10.2.2. Poultry
- 10.2.2.1. Broiler
- 10.2.2.2. Layer
- 10.2.2.3. Other Poultry Birds
- 10.2.3. Ruminants
- 10.2.3.1. Beef Cattle
- 10.2.3.2. Dairy Cattle
- 10.2.3.3. Other Ruminants
- 10.2.4. Swine
- 10.2.5. Other Animals
- 10.2.1. Aquaculture
- 10.1. Market Analysis, Insights and Forecast - by Sub Additive
- 11. Competitive Analysis
- 11.1. Global Market Share Analysis 2024
- 11.2. Company Profiles
- 11.2.1 Solvay S A
- 11.2.1.1. Overview
- 11.2.1.2. Products
- 11.2.1.3. SWOT Analysis
- 11.2.1.4. Recent Developments
- 11.2.1.5. Financials (Based on Availability)
- 11.2.2 SHV (Nutreco NV)
- 11.2.2.1. Overview
- 11.2.2.2. Products
- 11.2.2.3. SWOT Analysis
- 11.2.2.4. Recent Developments
- 11.2.2.5. Financials (Based on Availability)
- 11.2.3 Novus International Inc
- 11.2.3.1. Overview
- 11.2.3.2. Products
- 11.2.3.3. SWOT Analysis
- 11.2.3.4. Recent Developments
- 11.2.3.5. Financials (Based on Availability)
- 11.2.4 Land O'Lakes
- 11.2.4.1. Overview
- 11.2.4.2. Products
- 11.2.4.3. SWOT Analysis
- 11.2.4.4. Recent Developments
- 11.2.4.5. Financials (Based on Availability)
- 11.2.5 Archer Daniel Midland Co
- 11.2.5.1. Overview
- 11.2.5.2. Products
- 11.2.5.3. SWOT Analysis
- 11.2.5.4. Recent Developments
- 11.2.5.5. Financials (Based on Availability)
- 11.2.6 BASF SE
- 11.2.6.1. Overview
- 11.2.6.2. Products
- 11.2.6.3. SWOT Analysis
- 11.2.6.4. Recent Developments
- 11.2.6.5. Financials (Based on Availability)
- 11.2.7 Alltech Inc
- 11.2.7.1. Overview
- 11.2.7.2. Products
- 11.2.7.3. SWOT Analysis
- 11.2.7.4. Recent Developments
- 11.2.7.5. Financials (Based on Availability)
- 11.2.8 Cargill Inc
- 11.2.8.1. Overview
- 11.2.8.2. Products
- 11.2.8.3. SWOT Analysis
- 11.2.8.4. Recent Developments
- 11.2.8.5. Financials (Based on Availability)
- 11.2.9 Adisseo
- 11.2.9.1. Overview
- 11.2.9.2. Products
- 11.2.9.3. SWOT Analysis
- 11.2.9.4. Recent Developments
- 11.2.9.5. Financials (Based on Availability)
- 11.2.10 Yara International AS
- 11.2.10.1. Overview
- 11.2.10.2. Products
- 11.2.10.3. SWOT Analysis
- 11.2.10.4. Recent Developments
- 11.2.10.5. Financials (Based on Availability)
- 11.2.1 Solvay S A
List of Figures
- Figure 1: Global Feed Minerals Industry Revenue Breakdown (Million, %) by Region 2024 & 2032
- Figure 2: North America Feed Minerals Industry Revenue (Million), by Sub Additive 2024 & 2032
- Figure 3: North America Feed Minerals Industry Revenue Share (%), by Sub Additive 2024 & 2032
- Figure 4: North America Feed Minerals Industry Revenue (Million), by Animal 2024 & 2032
- Figure 5: North America Feed Minerals Industry Revenue Share (%), by Animal 2024 & 2032
- Figure 6: North America Feed Minerals Industry Revenue (Million), by Country 2024 & 2032
- Figure 7: North America Feed Minerals Industry Revenue Share (%), by Country 2024 & 2032
- Figure 8: South America Feed Minerals Industry Revenue (Million), by Sub Additive 2024 & 2032
- Figure 9: South America Feed Minerals Industry Revenue Share (%), by Sub Additive 2024 & 2032
- Figure 10: South America Feed Minerals Industry Revenue (Million), by Animal 2024 & 2032
- Figure 11: South America Feed Minerals Industry Revenue Share (%), by Animal 2024 & 2032
- Figure 12: South America Feed Minerals Industry Revenue (Million), by Country 2024 & 2032
- Figure 13: South America Feed Minerals Industry Revenue Share (%), by Country 2024 & 2032
- Figure 14: Europe Feed Minerals Industry Revenue (Million), by Sub Additive 2024 & 2032
- Figure 15: Europe Feed Minerals Industry Revenue Share (%), by Sub Additive 2024 & 2032
- Figure 16: Europe Feed Minerals Industry Revenue (Million), by Animal 2024 & 2032
- Figure 17: Europe Feed Minerals Industry Revenue Share (%), by Animal 2024 & 2032
- Figure 18: Europe Feed Minerals Industry Revenue (Million), by Country 2024 & 2032
- Figure 19: Europe Feed Minerals Industry Revenue Share (%), by Country 2024 & 2032
- Figure 20: Middle East & Africa Feed Minerals Industry Revenue (Million), by Sub Additive 2024 & 2032
- Figure 21: Middle East & Africa Feed Minerals Industry Revenue Share (%), by Sub Additive 2024 & 2032
- Figure 22: Middle East & Africa Feed Minerals Industry Revenue (Million), by Animal 2024 & 2032
- Figure 23: Middle East & Africa Feed Minerals Industry Revenue Share (%), by Animal 2024 & 2032
- Figure 24: Middle East & Africa Feed Minerals Industry Revenue (Million), by Country 2024 & 2032
- Figure 25: Middle East & Africa Feed Minerals Industry Revenue Share (%), by Country 2024 & 2032
- Figure 26: Asia Pacific Feed Minerals Industry Revenue (Million), by Sub Additive 2024 & 2032
- Figure 27: Asia Pacific Feed Minerals Industry Revenue Share (%), by Sub Additive 2024 & 2032
- Figure 28: Asia Pacific Feed Minerals Industry Revenue (Million), by Animal 2024 & 2032
- Figure 29: Asia Pacific Feed Minerals Industry Revenue Share (%), by Animal 2024 & 2032
- Figure 30: Asia Pacific Feed Minerals Industry Revenue (Million), by Country 2024 & 2032
- Figure 31: Asia Pacific Feed Minerals Industry Revenue Share (%), by Country 2024 & 2032
List of Tables
- Table 1: Global Feed Minerals Industry Revenue Million Forecast, by Region 2019 & 2032
- Table 2: Global Feed Minerals Industry Revenue Million Forecast, by Sub Additive 2019 & 2032
- Table 3: Global Feed Minerals Industry Revenue Million Forecast, by Animal 2019 & 2032
- Table 4: Global Feed Minerals Industry Revenue Million Forecast, by Region 2019 & 2032
- Table 5: Global Feed Minerals Industry Revenue Million Forecast, by Sub Additive 2019 & 2032
- Table 6: Global Feed Minerals Industry Revenue Million Forecast, by Animal 2019 & 2032
- Table 7: Global Feed Minerals Industry Revenue Million Forecast, by Country 2019 & 2032
- Table 8: United States Feed Minerals Industry Revenue (Million) Forecast, by Application 2019 & 2032
- Table 9: Canada Feed Minerals Industry Revenue (Million) Forecast, by Application 2019 & 2032
- Table 10: Mexico Feed Minerals Industry Revenue (Million) Forecast, by Application 2019 & 2032
- Table 11: Global Feed Minerals Industry Revenue Million Forecast, by Sub Additive 2019 & 2032
- Table 12: Global Feed Minerals Industry Revenue Million Forecast, by Animal 2019 & 2032
- Table 13: Global Feed Minerals Industry Revenue Million Forecast, by Country 2019 & 2032
- Table 14: Brazil Feed Minerals Industry Revenue (Million) Forecast, by Application 2019 & 2032
- Table 15: Argentina Feed Minerals Industry Revenue (Million) Forecast, by Application 2019 & 2032
- Table 16: Rest of South America Feed Minerals Industry Revenue (Million) Forecast, by Application 2019 & 2032
- Table 17: Global Feed Minerals Industry Revenue Million Forecast, by Sub Additive 2019 & 2032
- Table 18: Global Feed Minerals Industry Revenue Million Forecast, by Animal 2019 & 2032
- Table 19: Global Feed Minerals Industry Revenue Million Forecast, by Country 2019 & 2032
- Table 20: United Kingdom Feed Minerals Industry Revenue (Million) Forecast, by Application 2019 & 2032
- Table 21: Germany Feed Minerals Industry Revenue (Million) Forecast, by Application 2019 & 2032
- Table 22: France Feed Minerals Industry Revenue (Million) Forecast, by Application 2019 & 2032
- Table 23: Italy Feed Minerals Industry Revenue (Million) Forecast, by Application 2019 & 2032
- Table 24: Spain Feed Minerals Industry Revenue (Million) Forecast, by Application 2019 & 2032
- Table 25: Russia Feed Minerals Industry Revenue (Million) Forecast, by Application 2019 & 2032
- Table 26: Benelux Feed Minerals Industry Revenue (Million) Forecast, by Application 2019 & 2032
- Table 27: Nordics Feed Minerals Industry Revenue (Million) Forecast, by Application 2019 & 2032
- Table 28: Rest of Europe Feed Minerals Industry Revenue (Million) Forecast, by Application 2019 & 2032
- Table 29: Global Feed Minerals Industry Revenue Million Forecast, by Sub Additive 2019 & 2032
- Table 30: Global Feed Minerals Industry Revenue Million Forecast, by Animal 2019 & 2032
- Table 31: Global Feed Minerals Industry Revenue Million Forecast, by Country 2019 & 2032
- Table 32: Turkey Feed Minerals Industry Revenue (Million) Forecast, by Application 2019 & 2032
- Table 33: Israel Feed Minerals Industry Revenue (Million) Forecast, by Application 2019 & 2032
- Table 34: GCC Feed Minerals Industry Revenue (Million) Forecast, by Application 2019 & 2032
- Table 35: North Africa Feed Minerals Industry Revenue (Million) Forecast, by Application 2019 & 2032
- Table 36: South Africa Feed Minerals Industry Revenue (Million) Forecast, by Application 2019 & 2032
- Table 37: Rest of Middle East & Africa Feed Minerals Industry Revenue (Million) Forecast, by Application 2019 & 2032
- Table 38: Global Feed Minerals Industry Revenue Million Forecast, by Sub Additive 2019 & 2032
- Table 39: Global Feed Minerals Industry Revenue Million Forecast, by Animal 2019 & 2032
- Table 40: Global Feed Minerals Industry Revenue Million Forecast, by Country 2019 & 2032
- Table 41: China Feed Minerals Industry Revenue (Million) Forecast, by Application 2019 & 2032
- Table 42: India Feed Minerals Industry Revenue (Million) Forecast, by Application 2019 & 2032
- Table 43: Japan Feed Minerals Industry Revenue (Million) Forecast, by Application 2019 & 2032
- Table 44: South Korea Feed Minerals Industry Revenue (Million) Forecast, by Application 2019 & 2032
- Table 45: ASEAN Feed Minerals Industry Revenue (Million) Forecast, by Application 2019 & 2032
- Table 46: Oceania Feed Minerals Industry Revenue (Million) Forecast, by Application 2019 & 2032
- Table 47: Rest of Asia Pacific Feed Minerals Industry Revenue (Million) Forecast, by Application 2019 & 2032
Frequently Asked Questions
1. What is the projected Compound Annual Growth Rate (CAGR) of the Feed Minerals Industry?
The projected CAGR is approximately 6.40%.
2. Which companies are prominent players in the Feed Minerals Industry?
Key companies in the market include Solvay S A, SHV (Nutreco NV), Novus International Inc, Land O'Lakes, Archer Daniel Midland Co, BASF SE, Alltech Inc, Cargill Inc, Adisseo, Yara International AS.
3. What are the main segments of the Feed Minerals Industry?
The market segments include Sub Additive, Animal.
4. Can you provide details about the market size?
The market size is estimated to be USD XX Million as of 2022.
5. What are some drivers contributing to market growth?
Growing Livestock Population; Area Under Forage Production is Increasing; Increasing Demand for Animal Products.
6. What are the notable trends driving market growth?
OTHER KEY INDUSTRY TRENDS COVERED IN THE REPORT.
7. Are there any restraints impacting market growth?
Competition Amongst Industries and High Input Prices; Growing Shift Toward Vegan-Based Diet.
8. Can you provide examples of recent developments in the market?
January 2023: Novus International acquired the Biotech company Agrivida to develop new feed additives.November 2022: Alltech Inc. has established new manufacturing for organic trace minerals in Vietnam with a manufacturing facility with an annual capacity of about 7,000 metric tons.July 2022: Cargill has extended its partnership with Innovafeed to provide aquafarmers with innovative and nutritious ingredients, including additives.
9. What pricing options are available for accessing the report?
Pricing options include single-user, multi-user, and enterprise licenses priced at USD 3800, USD 4500, and USD 5800 respectively.
10. Is the market size provided in terms of value or volume?
The market size is provided in terms of value, measured in Million.
11. Are there any specific market keywords associated with the report?
Yes, the market keyword associated with the report is "Feed Minerals Industry," which aids in identifying and referencing the specific market segment covered.
12. How do I determine which pricing option suits my needs best?
The pricing options vary based on user requirements and access needs. Individual users may opt for single-user licenses, while businesses requiring broader access may choose multi-user or enterprise licenses for cost-effective access to the report.
13. Are there any additional resources or data provided in the Feed Minerals Industry report?
While the report offers comprehensive insights, it's advisable to review the specific contents or supplementary materials provided to ascertain if additional resources or data are available.
14. How can I stay updated on further developments or reports in the Feed Minerals Industry?
To stay informed about further developments, trends, and reports in the Feed Minerals Industry, consider subscribing to industry newsletters, following relevant companies and organizations, or regularly checking reputable industry news sources and publications.
Methodology
Step 1 - Identification of Relevant Samples Size from Population Database


Step 2 - Approaches for Defining Global Market Size (Value, Volume* & Price*)

Note*: In applicable scenarios
Step 3 - Data Sources
Primary Research
- Web Analytics
- Survey Reports
- Research Institute
- Latest Research Reports
- Opinion Leaders
Secondary Research
- Annual Reports
- White Paper
- Latest Press Release
- Industry Association
- Paid Database
- Investor Presentations

Step 4 - Data Triangulation
Involves using different sources of information in order to increase the validity of a study
These sources are likely to be stakeholders in a program - participants, other researchers, program staff, other community members, and so on.
Then we put all data in single framework & apply various statistical tools to find out the dynamic on the market.
During the analysis stage, feedback from the stakeholder groups would be compared to determine areas of agreement as well as areas of divergence


