

Key Insights
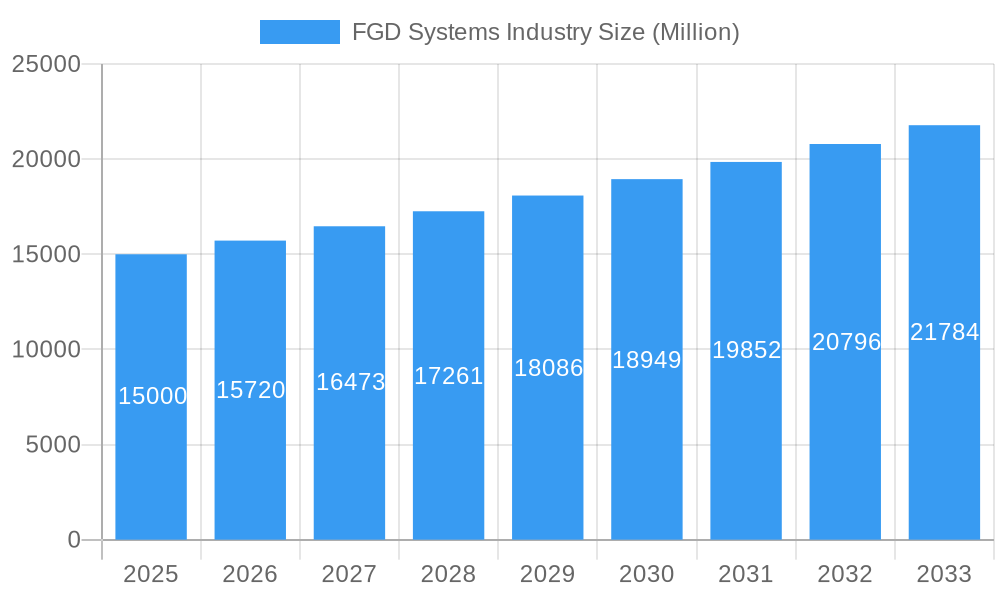
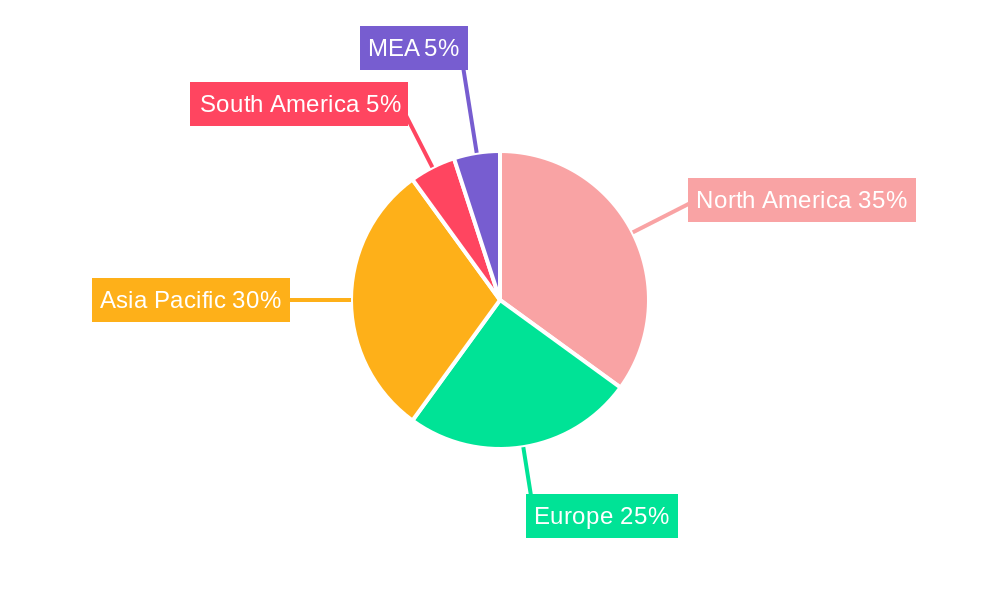
The Flue Gas Desulfurization (FGD) Systems market is poised for substantial growth, driven by stringent environmental regulations focused on reducing sulfur dioxide (SO2) emissions across key industrial sectors including power generation, cement, and chemicals. With a projected Compound Annual Growth Rate (CAGR) of 13.06%, the market is anticipated to reach a significant size of 9.55 billion by 2025. This expansion is underpinned by escalating global energy demands, necessitating increased power generation capacity and, consequently, a greater reliance on effective SO2 emission control technologies. The rising adoption of cleaner energy sources and heightened environmental consciousness are further accelerating market development. Wet FGD systems currently lead the market due to their proven efficacy in pollutant removal. However, Dry FGD systems are gaining prominence, particularly in water-scarce regions, owing to their reduced water consumption and operational efficiencies. North America and Asia Pacific are key markets, fueled by extensive power generation infrastructure and robust environmental policies. Emerging economies in South America and the Middle East & Africa present considerable growth potential as industrialization progresses and emission control standards are adopted. Leading industry players are committed to innovation, focusing on enhancing FGD system efficiency, lowering operational costs, and developing sustainable solutions, thereby driving continuous market evolution.
FGD Systems Industry Market Size (In Billion)
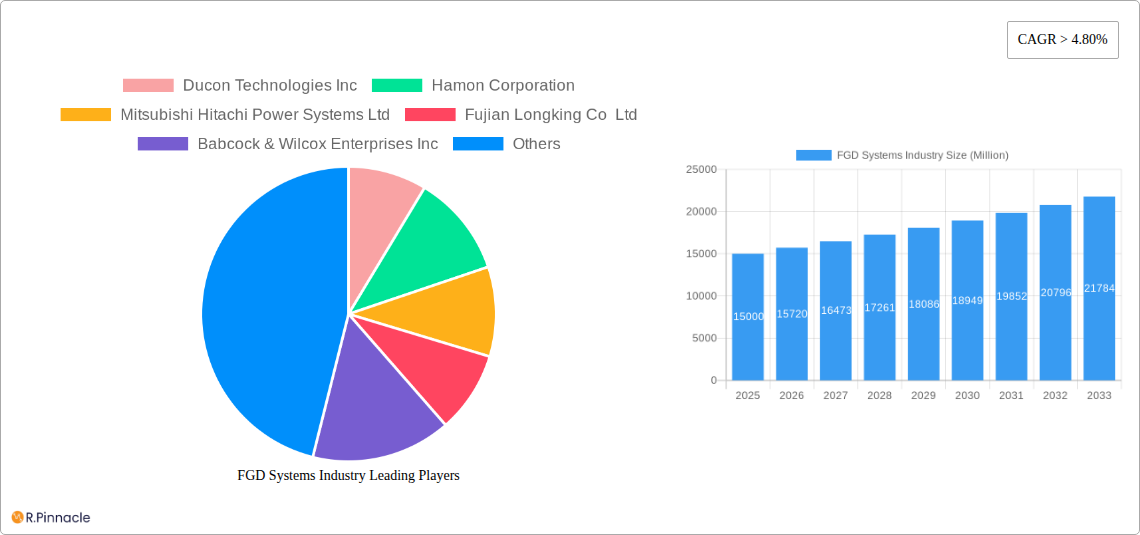
The competitive environment features established companies such as Ducon Technologies Inc., Hamon Corporation, and Mitsubishi Hitachi Power Systems Ltd., actively pursuing strategic alliances and technological advancements to secure market positions. The market is segmented by FGD type, including Wet and Dry, and by end-user industry, with the power generation sector representing the largest segment. Future growth will be shaped by advancements in Dry FGD technologies, the enforcement of stricter regulations in developing economies, and the ongoing transition to cleaner energy alternatives. The integration of AI and machine learning for optimizing FGD system performance is an emerging trend expected to significantly influence the market's future trajectory. While initial investment costs and operational complexities may pose challenges, the long-term environmental advantages and regulatory mandates will continue to propel significant market expansion.
FGD Systems Industry Company Market Share
FGD Systems Industry Report 2019-2033: A Comprehensive Market Analysis
This comprehensive report from FGD Systems Industry provides a detailed analysis of the global FGD Systems market, offering invaluable insights for industry professionals, investors, and strategic decision-makers. The report covers the period 2019-2033, with a focus on the forecast period 2025-2033 and a base year of 2025. The market is valued at $XX Million in 2025 and is projected to reach $XX Million by 2033, exhibiting a CAGR of XX%.
FGD Systems Industry Market Structure & Innovation Trends
This section analyzes the competitive landscape of the FGD Systems market, examining market concentration, innovation drivers, and regulatory frameworks. The report delves into product substitutes and their impact, end-user demographics, and significant M&A activities.
- Market Concentration: The FGD Systems market is characterized by a moderately concentrated structure, with key players holding a combined market share of approximately XX%. This concentration is expected to slightly increase by 2033.
- Innovation Drivers: Stringent environmental regulations, the increasing demand for cleaner energy, and advancements in FGD technology are key drivers of innovation.
- Regulatory Frameworks: Government regulations concerning emissions standards significantly influence the FGD Systems market. Compliance requirements drive adoption and shape technological advancements.
- Product Substitutes: While few direct substitutes exist, alternative emission control technologies are influencing market dynamics and competitiveness.
- M&A Activities: Significant mergers and acquisitions (M&A) have occurred in the past five years, totaling approximately $XX Million in deal value. These activities have reshaped the competitive landscape and accelerated innovation.
FGD Systems Industry Market Dynamics & Trends
This section provides a deep dive into market growth drivers, technological disruptions, evolving consumer preferences, and competitive dynamics. The report analyzes the impact of these factors on market expansion and future projections. Specific metrics, including the Compound Annual Growth Rate (CAGR) and market penetration rates, are presented.
[Detailed analysis of market growth drivers, technological disruptions, consumer preferences, and competitive dynamics will be provided in the full report, including specific CAGR and market penetration data.]
Dominant Regions & Segments in FGD Systems Industry
This section identifies the leading regions and segments within the FGD Systems market, providing a comprehensive analysis of their dominance. Key drivers influencing regional and segmental growth are highlighted.
Leading Region: [Analysis of leading region (e.g., Asia-Pacific) and reasons for dominance (e.g., high power generation capacity, rapid industrialization)]
Leading Segments:
- Type: Wet FGD is currently the dominant segment, driven by its established technology and widespread adoption. However, Dry FGD is experiencing significant growth due to its cost-effectiveness.
- End-User Industry: The power generation sector remains the largest end-user, driven by increasing demand for electricity and stricter emission regulations. However, the cement, chemical, and iron & steel industries also represent significant market segments.
[Detailed analysis of each segment and contributing factors will be provided in the full report, including economic policies, infrastructure development, and other relevant factors.]
FGD Systems Industry Product Innovations
Recent years have witnessed significant advancements in FGD technology, including improvements in efficiency, reduced operating costs, and enhanced environmental performance. These innovations are driving market growth and creating new opportunities for existing and emerging players.
[Detailed discussion of specific product developments and their competitive advantages will be provided in the full report.]
Report Scope & Segmentation Analysis
This report provides a comprehensive segmentation of the FGD Systems market based on type (Dry FGD, Wet FGD) and end-user industry (Power Generation, Cement, Chemical, Iron and Steel, Other End-User Industries). Each segment is analyzed in detail, with growth projections, market size estimations, and competitive dynamics discussed.
[Detailed analysis of each segment, including growth projections, market size, and competitive landscape will be included in the full report.]
Key Drivers of FGD Systems Industry Growth
Several factors drive the growth of the FGD Systems market, including stringent environmental regulations, expanding industrialization, rising energy demand, and technological advancements. These drivers are further analyzed in the complete report.
[Detailed explanation of key growth drivers will be provided in the full report.]
Challenges in the FGD Systems Industry Sector
Despite the positive growth outlook, the FGD Systems market faces certain challenges, including the high initial investment costs, complex installation procedures, and stringent regulatory compliance requirements. These aspects can hinder market penetration and create barriers to entry.
[Detailed explanation of challenges will be provided in the full report.]
Emerging Opportunities in FGD Systems Industry
The FGD Systems market presents several emerging opportunities, including the growing adoption of advanced technologies, the expansion into new markets, and the increasing demand for environmentally friendly solutions. Further exploration of these opportunities is provided in the full report.
[Detailed explanation of emerging opportunities will be provided in the full report.]
Leading Players in the FGD Systems Industry Market
The FGD Systems market is dominated by several key players:
- Ducon Technologies Inc
- Hamon Corporation
- Mitsubishi Hitachi Power Systems Ltd
- Fujian Longking Co Ltd
- Babcock & Wilcox Enterprises Inc
- Thermax Ltd
- John Wood Group PLC
- Alstom S A
- General Electric Company
- Andritz AG
Key Developments in FGD Systems Industry Industry
[A detailed list of key developments, including product launches, mergers, and acquisitions with specific dates, will be provided in the full report.]
Future Outlook for FGD Systems Industry Market
The FGD Systems market is poised for continued growth, driven by increasing environmental concerns, expanding industrial activities, and technological advancements. This positive outlook presents numerous strategic opportunities for companies operating in this sector.
[Detailed discussion of the future outlook and strategic opportunities will be provided in the full report.]
FGD Systems Industry Segmentation
-
1. Type
- 1.1. Dry FGD
- 1.2. Wet FGD
-
2. End-User Industry
- 2.1. Power Generation
- 2.2. Cement
- 2.3. Chemical
- 2.4. Iron and Steel
- 2.5. Other End-User Industries
FGD Systems Industry Segmentation By Geography
- 1. North America
- 2. Europe
- 3. Asia Pacific
- 4. South America
- 5. Middle East and Africa
FGD Systems Industry Regional Market Share
Geographic Coverage of FGD Systems Industry
FGD Systems Industry REPORT HIGHLIGHTS
| Aspects | Details |
|---|---|
| Study Period | 2020-2034 |
| Base Year | 2025 |
| Estimated Year | 2026 |
| Forecast Period | 2026-2034 |
| Historical Period | 2020-2025 |
| Growth Rate | CAGR of 13.06% from 2020-2034 |
| Segmentation |
|
Table of Contents
- 1. Introduction
- 1.1. Research Scope
- 1.2. Market Segmentation
- 1.3. Research Objective
- 1.4. Definitions and Assumptions
- 2. Executive Summary
- 2.1. Market Snapshot
- 3. Market Dynamics
- 3.1. Market Drivers
- 3.2. Market Restrains
- 3.3. Market Trends
- 3.4. Market Opportunities
- 4. Market Factor Analysis
- 4.1. Porters Five Forces
- 4.1.1. Bargaining Power of Suppliers
- 4.1.2. Bargaining Power of Buyers
- 4.1.3. Threat of New Entrants
- 4.1.4. Threat of Substitutes
- 4.1.5. Competitive Rivalry
- 4.2. PESTEL analysis
- 4.3. BCG Analysis
- 4.3.1. Stars (High Growth, High Market Share)
- 4.3.2. Cash Cows (Low Growth, High Market Share)
- 4.3.3. Question Mark (High Growth, Low Market Share)
- 4.3.4. Dogs (Low Growth, Low Market Share)
- 4.4. Ansoff Matrix Analysis
- 4.5. Supply Chain Analysis
- 4.6. Regulatory Landscape
- 4.7. Current Market Potential and Opportunity Assessment (TAM–SAM–SOM Framework)
- 4.8. PRI Analyst Note
- 4.1. Porters Five Forces
- 5. Market Analysis, Insights and Forecast 2021-2033
- 5.1. Market Analysis, Insights and Forecast - by Type
- 5.1.1. Dry FGD
- 5.1.2. Wet FGD
- 5.2. Market Analysis, Insights and Forecast - by End-User Industry
- 5.2.1. Power Generation
- 5.2.2. Cement
- 5.2.3. Chemical
- 5.2.4. Iron and Steel
- 5.2.5. Other End-User Industries
- 5.3. Market Analysis, Insights and Forecast - by Region
- 5.3.1. North America
- 5.3.2. Europe
- 5.3.3. Asia Pacific
- 5.3.4. South America
- 5.3.5. Middle East and Africa
- 5.1. Market Analysis, Insights and Forecast - by Type
- 6. Global FGD Systems Industry Analysis, Insights and Forecast, 2021-2033
- 6.1. Market Analysis, Insights and Forecast - by Type
- 6.1.1. Dry FGD
- 6.1.2. Wet FGD
- 6.2. Market Analysis, Insights and Forecast - by End-User Industry
- 6.2.1. Power Generation
- 6.2.2. Cement
- 6.2.3. Chemical
- 6.2.4. Iron and Steel
- 6.2.5. Other End-User Industries
- 6.1. Market Analysis, Insights and Forecast - by Type
- 7. North America FGD Systems Industry Analysis, Insights and Forecast, 2020-2032
- 7.1. Market Analysis, Insights and Forecast - by Type
- 7.1.1. Dry FGD
- 7.1.2. Wet FGD
- 7.2. Market Analysis, Insights and Forecast - by End-User Industry
- 7.2.1. Power Generation
- 7.2.2. Cement
- 7.2.3. Chemical
- 7.2.4. Iron and Steel
- 7.2.5. Other End-User Industries
- 7.1. Market Analysis, Insights and Forecast - by Type
- 8. Europe FGD Systems Industry Analysis, Insights and Forecast, 2020-2032
- 8.1. Market Analysis, Insights and Forecast - by Type
- 8.1.1. Dry FGD
- 8.1.2. Wet FGD
- 8.2. Market Analysis, Insights and Forecast - by End-User Industry
- 8.2.1. Power Generation
- 8.2.2. Cement
- 8.2.3. Chemical
- 8.2.4. Iron and Steel
- 8.2.5. Other End-User Industries
- 8.1. Market Analysis, Insights and Forecast - by Type
- 9. Asia Pacific FGD Systems Industry Analysis, Insights and Forecast, 2020-2032
- 9.1. Market Analysis, Insights and Forecast - by Type
- 9.1.1. Dry FGD
- 9.1.2. Wet FGD
- 9.2. Market Analysis, Insights and Forecast - by End-User Industry
- 9.2.1. Power Generation
- 9.2.2. Cement
- 9.2.3. Chemical
- 9.2.4. Iron and Steel
- 9.2.5. Other End-User Industries
- 9.1. Market Analysis, Insights and Forecast - by Type
- 10. South America FGD Systems Industry Analysis, Insights and Forecast, 2020-2032
- 10.1. Market Analysis, Insights and Forecast - by Type
- 10.1.1. Dry FGD
- 10.1.2. Wet FGD
- 10.2. Market Analysis, Insights and Forecast - by End-User Industry
- 10.2.1. Power Generation
- 10.2.2. Cement
- 10.2.3. Chemical
- 10.2.4. Iron and Steel
- 10.2.5. Other End-User Industries
- 10.1. Market Analysis, Insights and Forecast - by Type
- 11. Middle East and Africa FGD Systems Industry Analysis, Insights and Forecast, 2020-2032
- 11.1. Market Analysis, Insights and Forecast - by Type
- 11.1.1. Dry FGD
- 11.1.2. Wet FGD
- 11.2. Market Analysis, Insights and Forecast - by End-User Industry
- 11.2.1. Power Generation
- 11.2.2. Cement
- 11.2.3. Chemical
- 11.2.4. Iron and Steel
- 11.2.5. Other End-User Industries
- 11.1. Market Analysis, Insights and Forecast - by Type
- 12. Competitive Analysis
- 12.1. Company Profiles
- 12.1.1 Ducon Technologies Inc
- 12.1.1.1. Company Overview
- 12.1.1.2. Products
- 12.1.1.3. Company Financials
- 12.1.1.4. SWOT Analysis
- 12.1.2 Hamon Corporation
- 12.1.2.1. Company Overview
- 12.1.2.2. Products
- 12.1.2.3. Company Financials
- 12.1.2.4. SWOT Analysis
- 12.1.3 Mitsubishi Hitachi Power Systems Ltd
- 12.1.3.1. Company Overview
- 12.1.3.2. Products
- 12.1.3.3. Company Financials
- 12.1.3.4. SWOT Analysis
- 12.1.4 Fujian Longking Co Ltd
- 12.1.4.1. Company Overview
- 12.1.4.2. Products
- 12.1.4.3. Company Financials
- 12.1.4.4. SWOT Analysis
- 12.1.5 Babcock & Wilcox Enterprises Inc
- 12.1.5.1. Company Overview
- 12.1.5.2. Products
- 12.1.5.3. Company Financials
- 12.1.5.4. SWOT Analysis
- 12.1.6 Thermax Ltd*List Not Exhaustive
- 12.1.6.1. Company Overview
- 12.1.6.2. Products
- 12.1.6.3. Company Financials
- 12.1.6.4. SWOT Analysis
- 12.1.7 John Wood Group PLC
- 12.1.7.1. Company Overview
- 12.1.7.2. Products
- 12.1.7.3. Company Financials
- 12.1.7.4. SWOT Analysis
- 12.1.8 Alstom S A
- 12.1.8.1. Company Overview
- 12.1.8.2. Products
- 12.1.8.3. Company Financials
- 12.1.8.4. SWOT Analysis
- 12.1.9 General Electric Company
- 12.1.9.1. Company Overview
- 12.1.9.2. Products
- 12.1.9.3. Company Financials
- 12.1.9.4. SWOT Analysis
- 12.1.10 Andritz AG
- 12.1.10.1. Company Overview
- 12.1.10.2. Products
- 12.1.10.3. Company Financials
- 12.1.10.4. SWOT Analysis
- 12.1.1 Ducon Technologies Inc
- 12.2. Market Entropy
- 12.2.1 Company's Key Areas Served
- 12.2.2 Recent Developments
- 12.3. Company Market Share Analysis 2025
- 12.3.1 Top 5 Companies Market Share Analysis
- 12.3.2 Top 3 Companies Market Share Analysis
- 12.4. List of Potential Customers
- 13. Research Methodology
List of Figures
- Figure 1: Global FGD Systems Industry Revenue Breakdown (billion, %) by Region 2025 & 2033
- Figure 2: North America FGD Systems Industry Revenue (billion), by Type 2025 & 2033
- Figure 3: North America FGD Systems Industry Revenue Share (%), by Type 2025 & 2033
- Figure 4: North America FGD Systems Industry Revenue (billion), by End-User Industry 2025 & 2033
- Figure 5: North America FGD Systems Industry Revenue Share (%), by End-User Industry 2025 & 2033
- Figure 6: North America FGD Systems Industry Revenue (billion), by Country 2025 & 2033
- Figure 7: North America FGD Systems Industry Revenue Share (%), by Country 2025 & 2033
- Figure 8: Europe FGD Systems Industry Revenue (billion), by Type 2025 & 2033
- Figure 9: Europe FGD Systems Industry Revenue Share (%), by Type 2025 & 2033
- Figure 10: Europe FGD Systems Industry Revenue (billion), by End-User Industry 2025 & 2033
- Figure 11: Europe FGD Systems Industry Revenue Share (%), by End-User Industry 2025 & 2033
- Figure 12: Europe FGD Systems Industry Revenue (billion), by Country 2025 & 2033
- Figure 13: Europe FGD Systems Industry Revenue Share (%), by Country 2025 & 2033
- Figure 14: Asia Pacific FGD Systems Industry Revenue (billion), by Type 2025 & 2033
- Figure 15: Asia Pacific FGD Systems Industry Revenue Share (%), by Type 2025 & 2033
- Figure 16: Asia Pacific FGD Systems Industry Revenue (billion), by End-User Industry 2025 & 2033
- Figure 17: Asia Pacific FGD Systems Industry Revenue Share (%), by End-User Industry 2025 & 2033
- Figure 18: Asia Pacific FGD Systems Industry Revenue (billion), by Country 2025 & 2033
- Figure 19: Asia Pacific FGD Systems Industry Revenue Share (%), by Country 2025 & 2033
- Figure 20: South America FGD Systems Industry Revenue (billion), by Type 2025 & 2033
- Figure 21: South America FGD Systems Industry Revenue Share (%), by Type 2025 & 2033
- Figure 22: South America FGD Systems Industry Revenue (billion), by End-User Industry 2025 & 2033
- Figure 23: South America FGD Systems Industry Revenue Share (%), by End-User Industry 2025 & 2033
- Figure 24: South America FGD Systems Industry Revenue (billion), by Country 2025 & 2033
- Figure 25: South America FGD Systems Industry Revenue Share (%), by Country 2025 & 2033
- Figure 26: Middle East and Africa FGD Systems Industry Revenue (billion), by Type 2025 & 2033
- Figure 27: Middle East and Africa FGD Systems Industry Revenue Share (%), by Type 2025 & 2033
- Figure 28: Middle East and Africa FGD Systems Industry Revenue (billion), by End-User Industry 2025 & 2033
- Figure 29: Middle East and Africa FGD Systems Industry Revenue Share (%), by End-User Industry 2025 & 2033
- Figure 30: Middle East and Africa FGD Systems Industry Revenue (billion), by Country 2025 & 2033
- Figure 31: Middle East and Africa FGD Systems Industry Revenue Share (%), by Country 2025 & 2033
List of Tables
- Table 1: Global FGD Systems Industry Revenue billion Forecast, by Type 2020 & 2033
- Table 2: Global FGD Systems Industry Revenue billion Forecast, by End-User Industry 2020 & 2033
- Table 3: Global FGD Systems Industry Revenue billion Forecast, by Region 2020 & 2033
- Table 4: Global FGD Systems Industry Revenue billion Forecast, by Type 2020 & 2033
- Table 5: Global FGD Systems Industry Revenue billion Forecast, by End-User Industry 2020 & 2033
- Table 6: Global FGD Systems Industry Revenue billion Forecast, by Country 2020 & 2033
- Table 7: Global FGD Systems Industry Revenue billion Forecast, by Type 2020 & 2033
- Table 8: Global FGD Systems Industry Revenue billion Forecast, by End-User Industry 2020 & 2033
- Table 9: Global FGD Systems Industry Revenue billion Forecast, by Country 2020 & 2033
- Table 10: Global FGD Systems Industry Revenue billion Forecast, by Type 2020 & 2033
- Table 11: Global FGD Systems Industry Revenue billion Forecast, by End-User Industry 2020 & 2033
- Table 12: Global FGD Systems Industry Revenue billion Forecast, by Country 2020 & 2033
- Table 13: Global FGD Systems Industry Revenue billion Forecast, by Type 2020 & 2033
- Table 14: Global FGD Systems Industry Revenue billion Forecast, by End-User Industry 2020 & 2033
- Table 15: Global FGD Systems Industry Revenue billion Forecast, by Country 2020 & 2033
- Table 16: Global FGD Systems Industry Revenue billion Forecast, by Type 2020 & 2033
- Table 17: Global FGD Systems Industry Revenue billion Forecast, by End-User Industry 2020 & 2033
- Table 18: Global FGD Systems Industry Revenue billion Forecast, by Country 2020 & 2033
Frequently Asked Questions
1. What is the projected Compound Annual Growth Rate (CAGR) of the FGD Systems Industry?
The projected CAGR is approximately 13.06%.
2. Which companies are prominent players in the FGD Systems Industry?
Key companies in the market include Ducon Technologies Inc, Hamon Corporation, Mitsubishi Hitachi Power Systems Ltd, Fujian Longking Co Ltd, Babcock & Wilcox Enterprises Inc, Thermax Ltd*List Not Exhaustive, John Wood Group PLC, Alstom S A, General Electric Company, Andritz AG.
3. What are the main segments of the FGD Systems Industry?
The market segments include Type, End-User Industry.
4. Can you provide details about the market size?
The market size is estimated to be USD 9.55 billion as of 2022.
5. What are some drivers contributing to market growth?
4.; Increasing Industrialization across the World4.; Expansion and Development of New Power Plants.
6. What are the notable trends driving market growth?
Increasing Demand from Power Generation Sector.
7. Are there any restraints impacting market growth?
4.; Increasing Adoption of Renewable Energy.
8. Can you provide examples of recent developments in the market?
N/A
9. What pricing options are available for accessing the report?
Pricing options include single-user, multi-user, and enterprise licenses priced at USD 4750, USD 5250, and USD 8750 respectively.
10. Is the market size provided in terms of value or volume?
The market size is provided in terms of value, measured in billion.
11. Are there any specific market keywords associated with the report?
Yes, the market keyword associated with the report is "FGD Systems Industry," which aids in identifying and referencing the specific market segment covered.
12. How do I determine which pricing option suits my needs best?
The pricing options vary based on user requirements and access needs. Individual users may opt for single-user licenses, while businesses requiring broader access may choose multi-user or enterprise licenses for cost-effective access to the report.
13. Are there any additional resources or data provided in the FGD Systems Industry report?
While the report offers comprehensive insights, it's advisable to review the specific contents or supplementary materials provided to ascertain if additional resources or data are available.
14. How can I stay updated on further developments or reports in the FGD Systems Industry?
To stay informed about further developments, trends, and reports in the FGD Systems Industry, consider subscribing to industry newsletters, following relevant companies and organizations, or regularly checking reputable industry news sources and publications.
Methodology
Step 1 - Identification of Relevant Samples Size from Population Database


Step 2 - Approaches for Defining Global Market Size (Value, Volume* & Price*)

Note*: In applicable scenarios
Step 3 - Data Sources
Primary Research
- Web Analytics
- Survey Reports
- Research Institute
- Latest Research Reports
- Opinion Leaders
Secondary Research
- Annual Reports
- White Paper
- Latest Press Release
- Industry Association
- Paid Database
- Investor Presentations

Step 4 - Data Triangulation
Involves using different sources of information in order to increase the validity of a study
These sources are likely to be stakeholders in a program - participants, other researchers, program staff, other community members, and so on.
Then we put all data in single framework & apply various statistical tools to find out the dynamic on the market.
During the analysis stage, feedback from the stakeholder groups would be compared to determine areas of agreement as well as areas of divergence