

Key Insights
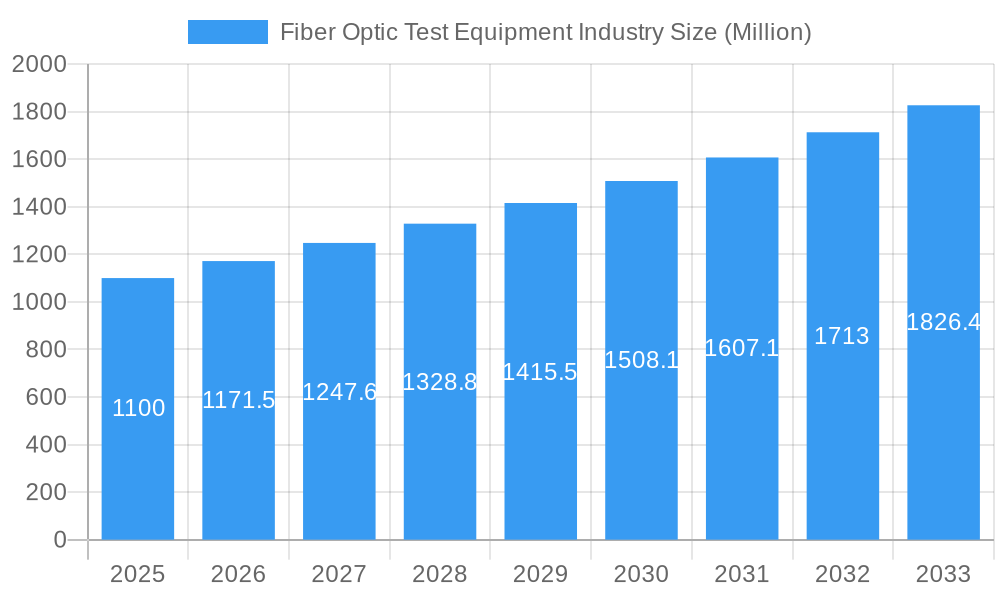
The fiber optic test equipment market, valued at approximately $1.10 billion in 2025, is projected to experience robust growth, driven by the expanding global fiber optic infrastructure. This expansion is fueled by the surging demand for high-speed internet access, the proliferation of data centers supporting cloud computing, and the increasing adoption of fiber optics in various industries such as telecommunications, manufacturing, and healthcare. The market's Compound Annual Growth Rate (CAGR) of 6.50% from 2025 to 2033 signifies consistent market expansion. Key growth drivers include the rising need for reliable network monitoring and maintenance, the increasing complexity of fiber optic networks requiring sophisticated testing solutions, and the ongoing deployment of 5G and other advanced communication technologies. Market segmentation reveals that Optical Time Domain Reflectometers (OTDRs) and Optical Spectrum Analyzers (OSAs) are major contributors to market revenue, while the telecommunications sector remains the largest end-user application. Competition is fierce, with established players like VIAVI Solutions, Anritsu, and EXFO vying for market share alongside emerging companies offering innovative and cost-effective solutions. Geographic expansion, particularly in developing regions experiencing rapid infrastructure development, further contributes to market growth.
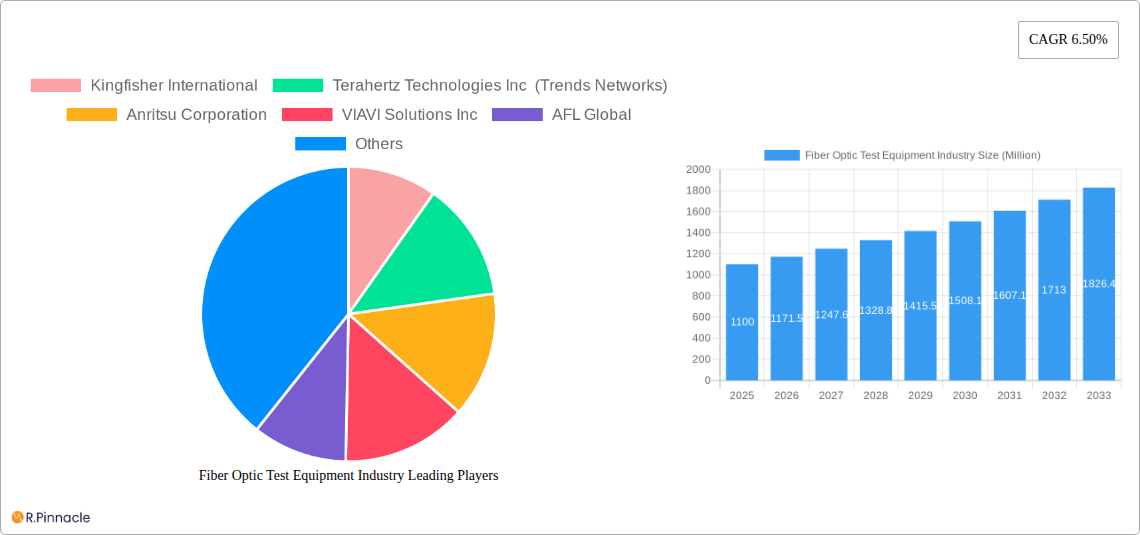
Fiber Optic Test Equipment Industry Market Size (In Billion)
Technological advancements, particularly in areas like automated testing and remote fiber testing, are reshaping the market landscape. The increasing adoption of software-defined networking (SDN) and network function virtualization (NFV) is also influencing the demand for compatible testing solutions. However, challenges remain, including the high cost of advanced testing equipment, the need for specialized technical expertise, and the potential for obsolescence as technology evolves. Despite these restraints, the long-term outlook for the fiber optic test equipment market remains positive, supported by the continued growth of global data consumption and the expanding reach of high-bandwidth networks. Strategic partnerships, acquisitions, and the introduction of innovative testing methods will continue to shape the competitive dynamics within this thriving sector.
Fiber Optic Test Equipment Industry Company Market Share
Fiber Optic Test Equipment Industry Report: 2019-2033
This comprehensive report provides a detailed analysis of the Fiber Optic Test Equipment industry, covering market size, growth drivers, competitive landscape, and future outlook from 2019 to 2033. The study period spans from 2019-2033, with 2025 as the base and estimated year, and a forecast period of 2025-2033. The historical period analyzed is 2019-2024. The report is crucial for industry professionals, investors, and stakeholders seeking actionable insights into this dynamic market. This report predicts a market size of $XX Billion by 2033.
Fiber Optic Test Equipment Industry Market Structure & Innovation Trends
The fiber optic test equipment market is moderately concentrated, with several key players holding significant market share. Key players include Kingfisher International, Terahertz Technologies Inc (Trends Networks), Anritsu Corporation, VIAVI Solutions Inc, AFL Global, Pelorus Technologies Pvt Ltd, EXFO Inc, Yokogawa Electric Corporation, AMS Technologies A, Deviser Instruments, Fluke Networks, and VeEX Inc. While precise market share data requires proprietary information and is not available for this report, analysis suggests that the top five players likely account for approximately 50-60% of the global market. M&A activity has been moderate in recent years, with deal values typically ranging from $XX Million to $XX Million. Innovation is driven primarily by the need for higher bandwidth, faster speeds, and improved testing capabilities to meet the demands of 5G and beyond. Regulatory frameworks vary by region, influencing the adoption of certain technologies. Substitute products are limited, with few viable alternatives for high-precision fiber optic testing. End-user demographics consist primarily of telecommunications companies, data centers, and various industries requiring high-bandwidth connectivity.
- Market Concentration: Moderately concentrated with top 5 players holding 50-60% market share (estimated).
- Innovation Drivers: Demand for higher bandwidth, faster speeds, and improved testing capabilities for 5G and beyond.
- M&A Activity: Moderate activity with deal values ranging from $XX Million to $XX Million (estimated).
- Regulatory Frameworks: Vary by region, influencing technology adoption.
- Product Substitutes: Limited viable alternatives.
- End-User Demographics: Primarily telecommunications, data centers, and various industries.
Fiber Optic Test Equipment Industry Market Dynamics & Trends
The fiber optic test equipment market is experiencing robust growth, driven by the global expansion of 5G networks, increasing demand for high-speed internet access, and the proliferation of data centers. The Compound Annual Growth Rate (CAGR) for the forecast period (2025-2033) is estimated to be XX%. Technological disruptions are primarily focused on the development of higher-speed testing capabilities and more compact, portable equipment. Consumer preferences are shifting towards more user-friendly and versatile equipment. Competitive dynamics are characterized by intense competition among established players and the emergence of new entrants offering innovative solutions. Market penetration is high in developed regions but still has significant growth potential in emerging economies. The increasing adoption of cloud computing and the Internet of Things (IoT) are further driving market expansion.
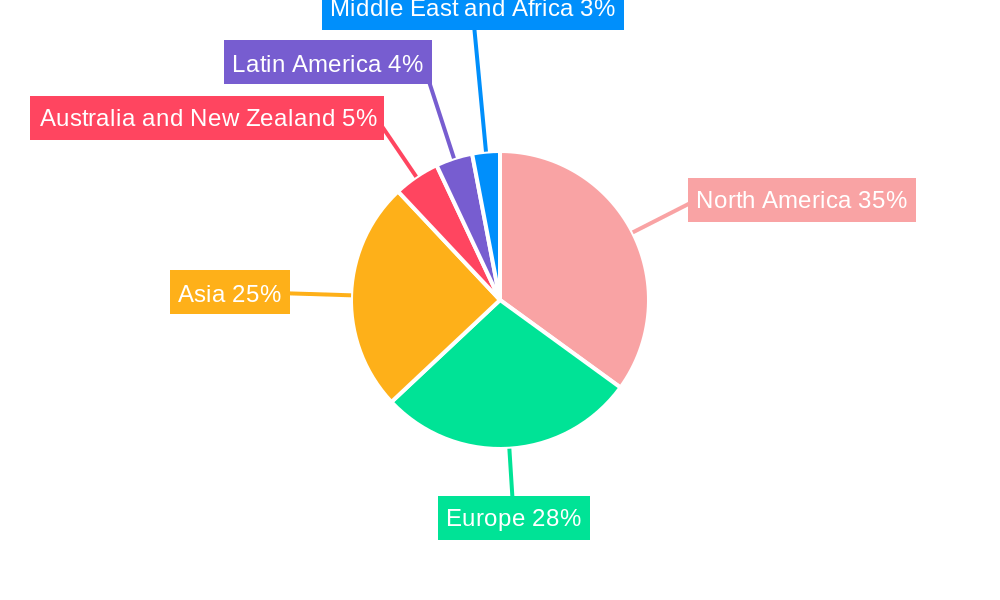
Dominant Regions & Segments in Fiber Optic Test Equipment Industry
North America and Asia-Pacific are the dominant regions for fiber optic test equipment. North America benefits from a strong presence of major players and advanced infrastructure, while Asia-Pacific shows rapid growth driven by expanding 5G networks and substantial investments in data centers. Within segmentations:
By Equipment Type:
- Optical Time Domain Reflectometer (OTDR): This segment holds a leading market share due to its critical role in troubleshooting and maintaining fiber optic networks. Growth is driven by the rising demand for higher-speed and long-reach OTDRs.
- Optical Power and Loss Meters: This segment is essential for verifying the power levels and signal loss in fiber optic systems, ensuring effective network performance.
- Optical Spectrum Analyzers: The expansion of WDM (Wavelength-Division Multiplexing) systems is increasing the demand for Optical Spectrum Analyzers.
By End-user Application:
- Telecommunications: This remains the largest end-user segment due to the massive investment in expanding fiber optic networks globally.
- Data Centers: The surge in data center construction and expansion is fueling the demand for high-quality fiber optic testing equipment.
Key Drivers (varies by region and segment):
- Economic Policies: Government incentives for infrastructure development.
- Infrastructure Development: Expansion of fiber optic networks and data centers.
- Technological Advancements: Development of higher-speed and more portable test equipment.
Fiber Optic Test Equipment Industry Product Innovations
Recent innovations focus on increased speed and versatility in test modules, enabling the efficient testing of next-generation interfaces like 800G. Miniaturization and enhanced portability are also key trends, addressing the need for field-testing solutions. These innovations offer significant competitive advantages, leading to increased market share and improved customer satisfaction. Furthermore, software integrations and cloud-based solutions are gaining popularity.
Report Scope & Segmentation Analysis
This report comprehensively segments the fiber optic test equipment market by equipment type (Optical Light Sources, Optical Power and Loss Meters, Optical Time Domain Reflectometer, Optical Spectrum Analyzers, Remote Fiber Test System, Other Equipment Types) and end-user application (Telecommunications, Data Centers, Industries, Other End-user Applications). Each segment's growth projections, market sizes, and competitive dynamics are analyzed in detail, providing valuable insights into market trends. Growth projections vary significantly depending on the specific segment and geographical region.
Key Drivers of Fiber Optic Test Equipment Industry Growth
The primary growth drivers are the escalating deployment of high-speed data networks (5G and beyond), the continuing expansion of data centers fueled by cloud computing and the IoT, and government initiatives to enhance infrastructure worldwide. Technological advancements like higher-speed testing capabilities and the development of compact, portable equipment are also key catalysts.
Challenges in the Fiber Optic Test Equipment Industry Sector
The industry faces challenges such as intense competition, fluctuating raw material costs impacting production expenses, and evolving technological demands, requiring continuous innovation. The cost associated with advanced testing solutions for higher data rates (like 800G) can act as a barrier to entry for some market participants.
Emerging Opportunities in Fiber Optic Test Equipment Industry
Significant opportunities lie in the developing markets of emerging economies, the increasing demand for cost-effective solutions, and the integration of AI/ML for improved analysis and automation in testing procedures. The expanding adoption of fiber optics in new applications, such as autonomous vehicles and industrial automation, presents additional opportunities.
Leading Players in the Fiber Optic Test Equipment Industry Market
- Kingfisher International
- Terahertz Technologies Inc (Trends Networks)
- Anritsu Corporation
- VIAVI Solutions Inc
- AFL Global
- Pelorus Technologies Pvt Ltd
- EXFO Inc
- Yokogawa Electric Corporation
- AMS Technologies A
- Deviser Instruments
- Fluke Networks
- VeEX Inc
Key Developments in Fiber Optic Test Equipment Industry
- March 2024: VeEX Inc. launched the RXT-6800, an advanced 800G multiservice test module, offering a compact and versatile solution.
- February 2024: Anritsu Corporation and MediaTek validated advanced 3TX technology in MediaTek's M80 5G modem using Anritsu's MT8000A test station.
Future Outlook for Fiber Optic Test Equipment Industry Market
The future outlook is extremely positive, driven by the continued expansion of 5G and beyond, the growth of data centers, and increasing demand for high-bandwidth connectivity in diverse applications. Strategic partnerships, technological innovation, and expansion into emerging markets are key opportunities for future growth.
Fiber Optic Test Equipment Industry Segmentation
-
1. Equipment Type
- 1.1. Optical Light Sources
- 1.2. Optical Power and Loss Meters
- 1.3. Optical Time Domain Reflectometer
- 1.4. Optical Spectrum Analyzers
- 1.5. Remote Fiber Test System
- 1.6. Other Equipment Types
-
2. End-user Application
- 2.1. Telecommunications
- 2.2. Data Centers
- 2.3. Industries
- 2.4. Other End-user Applications
Fiber Optic Test Equipment Industry Segmentation By Geography
-
1. North America
- 1.1. United States
- 1.2. Canada
-
2. Europe
- 2.1. Germany
- 2.2. United Kingdom
- 2.3. France
-
3. Asia
- 3.1. China
- 3.2. Japan
- 3.3. India
- 4. Australia and New Zealand
-
5. Latin America
- 5.1. Brazil
- 5.2. Argentina
- 5.3. Mexico
-
6. Middle East and Africa
- 6.1. United Arab Emirates
- 6.2. South Africa
Fiber Optic Test Equipment Industry Regional Market Share
Geographic Coverage of Fiber Optic Test Equipment Industry
Fiber Optic Test Equipment Industry REPORT HIGHLIGHTS
| Aspects | Details |
|---|---|
| Study Period | 2020-2034 |
| Base Year | 2025 |
| Estimated Year | 2026 |
| Forecast Period | 2026-2034 |
| Historical Period | 2020-2025 |
| Growth Rate | CAGR of 6.50% from 2020-2034 |
| Segmentation |
|
Table of Contents
- 1. Introduction
- 1.1. Research Scope
- 1.2. Market Segmentation
- 1.3. Research Objective
- 1.4. Definitions and Assumptions
- 2. Executive Summary
- 2.1. Market Snapshot
- 3. Market Dynamics
- 3.1. Market Drivers
- 3.2. Market Restrains
- 3.3. Market Trends
- 3.4. Market Opportunities
- 4. Market Factor Analysis
- 4.1. Porters Five Forces
- 4.1.1. Bargaining Power of Suppliers
- 4.1.2. Bargaining Power of Buyers
- 4.1.3. Threat of New Entrants
- 4.1.4. Threat of Substitutes
- 4.1.5. Competitive Rivalry
- 4.2. PESTEL analysis
- 4.3. BCG Analysis
- 4.3.1. Stars (High Growth, High Market Share)
- 4.3.2. Cash Cows (Low Growth, High Market Share)
- 4.3.3. Question Mark (High Growth, Low Market Share)
- 4.3.4. Dogs (Low Growth, Low Market Share)
- 4.4. Ansoff Matrix Analysis
- 4.5. Supply Chain Analysis
- 4.6. Regulatory Landscape
- 4.7. Current Market Potential and Opportunity Assessment (TAM–SAM–SOM Framework)
- 4.8. PRI Analyst Note
- 4.1. Porters Five Forces
- 5. Market Analysis, Insights and Forecast 2021-2033
- 5.1. Market Analysis, Insights and Forecast - by Equipment Type
- 5.1.1. Optical Light Sources
- 5.1.2. Optical Power and Loss Meters
- 5.1.3. Optical Time Domain Reflectometer
- 5.1.4. Optical Spectrum Analyzers
- 5.1.5. Remote Fiber Test System
- 5.1.6. Other Equipment Types
- 5.2. Market Analysis, Insights and Forecast - by End-user Application
- 5.2.1. Telecommunications
- 5.2.2. Data Centers
- 5.2.3. Industries
- 5.2.4. Other End-user Applications
- 5.3. Market Analysis, Insights and Forecast - by Region
- 5.3.1. North America
- 5.3.2. Europe
- 5.3.3. Asia
- 5.3.4. Australia and New Zealand
- 5.3.5. Latin America
- 5.3.6. Middle East and Africa
- 5.1. Market Analysis, Insights and Forecast - by Equipment Type
- 6. Global Fiber Optic Test Equipment Industry Analysis, Insights and Forecast, 2021-2033
- 6.1. Market Analysis, Insights and Forecast - by Equipment Type
- 6.1.1. Optical Light Sources
- 6.1.2. Optical Power and Loss Meters
- 6.1.3. Optical Time Domain Reflectometer
- 6.1.4. Optical Spectrum Analyzers
- 6.1.5. Remote Fiber Test System
- 6.1.6. Other Equipment Types
- 6.2. Market Analysis, Insights and Forecast - by End-user Application
- 6.2.1. Telecommunications
- 6.2.2. Data Centers
- 6.2.3. Industries
- 6.2.4. Other End-user Applications
- 6.1. Market Analysis, Insights and Forecast - by Equipment Type
- 7. North America Fiber Optic Test Equipment Industry Analysis, Insights and Forecast, 2020-2032
- 7.1. Market Analysis, Insights and Forecast - by Equipment Type
- 7.1.1. Optical Light Sources
- 7.1.2. Optical Power and Loss Meters
- 7.1.3. Optical Time Domain Reflectometer
- 7.1.4. Optical Spectrum Analyzers
- 7.1.5. Remote Fiber Test System
- 7.1.6. Other Equipment Types
- 7.2. Market Analysis, Insights and Forecast - by End-user Application
- 7.2.1. Telecommunications
- 7.2.2. Data Centers
- 7.2.3. Industries
- 7.2.4. Other End-user Applications
- 7.1. Market Analysis, Insights and Forecast - by Equipment Type
- 8. Europe Fiber Optic Test Equipment Industry Analysis, Insights and Forecast, 2020-2032
- 8.1. Market Analysis, Insights and Forecast - by Equipment Type
- 8.1.1. Optical Light Sources
- 8.1.2. Optical Power and Loss Meters
- 8.1.3. Optical Time Domain Reflectometer
- 8.1.4. Optical Spectrum Analyzers
- 8.1.5. Remote Fiber Test System
- 8.1.6. Other Equipment Types
- 8.2. Market Analysis, Insights and Forecast - by End-user Application
- 8.2.1. Telecommunications
- 8.2.2. Data Centers
- 8.2.3. Industries
- 8.2.4. Other End-user Applications
- 8.1. Market Analysis, Insights and Forecast - by Equipment Type
- 9. Asia Fiber Optic Test Equipment Industry Analysis, Insights and Forecast, 2020-2032
- 9.1. Market Analysis, Insights and Forecast - by Equipment Type
- 9.1.1. Optical Light Sources
- 9.1.2. Optical Power and Loss Meters
- 9.1.3. Optical Time Domain Reflectometer
- 9.1.4. Optical Spectrum Analyzers
- 9.1.5. Remote Fiber Test System
- 9.1.6. Other Equipment Types
- 9.2. Market Analysis, Insights and Forecast - by End-user Application
- 9.2.1. Telecommunications
- 9.2.2. Data Centers
- 9.2.3. Industries
- 9.2.4. Other End-user Applications
- 9.1. Market Analysis, Insights and Forecast - by Equipment Type
- 10. Australia and New Zealand Fiber Optic Test Equipment Industry Analysis, Insights and Forecast, 2020-2032
- 10.1. Market Analysis, Insights and Forecast - by Equipment Type
- 10.1.1. Optical Light Sources
- 10.1.2. Optical Power and Loss Meters
- 10.1.3. Optical Time Domain Reflectometer
- 10.1.4. Optical Spectrum Analyzers
- 10.1.5. Remote Fiber Test System
- 10.1.6. Other Equipment Types
- 10.2. Market Analysis, Insights and Forecast - by End-user Application
- 10.2.1. Telecommunications
- 10.2.2. Data Centers
- 10.2.3. Industries
- 10.2.4. Other End-user Applications
- 10.1. Market Analysis, Insights and Forecast - by Equipment Type
- 11. Latin America Fiber Optic Test Equipment Industry Analysis, Insights and Forecast, 2020-2032
- 11.1. Market Analysis, Insights and Forecast - by Equipment Type
- 11.1.1. Optical Light Sources
- 11.1.2. Optical Power and Loss Meters
- 11.1.3. Optical Time Domain Reflectometer
- 11.1.4. Optical Spectrum Analyzers
- 11.1.5. Remote Fiber Test System
- 11.1.6. Other Equipment Types
- 11.2. Market Analysis, Insights and Forecast - by End-user Application
- 11.2.1. Telecommunications
- 11.2.2. Data Centers
- 11.2.3. Industries
- 11.2.4. Other End-user Applications
- 11.1. Market Analysis, Insights and Forecast - by Equipment Type
- 12. Middle East and Africa Fiber Optic Test Equipment Industry Analysis, Insights and Forecast, 2020-2032
- 12.1. Market Analysis, Insights and Forecast - by Equipment Type
- 12.1.1. Optical Light Sources
- 12.1.2. Optical Power and Loss Meters
- 12.1.3. Optical Time Domain Reflectometer
- 12.1.4. Optical Spectrum Analyzers
- 12.1.5. Remote Fiber Test System
- 12.1.6. Other Equipment Types
- 12.2. Market Analysis, Insights and Forecast - by End-user Application
- 12.2.1. Telecommunications
- 12.2.2. Data Centers
- 12.2.3. Industries
- 12.2.4. Other End-user Applications
- 12.1. Market Analysis, Insights and Forecast - by Equipment Type
- 13. Competitive Analysis
- 13.1. Company Profiles
- 13.1.1 Kingfisher International
- 13.1.1.1. Company Overview
- 13.1.1.2. Products
- 13.1.1.3. Company Financials
- 13.1.1.4. SWOT Analysis
- 13.1.2 Terahertz Technologies Inc (Trends Networks)
- 13.1.2.1. Company Overview
- 13.1.2.2. Products
- 13.1.2.3. Company Financials
- 13.1.2.4. SWOT Analysis
- 13.1.3 Anritsu Corporation
- 13.1.3.1. Company Overview
- 13.1.3.2. Products
- 13.1.3.3. Company Financials
- 13.1.3.4. SWOT Analysis
- 13.1.4 VIAVI Solutions Inc
- 13.1.4.1. Company Overview
- 13.1.4.2. Products
- 13.1.4.3. Company Financials
- 13.1.4.4. SWOT Analysis
- 13.1.5 AFL Global
- 13.1.5.1. Company Overview
- 13.1.5.2. Products
- 13.1.5.3. Company Financials
- 13.1.5.4. SWOT Analysis
- 13.1.6 Pelorus Technologies Pvt Ltd
- 13.1.6.1. Company Overview
- 13.1.6.2. Products
- 13.1.6.3. Company Financials
- 13.1.6.4. SWOT Analysis
- 13.1.7 EXFO Inc
- 13.1.7.1. Company Overview
- 13.1.7.2. Products
- 13.1.7.3. Company Financials
- 13.1.7.4. SWOT Analysis
- 13.1.8 Yokogawa Electric Corporation
- 13.1.8.1. Company Overview
- 13.1.8.2. Products
- 13.1.8.3. Company Financials
- 13.1.8.4. SWOT Analysis
- 13.1.9 AMS Technologies A
- 13.1.9.1. Company Overview
- 13.1.9.2. Products
- 13.1.9.3. Company Financials
- 13.1.9.4. SWOT Analysis
- 13.1.10 Deviser Instruments
- 13.1.10.1. Company Overview
- 13.1.10.2. Products
- 13.1.10.3. Company Financials
- 13.1.10.4. SWOT Analysis
- 13.1.11 Fluke Networks
- 13.1.11.1. Company Overview
- 13.1.11.2. Products
- 13.1.11.3. Company Financials
- 13.1.11.4. SWOT Analysis
- 13.1.12 VeEX Inc
- 13.1.12.1. Company Overview
- 13.1.12.2. Products
- 13.1.12.3. Company Financials
- 13.1.12.4. SWOT Analysis
- 13.1.1 Kingfisher International
- 13.2. Market Entropy
- 13.2.1 Company's Key Areas Served
- 13.2.2 Recent Developments
- 13.3. Company Market Share Analysis 2025
- 13.3.1 Top 5 Companies Market Share Analysis
- 13.3.2 Top 3 Companies Market Share Analysis
- 13.4. List of Potential Customers
- 14. Research Methodology
List of Figures
- Figure 1: Global Fiber Optic Test Equipment Industry Revenue Breakdown (Million, %) by Region 2025 & 2033
- Figure 2: Global Fiber Optic Test Equipment Industry Volume Breakdown (K Unit, %) by Region 2025 & 2033
- Figure 3: North America Fiber Optic Test Equipment Industry Revenue (Million), by Equipment Type 2025 & 2033
- Figure 4: North America Fiber Optic Test Equipment Industry Volume (K Unit), by Equipment Type 2025 & 2033
- Figure 5: North America Fiber Optic Test Equipment Industry Revenue Share (%), by Equipment Type 2025 & 2033
- Figure 6: North America Fiber Optic Test Equipment Industry Volume Share (%), by Equipment Type 2025 & 2033
- Figure 7: North America Fiber Optic Test Equipment Industry Revenue (Million), by End-user Application 2025 & 2033
- Figure 8: North America Fiber Optic Test Equipment Industry Volume (K Unit), by End-user Application 2025 & 2033
- Figure 9: North America Fiber Optic Test Equipment Industry Revenue Share (%), by End-user Application 2025 & 2033
- Figure 10: North America Fiber Optic Test Equipment Industry Volume Share (%), by End-user Application 2025 & 2033
- Figure 11: North America Fiber Optic Test Equipment Industry Revenue (Million), by Country 2025 & 2033
- Figure 12: North America Fiber Optic Test Equipment Industry Volume (K Unit), by Country 2025 & 2033
- Figure 13: North America Fiber Optic Test Equipment Industry Revenue Share (%), by Country 2025 & 2033
- Figure 14: North America Fiber Optic Test Equipment Industry Volume Share (%), by Country 2025 & 2033
- Figure 15: Europe Fiber Optic Test Equipment Industry Revenue (Million), by Equipment Type 2025 & 2033
- Figure 16: Europe Fiber Optic Test Equipment Industry Volume (K Unit), by Equipment Type 2025 & 2033
- Figure 17: Europe Fiber Optic Test Equipment Industry Revenue Share (%), by Equipment Type 2025 & 2033
- Figure 18: Europe Fiber Optic Test Equipment Industry Volume Share (%), by Equipment Type 2025 & 2033
- Figure 19: Europe Fiber Optic Test Equipment Industry Revenue (Million), by End-user Application 2025 & 2033
- Figure 20: Europe Fiber Optic Test Equipment Industry Volume (K Unit), by End-user Application 2025 & 2033
- Figure 21: Europe Fiber Optic Test Equipment Industry Revenue Share (%), by End-user Application 2025 & 2033
- Figure 22: Europe Fiber Optic Test Equipment Industry Volume Share (%), by End-user Application 2025 & 2033
- Figure 23: Europe Fiber Optic Test Equipment Industry Revenue (Million), by Country 2025 & 2033
- Figure 24: Europe Fiber Optic Test Equipment Industry Volume (K Unit), by Country 2025 & 2033
- Figure 25: Europe Fiber Optic Test Equipment Industry Revenue Share (%), by Country 2025 & 2033
- Figure 26: Europe Fiber Optic Test Equipment Industry Volume Share (%), by Country 2025 & 2033
- Figure 27: Asia Fiber Optic Test Equipment Industry Revenue (Million), by Equipment Type 2025 & 2033
- Figure 28: Asia Fiber Optic Test Equipment Industry Volume (K Unit), by Equipment Type 2025 & 2033
- Figure 29: Asia Fiber Optic Test Equipment Industry Revenue Share (%), by Equipment Type 2025 & 2033
- Figure 30: Asia Fiber Optic Test Equipment Industry Volume Share (%), by Equipment Type 2025 & 2033
- Figure 31: Asia Fiber Optic Test Equipment Industry Revenue (Million), by End-user Application 2025 & 2033
- Figure 32: Asia Fiber Optic Test Equipment Industry Volume (K Unit), by End-user Application 2025 & 2033
- Figure 33: Asia Fiber Optic Test Equipment Industry Revenue Share (%), by End-user Application 2025 & 2033
- Figure 34: Asia Fiber Optic Test Equipment Industry Volume Share (%), by End-user Application 2025 & 2033
- Figure 35: Asia Fiber Optic Test Equipment Industry Revenue (Million), by Country 2025 & 2033
- Figure 36: Asia Fiber Optic Test Equipment Industry Volume (K Unit), by Country 2025 & 2033
- Figure 37: Asia Fiber Optic Test Equipment Industry Revenue Share (%), by Country 2025 & 2033
- Figure 38: Asia Fiber Optic Test Equipment Industry Volume Share (%), by Country 2025 & 2033
- Figure 39: Australia and New Zealand Fiber Optic Test Equipment Industry Revenue (Million), by Equipment Type 2025 & 2033
- Figure 40: Australia and New Zealand Fiber Optic Test Equipment Industry Volume (K Unit), by Equipment Type 2025 & 2033
- Figure 41: Australia and New Zealand Fiber Optic Test Equipment Industry Revenue Share (%), by Equipment Type 2025 & 2033
- Figure 42: Australia and New Zealand Fiber Optic Test Equipment Industry Volume Share (%), by Equipment Type 2025 & 2033
- Figure 43: Australia and New Zealand Fiber Optic Test Equipment Industry Revenue (Million), by End-user Application 2025 & 2033
- Figure 44: Australia and New Zealand Fiber Optic Test Equipment Industry Volume (K Unit), by End-user Application 2025 & 2033
- Figure 45: Australia and New Zealand Fiber Optic Test Equipment Industry Revenue Share (%), by End-user Application 2025 & 2033
- Figure 46: Australia and New Zealand Fiber Optic Test Equipment Industry Volume Share (%), by End-user Application 2025 & 2033
- Figure 47: Australia and New Zealand Fiber Optic Test Equipment Industry Revenue (Million), by Country 2025 & 2033
- Figure 48: Australia and New Zealand Fiber Optic Test Equipment Industry Volume (K Unit), by Country 2025 & 2033
- Figure 49: Australia and New Zealand Fiber Optic Test Equipment Industry Revenue Share (%), by Country 2025 & 2033
- Figure 50: Australia and New Zealand Fiber Optic Test Equipment Industry Volume Share (%), by Country 2025 & 2033
- Figure 51: Latin America Fiber Optic Test Equipment Industry Revenue (Million), by Equipment Type 2025 & 2033
- Figure 52: Latin America Fiber Optic Test Equipment Industry Volume (K Unit), by Equipment Type 2025 & 2033
- Figure 53: Latin America Fiber Optic Test Equipment Industry Revenue Share (%), by Equipment Type 2025 & 2033
- Figure 54: Latin America Fiber Optic Test Equipment Industry Volume Share (%), by Equipment Type 2025 & 2033
- Figure 55: Latin America Fiber Optic Test Equipment Industry Revenue (Million), by End-user Application 2025 & 2033
- Figure 56: Latin America Fiber Optic Test Equipment Industry Volume (K Unit), by End-user Application 2025 & 2033
- Figure 57: Latin America Fiber Optic Test Equipment Industry Revenue Share (%), by End-user Application 2025 & 2033
- Figure 58: Latin America Fiber Optic Test Equipment Industry Volume Share (%), by End-user Application 2025 & 2033
- Figure 59: Latin America Fiber Optic Test Equipment Industry Revenue (Million), by Country 2025 & 2033
- Figure 60: Latin America Fiber Optic Test Equipment Industry Volume (K Unit), by Country 2025 & 2033
- Figure 61: Latin America Fiber Optic Test Equipment Industry Revenue Share (%), by Country 2025 & 2033
- Figure 62: Latin America Fiber Optic Test Equipment Industry Volume Share (%), by Country 2025 & 2033
- Figure 63: Middle East and Africa Fiber Optic Test Equipment Industry Revenue (Million), by Equipment Type 2025 & 2033
- Figure 64: Middle East and Africa Fiber Optic Test Equipment Industry Volume (K Unit), by Equipment Type 2025 & 2033
- Figure 65: Middle East and Africa Fiber Optic Test Equipment Industry Revenue Share (%), by Equipment Type 2025 & 2033
- Figure 66: Middle East and Africa Fiber Optic Test Equipment Industry Volume Share (%), by Equipment Type 2025 & 2033
- Figure 67: Middle East and Africa Fiber Optic Test Equipment Industry Revenue (Million), by End-user Application 2025 & 2033
- Figure 68: Middle East and Africa Fiber Optic Test Equipment Industry Volume (K Unit), by End-user Application 2025 & 2033
- Figure 69: Middle East and Africa Fiber Optic Test Equipment Industry Revenue Share (%), by End-user Application 2025 & 2033
- Figure 70: Middle East and Africa Fiber Optic Test Equipment Industry Volume Share (%), by End-user Application 2025 & 2033
- Figure 71: Middle East and Africa Fiber Optic Test Equipment Industry Revenue (Million), by Country 2025 & 2033
- Figure 72: Middle East and Africa Fiber Optic Test Equipment Industry Volume (K Unit), by Country 2025 & 2033
- Figure 73: Middle East and Africa Fiber Optic Test Equipment Industry Revenue Share (%), by Country 2025 & 2033
- Figure 74: Middle East and Africa Fiber Optic Test Equipment Industry Volume Share (%), by Country 2025 & 2033
List of Tables
- Table 1: Global Fiber Optic Test Equipment Industry Revenue Million Forecast, by Equipment Type 2020 & 2033
- Table 2: Global Fiber Optic Test Equipment Industry Volume K Unit Forecast, by Equipment Type 2020 & 2033
- Table 3: Global Fiber Optic Test Equipment Industry Revenue Million Forecast, by End-user Application 2020 & 2033
- Table 4: Global Fiber Optic Test Equipment Industry Volume K Unit Forecast, by End-user Application 2020 & 2033
- Table 5: Global Fiber Optic Test Equipment Industry Revenue Million Forecast, by Region 2020 & 2033
- Table 6: Global Fiber Optic Test Equipment Industry Volume K Unit Forecast, by Region 2020 & 2033
- Table 7: Global Fiber Optic Test Equipment Industry Revenue Million Forecast, by Equipment Type 2020 & 2033
- Table 8: Global Fiber Optic Test Equipment Industry Volume K Unit Forecast, by Equipment Type 2020 & 2033
- Table 9: Global Fiber Optic Test Equipment Industry Revenue Million Forecast, by End-user Application 2020 & 2033
- Table 10: Global Fiber Optic Test Equipment Industry Volume K Unit Forecast, by End-user Application 2020 & 2033
- Table 11: Global Fiber Optic Test Equipment Industry Revenue Million Forecast, by Country 2020 & 2033
- Table 12: Global Fiber Optic Test Equipment Industry Volume K Unit Forecast, by Country 2020 & 2033
- Table 13: United States Fiber Optic Test Equipment Industry Revenue (Million) Forecast, by Application 2020 & 2033
- Table 14: United States Fiber Optic Test Equipment Industry Volume (K Unit) Forecast, by Application 2020 & 2033
- Table 15: Canada Fiber Optic Test Equipment Industry Revenue (Million) Forecast, by Application 2020 & 2033
- Table 16: Canada Fiber Optic Test Equipment Industry Volume (K Unit) Forecast, by Application 2020 & 2033
- Table 17: Global Fiber Optic Test Equipment Industry Revenue Million Forecast, by Equipment Type 2020 & 2033
- Table 18: Global Fiber Optic Test Equipment Industry Volume K Unit Forecast, by Equipment Type 2020 & 2033
- Table 19: Global Fiber Optic Test Equipment Industry Revenue Million Forecast, by End-user Application 2020 & 2033
- Table 20: Global Fiber Optic Test Equipment Industry Volume K Unit Forecast, by End-user Application 2020 & 2033
- Table 21: Global Fiber Optic Test Equipment Industry Revenue Million Forecast, by Country 2020 & 2033
- Table 22: Global Fiber Optic Test Equipment Industry Volume K Unit Forecast, by Country 2020 & 2033
- Table 23: Germany Fiber Optic Test Equipment Industry Revenue (Million) Forecast, by Application 2020 & 2033
- Table 24: Germany Fiber Optic Test Equipment Industry Volume (K Unit) Forecast, by Application 2020 & 2033
- Table 25: United Kingdom Fiber Optic Test Equipment Industry Revenue (Million) Forecast, by Application 2020 & 2033
- Table 26: United Kingdom Fiber Optic Test Equipment Industry Volume (K Unit) Forecast, by Application 2020 & 2033
- Table 27: France Fiber Optic Test Equipment Industry Revenue (Million) Forecast, by Application 2020 & 2033
- Table 28: France Fiber Optic Test Equipment Industry Volume (K Unit) Forecast, by Application 2020 & 2033
- Table 29: Global Fiber Optic Test Equipment Industry Revenue Million Forecast, by Equipment Type 2020 & 2033
- Table 30: Global Fiber Optic Test Equipment Industry Volume K Unit Forecast, by Equipment Type 2020 & 2033
- Table 31: Global Fiber Optic Test Equipment Industry Revenue Million Forecast, by End-user Application 2020 & 2033
- Table 32: Global Fiber Optic Test Equipment Industry Volume K Unit Forecast, by End-user Application 2020 & 2033
- Table 33: Global Fiber Optic Test Equipment Industry Revenue Million Forecast, by Country 2020 & 2033
- Table 34: Global Fiber Optic Test Equipment Industry Volume K Unit Forecast, by Country 2020 & 2033
- Table 35: China Fiber Optic Test Equipment Industry Revenue (Million) Forecast, by Application 2020 & 2033
- Table 36: China Fiber Optic Test Equipment Industry Volume (K Unit) Forecast, by Application 2020 & 2033
- Table 37: Japan Fiber Optic Test Equipment Industry Revenue (Million) Forecast, by Application 2020 & 2033
- Table 38: Japan Fiber Optic Test Equipment Industry Volume (K Unit) Forecast, by Application 2020 & 2033
- Table 39: India Fiber Optic Test Equipment Industry Revenue (Million) Forecast, by Application 2020 & 2033
- Table 40: India Fiber Optic Test Equipment Industry Volume (K Unit) Forecast, by Application 2020 & 2033
- Table 41: Global Fiber Optic Test Equipment Industry Revenue Million Forecast, by Equipment Type 2020 & 2033
- Table 42: Global Fiber Optic Test Equipment Industry Volume K Unit Forecast, by Equipment Type 2020 & 2033
- Table 43: Global Fiber Optic Test Equipment Industry Revenue Million Forecast, by End-user Application 2020 & 2033
- Table 44: Global Fiber Optic Test Equipment Industry Volume K Unit Forecast, by End-user Application 2020 & 2033
- Table 45: Global Fiber Optic Test Equipment Industry Revenue Million Forecast, by Country 2020 & 2033
- Table 46: Global Fiber Optic Test Equipment Industry Volume K Unit Forecast, by Country 2020 & 2033
- Table 47: Global Fiber Optic Test Equipment Industry Revenue Million Forecast, by Equipment Type 2020 & 2033
- Table 48: Global Fiber Optic Test Equipment Industry Volume K Unit Forecast, by Equipment Type 2020 & 2033
- Table 49: Global Fiber Optic Test Equipment Industry Revenue Million Forecast, by End-user Application 2020 & 2033
- Table 50: Global Fiber Optic Test Equipment Industry Volume K Unit Forecast, by End-user Application 2020 & 2033
- Table 51: Global Fiber Optic Test Equipment Industry Revenue Million Forecast, by Country 2020 & 2033
- Table 52: Global Fiber Optic Test Equipment Industry Volume K Unit Forecast, by Country 2020 & 2033
- Table 53: Brazil Fiber Optic Test Equipment Industry Revenue (Million) Forecast, by Application 2020 & 2033
- Table 54: Brazil Fiber Optic Test Equipment Industry Volume (K Unit) Forecast, by Application 2020 & 2033
- Table 55: Argentina Fiber Optic Test Equipment Industry Revenue (Million) Forecast, by Application 2020 & 2033
- Table 56: Argentina Fiber Optic Test Equipment Industry Volume (K Unit) Forecast, by Application 2020 & 2033
- Table 57: Mexico Fiber Optic Test Equipment Industry Revenue (Million) Forecast, by Application 2020 & 2033
- Table 58: Mexico Fiber Optic Test Equipment Industry Volume (K Unit) Forecast, by Application 2020 & 2033
- Table 59: Global Fiber Optic Test Equipment Industry Revenue Million Forecast, by Equipment Type 2020 & 2033
- Table 60: Global Fiber Optic Test Equipment Industry Volume K Unit Forecast, by Equipment Type 2020 & 2033
- Table 61: Global Fiber Optic Test Equipment Industry Revenue Million Forecast, by End-user Application 2020 & 2033
- Table 62: Global Fiber Optic Test Equipment Industry Volume K Unit Forecast, by End-user Application 2020 & 2033
- Table 63: Global Fiber Optic Test Equipment Industry Revenue Million Forecast, by Country 2020 & 2033
- Table 64: Global Fiber Optic Test Equipment Industry Volume K Unit Forecast, by Country 2020 & 2033
- Table 65: United Arab Emirates Fiber Optic Test Equipment Industry Revenue (Million) Forecast, by Application 2020 & 2033
- Table 66: United Arab Emirates Fiber Optic Test Equipment Industry Volume (K Unit) Forecast, by Application 2020 & 2033
- Table 67: South Africa Fiber Optic Test Equipment Industry Revenue (Million) Forecast, by Application 2020 & 2033
- Table 68: South Africa Fiber Optic Test Equipment Industry Volume (K Unit) Forecast, by Application 2020 & 2033
Frequently Asked Questions
1. What is the projected Compound Annual Growth Rate (CAGR) of the Fiber Optic Test Equipment Industry?
The projected CAGR is approximately 6.50%.
2. Which companies are prominent players in the Fiber Optic Test Equipment Industry?
Key companies in the market include Kingfisher International, Terahertz Technologies Inc (Trends Networks), Anritsu Corporation, VIAVI Solutions Inc, AFL Global, Pelorus Technologies Pvt Ltd, EXFO Inc, Yokogawa Electric Corporation, AMS Technologies A, Deviser Instruments, Fluke Networks, VeEX Inc.
3. What are the main segments of the Fiber Optic Test Equipment Industry?
The market segments include Equipment Type, End-user Application.
4. Can you provide details about the market size?
The market size is estimated to be USD 1.10 Million as of 2022.
5. What are some drivers contributing to market growth?
Increasing Penetration of 5G/LTE Networks and Fixed Broadband Subscription; Growing Adoption of fiber optic networks for power and utility management. Security. and Communication.
6. What are the notable trends driving market growth?
Telecommunications to Witness Significant Growth.
7. Are there any restraints impacting market growth?
High Cost of Testers and Fiber Optic Test Equipment; Lack of Awareness and Technical Knowledge.
8. Can you provide examples of recent developments in the market?
March 2024 - VeEX Inc. unveiled the RXT- 6800 Advanced 800G Multiservice test module. Based on the RXT-6400400G high-speed test module, the RXT6800 provides the flexibility to test existing interfaces up to a maximum of 800G. This new module is the industry's smallest, most versatile, and most portable 800G field test solution.
9. What pricing options are available for accessing the report?
Pricing options include single-user, multi-user, and enterprise licenses priced at USD 4750, USD 5250, and USD 8750 respectively.
10. Is the market size provided in terms of value or volume?
The market size is provided in terms of value, measured in Million and volume, measured in K Unit.
11. Are there any specific market keywords associated with the report?
Yes, the market keyword associated with the report is "Fiber Optic Test Equipment Industry," which aids in identifying and referencing the specific market segment covered.
12. How do I determine which pricing option suits my needs best?
The pricing options vary based on user requirements and access needs. Individual users may opt for single-user licenses, while businesses requiring broader access may choose multi-user or enterprise licenses for cost-effective access to the report.
13. Are there any additional resources or data provided in the Fiber Optic Test Equipment Industry report?
While the report offers comprehensive insights, it's advisable to review the specific contents or supplementary materials provided to ascertain if additional resources or data are available.
14. How can I stay updated on further developments or reports in the Fiber Optic Test Equipment Industry?
To stay informed about further developments, trends, and reports in the Fiber Optic Test Equipment Industry, consider subscribing to industry newsletters, following relevant companies and organizations, or regularly checking reputable industry news sources and publications.
Methodology
Step 1 - Identification of Relevant Samples Size from Population Database


Step 2 - Approaches for Defining Global Market Size (Value, Volume* & Price*)

Note*: In applicable scenarios
Step 3 - Data Sources
Primary Research
- Web Analytics
- Survey Reports
- Research Institute
- Latest Research Reports
- Opinion Leaders
Secondary Research
- Annual Reports
- White Paper
- Latest Press Release
- Industry Association
- Paid Database
- Investor Presentations

Step 4 - Data Triangulation
Involves using different sources of information in order to increase the validity of a study
These sources are likely to be stakeholders in a program - participants, other researchers, program staff, other community members, and so on.
Then we put all data in single framework & apply various statistical tools to find out the dynamic on the market.
During the analysis stage, feedback from the stakeholder groups would be compared to determine areas of agreement as well as areas of divergence