

Key Insights
The global finished steel products market is poised for significant expansion, propelled by robust demand from the construction, transportation, and energy sectors. This market is projected to achieve a market size of 510.92 billion by 2033, exhibiting a Compound Annual Growth Rate (CAGR) of approximately 4.5% from the base year 2025. Key growth drivers include escalating global infrastructure development, particularly in rapidly urbanizing and industrializing emerging economies. The increasing need for durable and cost-effective materials in automotive manufacturing and construction further stimulates demand. Advancements in steel production, emphasizing efficiency and sustainability, also contribute to positive market momentum. While raw material price volatility and economic uncertainties present potential challenges, the fundamental demand for steel across critical industries ensures a promising long-term outlook. The market is segmented by process (hot-rolling, cold-rolling, forging, others), end-user industry (transportation, construction, energy, packaging, electronics, others), and form (plate, strip, rod, profile, tube, wire, others), presenting diverse investment opportunities. Leading players such as ArcelorMittal, Tata Steel, and POSCO maintain substantial market shares through their extensive production capabilities and global presence. Asia-Pacific demonstrates strong growth, largely influenced by China and India's expanding industrial sectors, while North America and Europe exhibit stable, slower growth.
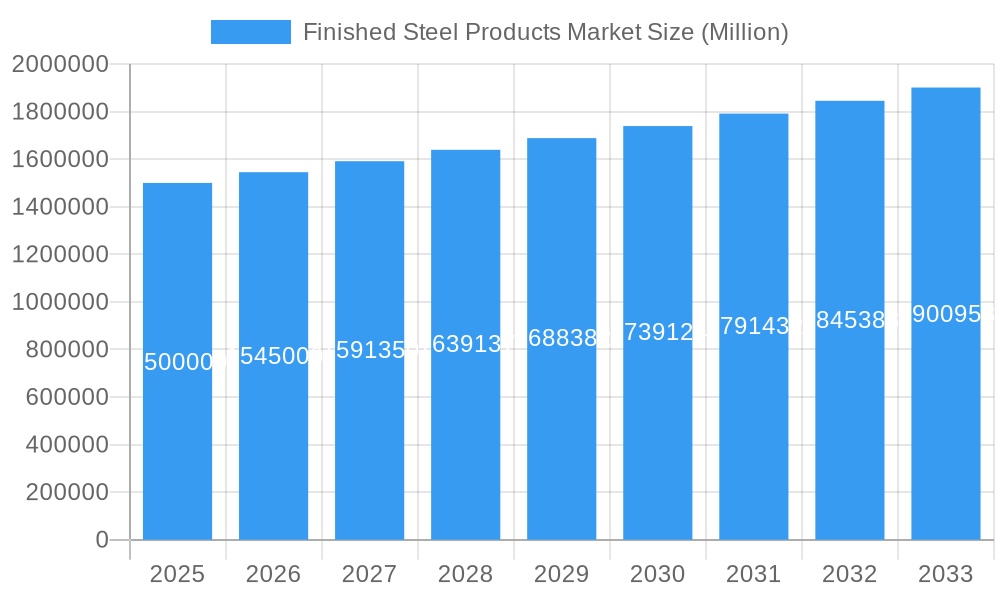
Finished Steel Products Market Market Size (In Billion)
The competitive environment features a blend of established multinational corporations and regional entities. Strategic consolidations and partnerships are anticipated to optimize supply chains and broaden market reach. Market penetration strategies vary by region and target industry. Innovation in steel grades and manufacturing processes is essential for competitive advantage. Furthermore, the growing emphasis on circular economy principles and recycled steel is shaping long-term market dynamics, creating opportunities for sustainable practices. Understanding these intricate market factors is crucial for informed business decisions. Future success will depend on adapting to evolving demands through sustainability, technological innovation, and agile supply chain management.
Finished Steel Products Market Company Market Share
This comprehensive report offers in-depth analysis of the global Finished Steel Products Market, providing critical insights for industry professionals, investors, and strategic decision-makers. Covering the period from 2019 to 2033, with a base year of 2025, this report details market dynamics, growth drivers, challenges, and emerging opportunities. The market is meticulously segmented by process (Hot-Rolling, Cold-Rolling, Forging, Other Processes), end-user industry (Transportation, Construction, Energy, Containers and Packaging, Electrical and Electronics, Other End-user Industries), and form (Plate, Strip, Rod, Profile, Tube, Wire, Other Forms), enabling granular analysis for strategic planning. The market size is projected to reach 510.92 billion by 2033.
Finished Steel Products Market Market Structure & Innovation Trends
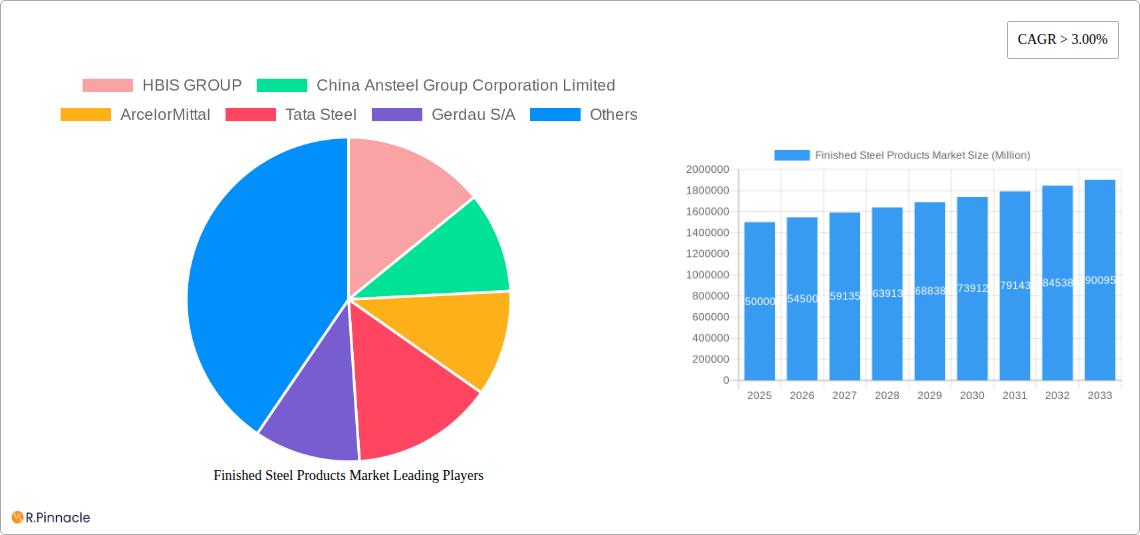
The Finished Steel Products market exhibits a moderately concentrated structure, with key players like HBIS GROUP, China Ansteel Group Corporation Limited, ArcelorMittal, and Tata Steel holding significant market share. While exact figures vary by segment, the top 10 players collectively account for an estimated 60% of the global market. Innovation is driven by the need for sustainable steel production, advancements in manufacturing processes, and evolving end-user demands. Regulatory frameworks focused on carbon emissions and safety standards significantly impact market dynamics. Product substitutes, such as advanced composites and aluminum alloys, pose a competitive challenge. Recent M&A activities, like ArcelorMittal's USD 120 Million investment in Boston Metal (January 2023), highlight the industry’s focus on green steel technologies and decarbonization. The total value of M&A deals in the sector between 2019 and 2024 is estimated at xx Million.
- Market Concentration: Top 10 players hold ~60% market share.
- Innovation Drivers: Sustainable steel production, process advancements, evolving end-user needs.
- Regulatory Landscape: Stringent environmental and safety regulations.
- Substitutes: Composites, aluminum alloys.
- M&A Activity: Significant investments in green steel technologies.
Finished Steel Products Market Market Dynamics & Trends
The Finished Steel Products market is experiencing robust growth, driven by increasing infrastructure development globally, particularly in emerging economies. The construction sector, a major end-user, is a key growth catalyst. The automotive and transportation sectors also fuel demand for high-strength and lightweight steel. Technological advancements, like the adoption of advanced steelmaking processes and automation, are boosting efficiency and reducing production costs. Consumer preferences for durable and sustainable products further influence market demand. Competitive dynamics are characterized by price competition, product differentiation, and strategic alliances. The market is projected to exhibit a CAGR of xx% during the forecast period (2025-2033), with market penetration expected to increase by xx% in key regions.
Dominant Regions & Segments in Finished Steel Products Market
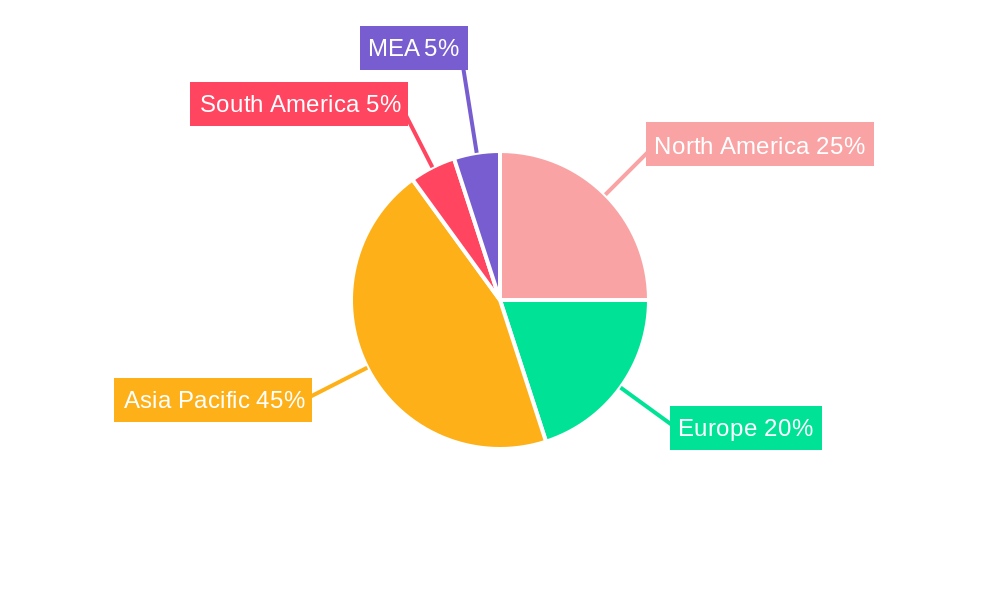
Asia-Pacific currently dominates the Finished Steel Products market, driven by robust economic growth, extensive infrastructure development, and a large manufacturing base. China and India are key contributors within this region.
- Leading Region: Asia-Pacific
- Key Drivers: Rapid economic growth, infrastructure development, large manufacturing base.
- Dominant Segments:
- Process: Hot-rolling maintains the largest market share due to its cost-effectiveness and widespread application across diverse end-user sectors.
- End-user Industry: Construction accounts for a significant share, with demand increasing alongside rising infrastructure investments globally.
- Form: Plate and strip dominate due to their versatility and wide range of applications in various sectors.
The high demand in construction for steel plates and strips, fueled by infrastructure projects in emerging markets, leads to this segment dominance. Economic policies supporting infrastructure investments in specific regions also significantly contribute.
Finished Steel Products Market Product Innovations
Recent product innovations focus on developing high-strength, lightweight, and sustainable steel grades to meet stringent environmental regulations and evolving end-user needs. These include advanced high-strength steels (AHSS) for automotive applications and green steel initiatives aimed at reducing carbon emissions during steel production. These advancements offer enhanced performance and environmental benefits, thus improving market fit and achieving a competitive edge.
Report Scope & Segmentation Analysis
This report segments the Finished Steel Products market by process (Hot-Rolling, Cold-Rolling, Forging, Other Processes), end-user industry (Transportation, Construction, Energy, Containers and Packaging, Electrical and Electronics, Other End-user Industries), and form (Plate, Strip, Rod, Profile, Tube, Wire, Other Forms). Each segment's growth projections, market sizes, and competitive dynamics are meticulously analyzed, providing a comprehensive understanding of the market landscape. Growth projections vary by segment, with hot-rolling and construction-related segments expected to show the highest growth rates.
Key Drivers of Finished Steel Products Market Growth
Growth in the Finished Steel Products market is fueled by several key factors: robust infrastructure development globally, particularly in emerging economies; increasing demand from the automotive, construction, and packaging sectors; advancements in steelmaking technologies leading to higher efficiency and lower costs; and government initiatives promoting sustainable steel production.
Challenges in the Finished Steel Products Market Sector
The Finished Steel Products market faces challenges including volatile raw material prices, fluctuations in global economic conditions, increasing environmental regulations requiring investment in cleaner technologies, and intense competition among steel manufacturers. These factors impact profitability and overall market growth, requiring continuous adaptation by industry players. For instance, the increasing price of iron ore can directly impact the final cost of steel products.
Emerging Opportunities in Finished Steel Products Market
Emerging opportunities lie in the growing demand for sustainable steel products, expansion into new markets, particularly in developing economies, and the development of innovative applications for advanced steel grades in emerging sectors like renewable energy and aerospace. Technological advancements in steel processing and automation offer further opportunities for growth and efficiency improvements.
Leading Players in the Finished Steel Products Market Market
- HBIS GROUP
- China Ansteel Group Corporation Limited
- ArcelorMittal
- Tata Steel
- Gerdau S/A
- POSCO
- Jiangsu Shagang Group
- United States Steel
- Nucor
- Baosteel Group
- NIPPON STEEL CORPORATION
- JFE Steel Corporation
Key Developments in Finished Steel Products Market Industry
- January 2023: ArcelorMittal invested USD 120 Million in Boston Metal to accelerate the development of green steel technologies. This investment signifies a major step towards reducing the carbon footprint of steel production and aligns with the growing global focus on sustainability.
- March 2022: Schnitzer Steel Industries launched GRN Steel™, a line of net-zero carbon steel products, highlighting the industry's efforts to meet growing demands for environmentally friendly materials. This launch represents a significant step in offering sustainable steel products to consumers.
Future Outlook for Finished Steel Products Market Market
The future outlook for the Finished Steel Products market remains positive, driven by continued growth in infrastructure development, urbanization, and the increasing adoption of sustainable and technologically advanced steel products. Strategic investments in research and development, along with collaborations across the value chain, will further unlock growth potential and shape the future of the industry. The market's future growth will be significantly influenced by the success of green steel initiatives and the broader adoption of sustainable practices within the industry.
Finished Steel Products Market Segmentation
-
1. Form
- 1.1. Plate
- 1.2. Strip
- 1.3. Rod
- 1.4. Profile
- 1.5. Tube
- 1.6. Wire
- 1.7. Other Forms
-
2. Process
- 2.1. Hot-Rolling
- 2.2. Cold-Rolling
- 2.3. Forging
- 2.4. Other Processes
-
3. End-user Industry
- 3.1. Transportation
- 3.2. Construction
- 3.3. Energy
- 3.4. Containers and Packaging
- 3.5. Electrical and Electronics
- 3.6. Other End-user Industries
Finished Steel Products Market Segmentation By Geography
-
1. Asia Pacific
- 1.1. China
- 1.2. India
- 1.3. Japan
- 1.4. South Korea
- 1.5. Rest of Asia Pacific
-
2. North America
- 2.1. United States
- 2.2. Canada
- 2.3. Mexico
-
3. Europe
- 3.1. Germany
- 3.2. United Kingdom
- 3.3. Italy
- 3.4. France
- 3.5. Spain
- 3.6. Rest of Europe
-
4. South America
- 4.1. Brazil
- 4.2. Argentina
- 4.3. Rest of South America
-
5. Middle East and Africa
- 5.1. Saudi Arabia
- 5.2. South Africa
- 5.3. Rest of Middle East and Africa
Finished Steel Products Market Regional Market Share
Geographic Coverage of Finished Steel Products Market
Finished Steel Products Market REPORT HIGHLIGHTS
| Aspects | Details |
|---|---|
| Study Period | 2020-2034 |
| Base Year | 2025 |
| Estimated Year | 2026 |
| Forecast Period | 2026-2034 |
| Historical Period | 2020-2025 |
| Growth Rate | CAGR of 4.5% from 2020-2034 |
| Segmentation |
|
Table of Contents
- 1. Introduction
- 1.1. Research Scope
- 1.2. Market Segmentation
- 1.3. Research Objective
- 1.4. Definitions and Assumptions
- 2. Executive Summary
- 2.1. Market Snapshot
- 3. Market Dynamics
- 3.1. Market Drivers
- 3.2. Market Restrains
- 3.3. Market Trends
- 3.4. Market Opportunities
- 4. Market Factor Analysis
- 4.1. Porters Five Forces
- 4.1.1. Bargaining Power of Suppliers
- 4.1.2. Bargaining Power of Buyers
- 4.1.3. Threat of New Entrants
- 4.1.4. Threat of Substitutes
- 4.1.5. Competitive Rivalry
- 4.2. PESTEL analysis
- 4.3. BCG Analysis
- 4.3.1. Stars (High Growth, High Market Share)
- 4.3.2. Cash Cows (Low Growth, High Market Share)
- 4.3.3. Question Mark (High Growth, Low Market Share)
- 4.3.4. Dogs (Low Growth, Low Market Share)
- 4.4. Ansoff Matrix Analysis
- 4.5. Supply Chain Analysis
- 4.6. Regulatory Landscape
- 4.7. Current Market Potential and Opportunity Assessment (TAM–SAM–SOM Framework)
- 4.8. PRI Analyst Note
- 4.1. Porters Five Forces
- 5. Market Analysis, Insights and Forecast 2021-2033
- 5.1. Market Analysis, Insights and Forecast - by Form
- 5.1.1. Plate
- 5.1.2. Strip
- 5.1.3. Rod
- 5.1.4. Profile
- 5.1.5. Tube
- 5.1.6. Wire
- 5.1.7. Other Forms
- 5.2. Market Analysis, Insights and Forecast - by Process
- 5.2.1. Hot-Rolling
- 5.2.2. Cold-Rolling
- 5.2.3. Forging
- 5.2.4. Other Processes
- 5.3. Market Analysis, Insights and Forecast - by End-user Industry
- 5.3.1. Transportation
- 5.3.2. Construction
- 5.3.3. Energy
- 5.3.4. Containers and Packaging
- 5.3.5. Electrical and Electronics
- 5.3.6. Other End-user Industries
- 5.4. Market Analysis, Insights and Forecast - by Region
- 5.4.1. Asia Pacific
- 5.4.2. North America
- 5.4.3. Europe
- 5.4.4. South America
- 5.4.5. Middle East and Africa
- 5.1. Market Analysis, Insights and Forecast - by Form
- 6. Global Finished Steel Products Market Analysis, Insights and Forecast, 2021-2033
- 6.1. Market Analysis, Insights and Forecast - by Form
- 6.1.1. Plate
- 6.1.2. Strip
- 6.1.3. Rod
- 6.1.4. Profile
- 6.1.5. Tube
- 6.1.6. Wire
- 6.1.7. Other Forms
- 6.2. Market Analysis, Insights and Forecast - by Process
- 6.2.1. Hot-Rolling
- 6.2.2. Cold-Rolling
- 6.2.3. Forging
- 6.2.4. Other Processes
- 6.3. Market Analysis, Insights and Forecast - by End-user Industry
- 6.3.1. Transportation
- 6.3.2. Construction
- 6.3.3. Energy
- 6.3.4. Containers and Packaging
- 6.3.5. Electrical and Electronics
- 6.3.6. Other End-user Industries
- 6.1. Market Analysis, Insights and Forecast - by Form
- 7. Asia Pacific Finished Steel Products Market Analysis, Insights and Forecast, 2020-2032
- 7.1. Market Analysis, Insights and Forecast - by Form
- 7.1.1. Plate
- 7.1.2. Strip
- 7.1.3. Rod
- 7.1.4. Profile
- 7.1.5. Tube
- 7.1.6. Wire
- 7.1.7. Other Forms
- 7.2. Market Analysis, Insights and Forecast - by Process
- 7.2.1. Hot-Rolling
- 7.2.2. Cold-Rolling
- 7.2.3. Forging
- 7.2.4. Other Processes
- 7.3. Market Analysis, Insights and Forecast - by End-user Industry
- 7.3.1. Transportation
- 7.3.2. Construction
- 7.3.3. Energy
- 7.3.4. Containers and Packaging
- 7.3.5. Electrical and Electronics
- 7.3.6. Other End-user Industries
- 7.1. Market Analysis, Insights and Forecast - by Form
- 8. North America Finished Steel Products Market Analysis, Insights and Forecast, 2020-2032
- 8.1. Market Analysis, Insights and Forecast - by Form
- 8.1.1. Plate
- 8.1.2. Strip
- 8.1.3. Rod
- 8.1.4. Profile
- 8.1.5. Tube
- 8.1.6. Wire
- 8.1.7. Other Forms
- 8.2. Market Analysis, Insights and Forecast - by Process
- 8.2.1. Hot-Rolling
- 8.2.2. Cold-Rolling
- 8.2.3. Forging
- 8.2.4. Other Processes
- 8.3. Market Analysis, Insights and Forecast - by End-user Industry
- 8.3.1. Transportation
- 8.3.2. Construction
- 8.3.3. Energy
- 8.3.4. Containers and Packaging
- 8.3.5. Electrical and Electronics
- 8.3.6. Other End-user Industries
- 8.1. Market Analysis, Insights and Forecast - by Form
- 9. Europe Finished Steel Products Market Analysis, Insights and Forecast, 2020-2032
- 9.1. Market Analysis, Insights and Forecast - by Form
- 9.1.1. Plate
- 9.1.2. Strip
- 9.1.3. Rod
- 9.1.4. Profile
- 9.1.5. Tube
- 9.1.6. Wire
- 9.1.7. Other Forms
- 9.2. Market Analysis, Insights and Forecast - by Process
- 9.2.1. Hot-Rolling
- 9.2.2. Cold-Rolling
- 9.2.3. Forging
- 9.2.4. Other Processes
- 9.3. Market Analysis, Insights and Forecast - by End-user Industry
- 9.3.1. Transportation
- 9.3.2. Construction
- 9.3.3. Energy
- 9.3.4. Containers and Packaging
- 9.3.5. Electrical and Electronics
- 9.3.6. Other End-user Industries
- 9.1. Market Analysis, Insights and Forecast - by Form
- 10. South America Finished Steel Products Market Analysis, Insights and Forecast, 2020-2032
- 10.1. Market Analysis, Insights and Forecast - by Form
- 10.1.1. Plate
- 10.1.2. Strip
- 10.1.3. Rod
- 10.1.4. Profile
- 10.1.5. Tube
- 10.1.6. Wire
- 10.1.7. Other Forms
- 10.2. Market Analysis, Insights and Forecast - by Process
- 10.2.1. Hot-Rolling
- 10.2.2. Cold-Rolling
- 10.2.3. Forging
- 10.2.4. Other Processes
- 10.3. Market Analysis, Insights and Forecast - by End-user Industry
- 10.3.1. Transportation
- 10.3.2. Construction
- 10.3.3. Energy
- 10.3.4. Containers and Packaging
- 10.3.5. Electrical and Electronics
- 10.3.6. Other End-user Industries
- 10.1. Market Analysis, Insights and Forecast - by Form
- 11. Middle East and Africa Finished Steel Products Market Analysis, Insights and Forecast, 2020-2032
- 11.1. Market Analysis, Insights and Forecast - by Form
- 11.1.1. Plate
- 11.1.2. Strip
- 11.1.3. Rod
- 11.1.4. Profile
- 11.1.5. Tube
- 11.1.6. Wire
- 11.1.7. Other Forms
- 11.2. Market Analysis, Insights and Forecast - by Process
- 11.2.1. Hot-Rolling
- 11.2.2. Cold-Rolling
- 11.2.3. Forging
- 11.2.4. Other Processes
- 11.3. Market Analysis, Insights and Forecast - by End-user Industry
- 11.3.1. Transportation
- 11.3.2. Construction
- 11.3.3. Energy
- 11.3.4. Containers and Packaging
- 11.3.5. Electrical and Electronics
- 11.3.6. Other End-user Industries
- 11.1. Market Analysis, Insights and Forecast - by Form
- 12. Competitive Analysis
- 12.1. Company Profiles
- 12.1.1 HBIS GROUP
- 12.1.1.1. Company Overview
- 12.1.1.2. Products
- 12.1.1.3. Company Financials
- 12.1.1.4. SWOT Analysis
- 12.1.2 China Ansteel Group Corporation Limited
- 12.1.2.1. Company Overview
- 12.1.2.2. Products
- 12.1.2.3. Company Financials
- 12.1.2.4. SWOT Analysis
- 12.1.3 ArcelorMittal
- 12.1.3.1. Company Overview
- 12.1.3.2. Products
- 12.1.3.3. Company Financials
- 12.1.3.4. SWOT Analysis
- 12.1.4 Tata Steel
- 12.1.4.1. Company Overview
- 12.1.4.2. Products
- 12.1.4.3. Company Financials
- 12.1.4.4. SWOT Analysis
- 12.1.5 Gerdau S/A
- 12.1.5.1. Company Overview
- 12.1.5.2. Products
- 12.1.5.3. Company Financials
- 12.1.5.4. SWOT Analysis
- 12.1.6 POSCO
- 12.1.6.1. Company Overview
- 12.1.6.2. Products
- 12.1.6.3. Company Financials
- 12.1.6.4. SWOT Analysis
- 12.1.7 Jiangsu Shagang Group
- 12.1.7.1. Company Overview
- 12.1.7.2. Products
- 12.1.7.3. Company Financials
- 12.1.7.4. SWOT Analysis
- 12.1.8 United States Steel
- 12.1.8.1. Company Overview
- 12.1.8.2. Products
- 12.1.8.3. Company Financials
- 12.1.8.4. SWOT Analysis
- 12.1.9 Nucor
- 12.1.9.1. Company Overview
- 12.1.9.2. Products
- 12.1.9.3. Company Financials
- 12.1.9.4. SWOT Analysis
- 12.1.10 Baosteel Group
- 12.1.10.1. Company Overview
- 12.1.10.2. Products
- 12.1.10.3. Company Financials
- 12.1.10.4. SWOT Analysis
- 12.1.11 NIPPON STEEL CORPORATION
- 12.1.11.1. Company Overview
- 12.1.11.2. Products
- 12.1.11.3. Company Financials
- 12.1.11.4. SWOT Analysis
- 12.1.12 JFE Steel Corporation
- 12.1.12.1. Company Overview
- 12.1.12.2. Products
- 12.1.12.3. Company Financials
- 12.1.12.4. SWOT Analysis
- 12.1.1 HBIS GROUP
- 12.2. Market Entropy
- 12.2.1 Company's Key Areas Served
- 12.2.2 Recent Developments
- 12.3. Company Market Share Analysis 2025
- 12.3.1 Top 5 Companies Market Share Analysis
- 12.3.2 Top 3 Companies Market Share Analysis
- 12.4. List of Potential Customers
- 13. Research Methodology
List of Figures
- Figure 1: Global Finished Steel Products Market Revenue Breakdown (billion, %) by Region 2025 & 2033
- Figure 2: Global Finished Steel Products Market Volume Breakdown (K Tons, %) by Region 2025 & 2033
- Figure 3: Asia Pacific Finished Steel Products Market Revenue (billion), by Form 2025 & 2033
- Figure 4: Asia Pacific Finished Steel Products Market Volume (K Tons), by Form 2025 & 2033
- Figure 5: Asia Pacific Finished Steel Products Market Revenue Share (%), by Form 2025 & 2033
- Figure 6: Asia Pacific Finished Steel Products Market Volume Share (%), by Form 2025 & 2033
- Figure 7: Asia Pacific Finished Steel Products Market Revenue (billion), by Process 2025 & 2033
- Figure 8: Asia Pacific Finished Steel Products Market Volume (K Tons), by Process 2025 & 2033
- Figure 9: Asia Pacific Finished Steel Products Market Revenue Share (%), by Process 2025 & 2033
- Figure 10: Asia Pacific Finished Steel Products Market Volume Share (%), by Process 2025 & 2033
- Figure 11: Asia Pacific Finished Steel Products Market Revenue (billion), by End-user Industry 2025 & 2033
- Figure 12: Asia Pacific Finished Steel Products Market Volume (K Tons), by End-user Industry 2025 & 2033
- Figure 13: Asia Pacific Finished Steel Products Market Revenue Share (%), by End-user Industry 2025 & 2033
- Figure 14: Asia Pacific Finished Steel Products Market Volume Share (%), by End-user Industry 2025 & 2033
- Figure 15: Asia Pacific Finished Steel Products Market Revenue (billion), by Country 2025 & 2033
- Figure 16: Asia Pacific Finished Steel Products Market Volume (K Tons), by Country 2025 & 2033
- Figure 17: Asia Pacific Finished Steel Products Market Revenue Share (%), by Country 2025 & 2033
- Figure 18: Asia Pacific Finished Steel Products Market Volume Share (%), by Country 2025 & 2033
- Figure 19: North America Finished Steel Products Market Revenue (billion), by Form 2025 & 2033
- Figure 20: North America Finished Steel Products Market Volume (K Tons), by Form 2025 & 2033
- Figure 21: North America Finished Steel Products Market Revenue Share (%), by Form 2025 & 2033
- Figure 22: North America Finished Steel Products Market Volume Share (%), by Form 2025 & 2033
- Figure 23: North America Finished Steel Products Market Revenue (billion), by Process 2025 & 2033
- Figure 24: North America Finished Steel Products Market Volume (K Tons), by Process 2025 & 2033
- Figure 25: North America Finished Steel Products Market Revenue Share (%), by Process 2025 & 2033
- Figure 26: North America Finished Steel Products Market Volume Share (%), by Process 2025 & 2033
- Figure 27: North America Finished Steel Products Market Revenue (billion), by End-user Industry 2025 & 2033
- Figure 28: North America Finished Steel Products Market Volume (K Tons), by End-user Industry 2025 & 2033
- Figure 29: North America Finished Steel Products Market Revenue Share (%), by End-user Industry 2025 & 2033
- Figure 30: North America Finished Steel Products Market Volume Share (%), by End-user Industry 2025 & 2033
- Figure 31: North America Finished Steel Products Market Revenue (billion), by Country 2025 & 2033
- Figure 32: North America Finished Steel Products Market Volume (K Tons), by Country 2025 & 2033
- Figure 33: North America Finished Steel Products Market Revenue Share (%), by Country 2025 & 2033
- Figure 34: North America Finished Steel Products Market Volume Share (%), by Country 2025 & 2033
- Figure 35: Europe Finished Steel Products Market Revenue (billion), by Form 2025 & 2033
- Figure 36: Europe Finished Steel Products Market Volume (K Tons), by Form 2025 & 2033
- Figure 37: Europe Finished Steel Products Market Revenue Share (%), by Form 2025 & 2033
- Figure 38: Europe Finished Steel Products Market Volume Share (%), by Form 2025 & 2033
- Figure 39: Europe Finished Steel Products Market Revenue (billion), by Process 2025 & 2033
- Figure 40: Europe Finished Steel Products Market Volume (K Tons), by Process 2025 & 2033
- Figure 41: Europe Finished Steel Products Market Revenue Share (%), by Process 2025 & 2033
- Figure 42: Europe Finished Steel Products Market Volume Share (%), by Process 2025 & 2033
- Figure 43: Europe Finished Steel Products Market Revenue (billion), by End-user Industry 2025 & 2033
- Figure 44: Europe Finished Steel Products Market Volume (K Tons), by End-user Industry 2025 & 2033
- Figure 45: Europe Finished Steel Products Market Revenue Share (%), by End-user Industry 2025 & 2033
- Figure 46: Europe Finished Steel Products Market Volume Share (%), by End-user Industry 2025 & 2033
- Figure 47: Europe Finished Steel Products Market Revenue (billion), by Country 2025 & 2033
- Figure 48: Europe Finished Steel Products Market Volume (K Tons), by Country 2025 & 2033
- Figure 49: Europe Finished Steel Products Market Revenue Share (%), by Country 2025 & 2033
- Figure 50: Europe Finished Steel Products Market Volume Share (%), by Country 2025 & 2033
- Figure 51: South America Finished Steel Products Market Revenue (billion), by Form 2025 & 2033
- Figure 52: South America Finished Steel Products Market Volume (K Tons), by Form 2025 & 2033
- Figure 53: South America Finished Steel Products Market Revenue Share (%), by Form 2025 & 2033
- Figure 54: South America Finished Steel Products Market Volume Share (%), by Form 2025 & 2033
- Figure 55: South America Finished Steel Products Market Revenue (billion), by Process 2025 & 2033
- Figure 56: South America Finished Steel Products Market Volume (K Tons), by Process 2025 & 2033
- Figure 57: South America Finished Steel Products Market Revenue Share (%), by Process 2025 & 2033
- Figure 58: South America Finished Steel Products Market Volume Share (%), by Process 2025 & 2033
- Figure 59: South America Finished Steel Products Market Revenue (billion), by End-user Industry 2025 & 2033
- Figure 60: South America Finished Steel Products Market Volume (K Tons), by End-user Industry 2025 & 2033
- Figure 61: South America Finished Steel Products Market Revenue Share (%), by End-user Industry 2025 & 2033
- Figure 62: South America Finished Steel Products Market Volume Share (%), by End-user Industry 2025 & 2033
- Figure 63: South America Finished Steel Products Market Revenue (billion), by Country 2025 & 2033
- Figure 64: South America Finished Steel Products Market Volume (K Tons), by Country 2025 & 2033
- Figure 65: South America Finished Steel Products Market Revenue Share (%), by Country 2025 & 2033
- Figure 66: South America Finished Steel Products Market Volume Share (%), by Country 2025 & 2033
- Figure 67: Middle East and Africa Finished Steel Products Market Revenue (billion), by Form 2025 & 2033
- Figure 68: Middle East and Africa Finished Steel Products Market Volume (K Tons), by Form 2025 & 2033
- Figure 69: Middle East and Africa Finished Steel Products Market Revenue Share (%), by Form 2025 & 2033
- Figure 70: Middle East and Africa Finished Steel Products Market Volume Share (%), by Form 2025 & 2033
- Figure 71: Middle East and Africa Finished Steel Products Market Revenue (billion), by Process 2025 & 2033
- Figure 72: Middle East and Africa Finished Steel Products Market Volume (K Tons), by Process 2025 & 2033
- Figure 73: Middle East and Africa Finished Steel Products Market Revenue Share (%), by Process 2025 & 2033
- Figure 74: Middle East and Africa Finished Steel Products Market Volume Share (%), by Process 2025 & 2033
- Figure 75: Middle East and Africa Finished Steel Products Market Revenue (billion), by End-user Industry 2025 & 2033
- Figure 76: Middle East and Africa Finished Steel Products Market Volume (K Tons), by End-user Industry 2025 & 2033
- Figure 77: Middle East and Africa Finished Steel Products Market Revenue Share (%), by End-user Industry 2025 & 2033
- Figure 78: Middle East and Africa Finished Steel Products Market Volume Share (%), by End-user Industry 2025 & 2033
- Figure 79: Middle East and Africa Finished Steel Products Market Revenue (billion), by Country 2025 & 2033
- Figure 80: Middle East and Africa Finished Steel Products Market Volume (K Tons), by Country 2025 & 2033
- Figure 81: Middle East and Africa Finished Steel Products Market Revenue Share (%), by Country 2025 & 2033
- Figure 82: Middle East and Africa Finished Steel Products Market Volume Share (%), by Country 2025 & 2033
List of Tables
- Table 1: Global Finished Steel Products Market Revenue billion Forecast, by Form 2020 & 2033
- Table 2: Global Finished Steel Products Market Volume K Tons Forecast, by Form 2020 & 2033
- Table 3: Global Finished Steel Products Market Revenue billion Forecast, by Process 2020 & 2033
- Table 4: Global Finished Steel Products Market Volume K Tons Forecast, by Process 2020 & 2033
- Table 5: Global Finished Steel Products Market Revenue billion Forecast, by End-user Industry 2020 & 2033
- Table 6: Global Finished Steel Products Market Volume K Tons Forecast, by End-user Industry 2020 & 2033
- Table 7: Global Finished Steel Products Market Revenue billion Forecast, by Region 2020 & 2033
- Table 8: Global Finished Steel Products Market Volume K Tons Forecast, by Region 2020 & 2033
- Table 9: Global Finished Steel Products Market Revenue billion Forecast, by Form 2020 & 2033
- Table 10: Global Finished Steel Products Market Volume K Tons Forecast, by Form 2020 & 2033
- Table 11: Global Finished Steel Products Market Revenue billion Forecast, by Process 2020 & 2033
- Table 12: Global Finished Steel Products Market Volume K Tons Forecast, by Process 2020 & 2033
- Table 13: Global Finished Steel Products Market Revenue billion Forecast, by End-user Industry 2020 & 2033
- Table 14: Global Finished Steel Products Market Volume K Tons Forecast, by End-user Industry 2020 & 2033
- Table 15: Global Finished Steel Products Market Revenue billion Forecast, by Country 2020 & 2033
- Table 16: Global Finished Steel Products Market Volume K Tons Forecast, by Country 2020 & 2033
- Table 17: China Finished Steel Products Market Revenue (billion) Forecast, by Application 2020 & 2033
- Table 18: China Finished Steel Products Market Volume (K Tons) Forecast, by Application 2020 & 2033
- Table 19: India Finished Steel Products Market Revenue (billion) Forecast, by Application 2020 & 2033
- Table 20: India Finished Steel Products Market Volume (K Tons) Forecast, by Application 2020 & 2033
- Table 21: Japan Finished Steel Products Market Revenue (billion) Forecast, by Application 2020 & 2033
- Table 22: Japan Finished Steel Products Market Volume (K Tons) Forecast, by Application 2020 & 2033
- Table 23: South Korea Finished Steel Products Market Revenue (billion) Forecast, by Application 2020 & 2033
- Table 24: South Korea Finished Steel Products Market Volume (K Tons) Forecast, by Application 2020 & 2033
- Table 25: Rest of Asia Pacific Finished Steel Products Market Revenue (billion) Forecast, by Application 2020 & 2033
- Table 26: Rest of Asia Pacific Finished Steel Products Market Volume (K Tons) Forecast, by Application 2020 & 2033
- Table 27: Global Finished Steel Products Market Revenue billion Forecast, by Form 2020 & 2033
- Table 28: Global Finished Steel Products Market Volume K Tons Forecast, by Form 2020 & 2033
- Table 29: Global Finished Steel Products Market Revenue billion Forecast, by Process 2020 & 2033
- Table 30: Global Finished Steel Products Market Volume K Tons Forecast, by Process 2020 & 2033
- Table 31: Global Finished Steel Products Market Revenue billion Forecast, by End-user Industry 2020 & 2033
- Table 32: Global Finished Steel Products Market Volume K Tons Forecast, by End-user Industry 2020 & 2033
- Table 33: Global Finished Steel Products Market Revenue billion Forecast, by Country 2020 & 2033
- Table 34: Global Finished Steel Products Market Volume K Tons Forecast, by Country 2020 & 2033
- Table 35: United States Finished Steel Products Market Revenue (billion) Forecast, by Application 2020 & 2033
- Table 36: United States Finished Steel Products Market Volume (K Tons) Forecast, by Application 2020 & 2033
- Table 37: Canada Finished Steel Products Market Revenue (billion) Forecast, by Application 2020 & 2033
- Table 38: Canada Finished Steel Products Market Volume (K Tons) Forecast, by Application 2020 & 2033
- Table 39: Mexico Finished Steel Products Market Revenue (billion) Forecast, by Application 2020 & 2033
- Table 40: Mexico Finished Steel Products Market Volume (K Tons) Forecast, by Application 2020 & 2033
- Table 41: Global Finished Steel Products Market Revenue billion Forecast, by Form 2020 & 2033
- Table 42: Global Finished Steel Products Market Volume K Tons Forecast, by Form 2020 & 2033
- Table 43: Global Finished Steel Products Market Revenue billion Forecast, by Process 2020 & 2033
- Table 44: Global Finished Steel Products Market Volume K Tons Forecast, by Process 2020 & 2033
- Table 45: Global Finished Steel Products Market Revenue billion Forecast, by End-user Industry 2020 & 2033
- Table 46: Global Finished Steel Products Market Volume K Tons Forecast, by End-user Industry 2020 & 2033
- Table 47: Global Finished Steel Products Market Revenue billion Forecast, by Country 2020 & 2033
- Table 48: Global Finished Steel Products Market Volume K Tons Forecast, by Country 2020 & 2033
- Table 49: Germany Finished Steel Products Market Revenue (billion) Forecast, by Application 2020 & 2033
- Table 50: Germany Finished Steel Products Market Volume (K Tons) Forecast, by Application 2020 & 2033
- Table 51: United Kingdom Finished Steel Products Market Revenue (billion) Forecast, by Application 2020 & 2033
- Table 52: United Kingdom Finished Steel Products Market Volume (K Tons) Forecast, by Application 2020 & 2033
- Table 53: Italy Finished Steel Products Market Revenue (billion) Forecast, by Application 2020 & 2033
- Table 54: Italy Finished Steel Products Market Volume (K Tons) Forecast, by Application 2020 & 2033
- Table 55: France Finished Steel Products Market Revenue (billion) Forecast, by Application 2020 & 2033
- Table 56: France Finished Steel Products Market Volume (K Tons) Forecast, by Application 2020 & 2033
- Table 57: Spain Finished Steel Products Market Revenue (billion) Forecast, by Application 2020 & 2033
- Table 58: Spain Finished Steel Products Market Volume (K Tons) Forecast, by Application 2020 & 2033
- Table 59: Rest of Europe Finished Steel Products Market Revenue (billion) Forecast, by Application 2020 & 2033
- Table 60: Rest of Europe Finished Steel Products Market Volume (K Tons) Forecast, by Application 2020 & 2033
- Table 61: Global Finished Steel Products Market Revenue billion Forecast, by Form 2020 & 2033
- Table 62: Global Finished Steel Products Market Volume K Tons Forecast, by Form 2020 & 2033
- Table 63: Global Finished Steel Products Market Revenue billion Forecast, by Process 2020 & 2033
- Table 64: Global Finished Steel Products Market Volume K Tons Forecast, by Process 2020 & 2033
- Table 65: Global Finished Steel Products Market Revenue billion Forecast, by End-user Industry 2020 & 2033
- Table 66: Global Finished Steel Products Market Volume K Tons Forecast, by End-user Industry 2020 & 2033
- Table 67: Global Finished Steel Products Market Revenue billion Forecast, by Country 2020 & 2033
- Table 68: Global Finished Steel Products Market Volume K Tons Forecast, by Country 2020 & 2033
- Table 69: Brazil Finished Steel Products Market Revenue (billion) Forecast, by Application 2020 & 2033
- Table 70: Brazil Finished Steel Products Market Volume (K Tons) Forecast, by Application 2020 & 2033
- Table 71: Argentina Finished Steel Products Market Revenue (billion) Forecast, by Application 2020 & 2033
- Table 72: Argentina Finished Steel Products Market Volume (K Tons) Forecast, by Application 2020 & 2033
- Table 73: Rest of South America Finished Steel Products Market Revenue (billion) Forecast, by Application 2020 & 2033
- Table 74: Rest of South America Finished Steel Products Market Volume (K Tons) Forecast, by Application 2020 & 2033
- Table 75: Global Finished Steel Products Market Revenue billion Forecast, by Form 2020 & 2033
- Table 76: Global Finished Steel Products Market Volume K Tons Forecast, by Form 2020 & 2033
- Table 77: Global Finished Steel Products Market Revenue billion Forecast, by Process 2020 & 2033
- Table 78: Global Finished Steel Products Market Volume K Tons Forecast, by Process 2020 & 2033
- Table 79: Global Finished Steel Products Market Revenue billion Forecast, by End-user Industry 2020 & 2033
- Table 80: Global Finished Steel Products Market Volume K Tons Forecast, by End-user Industry 2020 & 2033
- Table 81: Global Finished Steel Products Market Revenue billion Forecast, by Country 2020 & 2033
- Table 82: Global Finished Steel Products Market Volume K Tons Forecast, by Country 2020 & 2033
- Table 83: Saudi Arabia Finished Steel Products Market Revenue (billion) Forecast, by Application 2020 & 2033
- Table 84: Saudi Arabia Finished Steel Products Market Volume (K Tons) Forecast, by Application 2020 & 2033
- Table 85: South Africa Finished Steel Products Market Revenue (billion) Forecast, by Application 2020 & 2033
- Table 86: South Africa Finished Steel Products Market Volume (K Tons) Forecast, by Application 2020 & 2033
- Table 87: Rest of Middle East and Africa Finished Steel Products Market Revenue (billion) Forecast, by Application 2020 & 2033
- Table 88: Rest of Middle East and Africa Finished Steel Products Market Volume (K Tons) Forecast, by Application 2020 & 2033
Frequently Asked Questions
1. What is the projected Compound Annual Growth Rate (CAGR) of the Finished Steel Products Market?
The projected CAGR is approximately 4.5%.
2. Which companies are prominent players in the Finished Steel Products Market?
Key companies in the market include HBIS GROUP, China Ansteel Group Corporation Limited, ArcelorMittal, Tata Steel, Gerdau S/A, POSCO, Jiangsu Shagang Group, United States Steel, Nucor, Baosteel Group, NIPPON STEEL CORPORATION, JFE Steel Corporation.
3. What are the main segments of the Finished Steel Products Market?
The market segments include Form, Process, End-user Industry.
4. Can you provide details about the market size?
The market size is estimated to be USD 510.92 billion as of 2022.
5. What are some drivers contributing to market growth?
Growing Demand from Construction Industry.
6. What are the notable trends driving market growth?
Increasing Usage in the Transportation Industry.
7. Are there any restraints impacting market growth?
Availability of Substitutes; Change in Properties with Temperature.
8. Can you provide examples of recent developments in the market?
January 2023: ArcelorMittal, a steel manufacturing company, invested USD 120 million in Boston Metal, a United States-based leading company working on decarbonizing the steelmaking process. The investment would help the startup launch green steel by 2026 and also help global companies reduce the heavy greenhouse gas emissions that come from the production of steel.
9. What pricing options are available for accessing the report?
Pricing options include single-user, multi-user, and enterprise licenses priced at USD 4750, USD 5250, and USD 8750 respectively.
10. Is the market size provided in terms of value or volume?
The market size is provided in terms of value, measured in billion and volume, measured in K Tons.
11. Are there any specific market keywords associated with the report?
Yes, the market keyword associated with the report is "Finished Steel Products Market," which aids in identifying and referencing the specific market segment covered.
12. How do I determine which pricing option suits my needs best?
The pricing options vary based on user requirements and access needs. Individual users may opt for single-user licenses, while businesses requiring broader access may choose multi-user or enterprise licenses for cost-effective access to the report.
13. Are there any additional resources or data provided in the Finished Steel Products Market report?
While the report offers comprehensive insights, it's advisable to review the specific contents or supplementary materials provided to ascertain if additional resources or data are available.
14. How can I stay updated on further developments or reports in the Finished Steel Products Market?
To stay informed about further developments, trends, and reports in the Finished Steel Products Market, consider subscribing to industry newsletters, following relevant companies and organizations, or regularly checking reputable industry news sources and publications.
Methodology
Step 1 - Identification of Relevant Samples Size from Population Database


Step 2 - Approaches for Defining Global Market Size (Value, Volume* & Price*)

Note*: In applicable scenarios
Step 3 - Data Sources
Primary Research
- Web Analytics
- Survey Reports
- Research Institute
- Latest Research Reports
- Opinion Leaders
Secondary Research
- Annual Reports
- White Paper
- Latest Press Release
- Industry Association
- Paid Database
- Investor Presentations

Step 4 - Data Triangulation
Involves using different sources of information in order to increase the validity of a study
These sources are likely to be stakeholders in a program - participants, other researchers, program staff, other community members, and so on.
Then we put all data in single framework & apply various statistical tools to find out the dynamic on the market.
During the analysis stage, feedback from the stakeholder groups would be compared to determine areas of agreement as well as areas of divergence