

Key Insights
The flat antenna market is experiencing robust growth, driven by the increasing demand for high-performance, compact antennas across various sectors. The market's Compound Annual Growth Rate (CAGR) of 23.80% from 2019 to 2024 indicates significant expansion, projected to continue throughout the forecast period (2025-2033). Key drivers include the miniaturization of electronic devices, the rise of 5G and satellite communication technologies, and the growing need for improved signal quality and efficiency in applications like aerospace, defense, and commercial sectors. The aerospace and defense segments are particularly significant contributors, fueled by the need for advanced communication and navigation systems in aircraft, satellites, and military vehicles. Furthermore, the integration of flat antennas into consumer electronics, such as smartphones and laptops, is anticipated to significantly boost market growth in the coming years. While challenges such as high manufacturing costs and potential signal interference exist, technological advancements and economies of scale are likely to mitigate these restraints. North America currently holds a significant market share, due to the presence of major technology companies and significant defense spending. However, the Asia-Pacific region is expected to witness rapid growth, driven by increasing adoption in emerging markets and investments in infrastructure development.
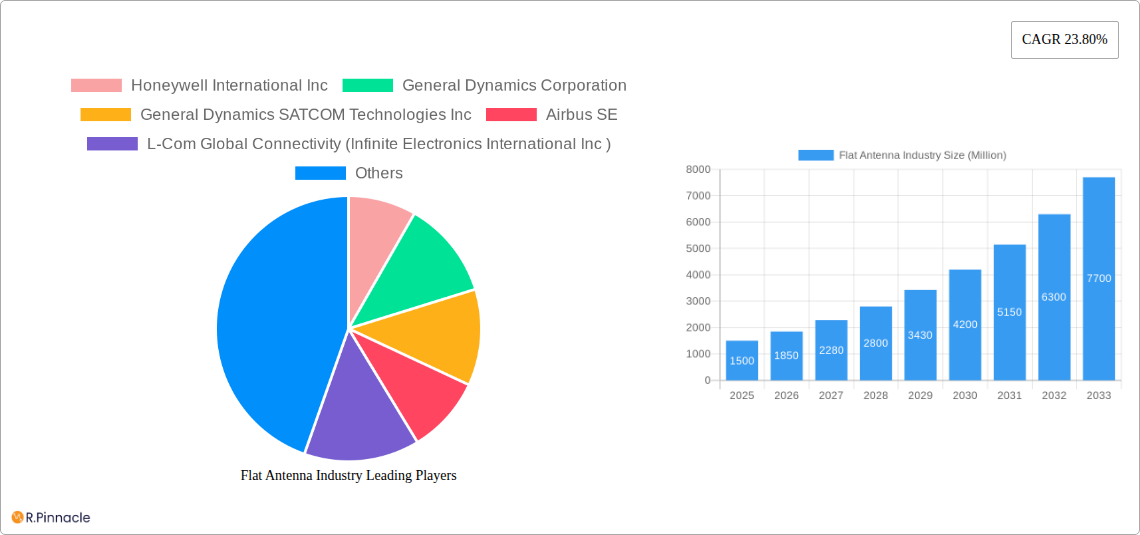
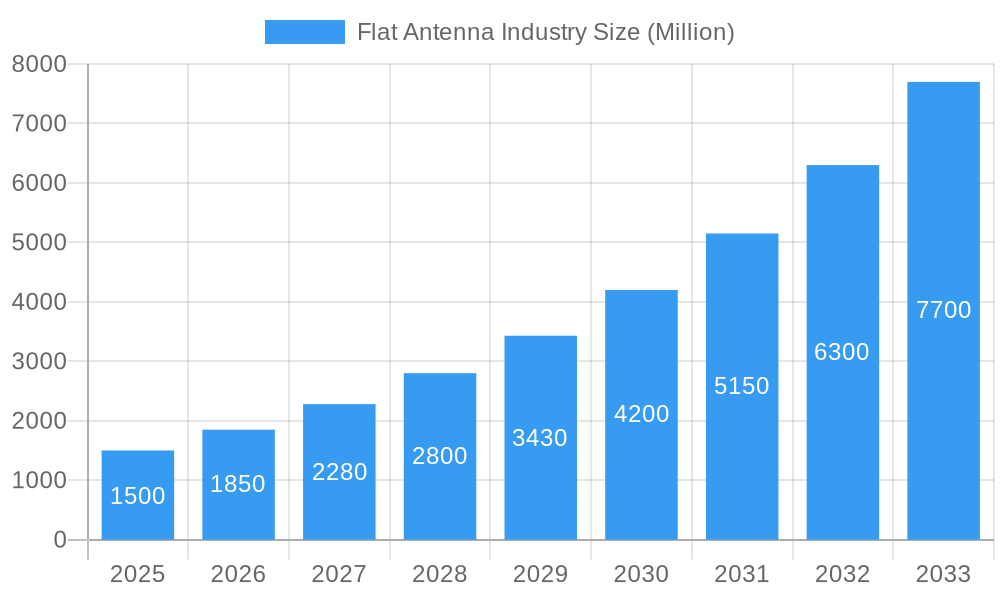
Flat Antenna Industry Market Size (In Billion)
The diverse applications of flat antennas across various sectors, coupled with ongoing technological innovations, position the market for substantial future growth. The continued miniaturization of electronic devices and the increasing demand for high-bandwidth communication are primary factors driving market expansion. Further segmentation by application (e.g., automotive, IoT) and technological advancements (e.g., metamaterials, active antennas) will further shape the market landscape. Competition among key players, including Honeywell International Inc., General Dynamics Corporation, and Airbus SE, will remain intense, with a focus on product innovation, partnerships, and strategic acquisitions to gain a larger market share. The projected growth trajectory suggests significant investment opportunities and lucrative prospects for stakeholders in the flat antenna market.
Flat Antenna Industry Company Market Share
This comprehensive report provides an in-depth analysis of the Flat Antenna Industry, offering invaluable insights for industry professionals, investors, and strategists. With a study period spanning 2019-2033, a base year of 2025, and a forecast period of 2025-2033, this report leverages extensive market research to deliver actionable intelligence. The global market is estimated at xx Million in 2025 and is projected to reach xx Million by 2033.
Flat Antenna Industry Market Structure & Innovation Trends
The flat antenna market is characterized by a moderately concentrated structure with key players holding significant market share. Honeywell International Inc., General Dynamics Corporation, and Airbus SE are among the leading players, though precise market share data varies depending on the segment and application. The market's growth is driven by continuous innovation in antenna design, materials, and manufacturing processes. This includes advancements in electronically steered antennas, the integration of 5G technology, and the development of high-performance flat panel antennas for satellite communication. Regulatory frameworks, particularly those concerning spectrum allocation and electromagnetic interference, significantly impact the industry. Substitutes such as parabolic antennas still hold some market presence, particularly in applications requiring higher power transmission, but flat antennas are gaining ground due to their size and weight advantages. M&A activities in recent years have involved smaller players being acquired by larger entities, consolidating the market. While exact deal values are not consistently reported publicly, estimated combined deal value over the past 5 years is in the xx Million range.
- Market Concentration: Moderately concentrated, with leading players holding significant but not dominant shares.
- Innovation Drivers: Advancements in materials science, miniaturization, electronically steered beams, and 5G integration.
- Regulatory Frameworks: Spectrum allocation and electromagnetic compatibility regulations shape market growth.
- Product Substitutes: Parabolic antennas are a primary substitute but are losing market share to flat antennas.
- End-User Demographics: Strong demand from aerospace, defense, and commercial sectors, with increasing adoption across other applications.
- M&A Activities: Recent years have seen consolidation through acquisitions, although public data on deal values is limited.
Flat Antenna Industry Market Dynamics & Trends
The flat antenna market exhibits a robust growth trajectory, primarily fueled by the increasing demand for high-bandwidth, high-efficiency antennas in various sectors. Technological advancements, such as the development of metamaterials and advanced manufacturing techniques, are key drivers. The shift towards smaller, lighter, and more aesthetically pleasing antennas is significantly boosting market penetration. The CAGR (Compound Annual Growth Rate) during the forecast period (2025-2033) is projected to be xx%, driven by increased adoption across diverse applications. Consumer preferences lean towards highly integrated and reliable systems, leading to the integration of functionalities into the antenna itself. Competitive dynamics are intensifying, leading to innovation and cost reductions. Market penetration remains highest in established markets like North America and Europe but is rapidly expanding in Asia-Pacific and other developing regions.
Dominant Regions & Segments in Flat Antenna Industry
The aerospace and defense sectors dominate the flat antenna market, due to the stringent performance requirements and the strategic importance of reliable communication. North America currently holds the largest market share, driven by robust government spending on defense and aerospace technologies and a highly developed technological infrastructure. Europe follows closely, also driven by strong aerospace and defense sectors.
Key Drivers (Aerospace & Defense):
- High Government Spending: Significant investment in defense modernization and satellite communication infrastructure.
- Stringent Performance Requirements: Demand for highly reliable and high-performance antennas in critical applications.
- Technological Advancement: Continuous innovation in materials, design, and manufacturing processes.
Dominance Analysis:
North America's dominance stems from strong domestic manufacturing capabilities, a robust research and development ecosystem, and a large aerospace and defense industry. The region benefits from supportive government policies and strong intellectual property rights protection. This advantage is projected to remain, however, growth in Asia-Pacific, driven by emerging economies and expanding satellite-based communication infrastructure, will increase competitiveness.
Flat Antenna Industry Product Innovations
Recent innovations in flat antenna technology are focusing on improving performance, miniaturization, and integration capabilities. Developments in metamaterials are leading to the creation of antennas that are more efficient and can be adapted to multiple frequency bands. The integration of 5G and satellite communication capabilities within single units is becoming increasingly prevalent. These innovations offer advantages like reduced size, weight, and cost compared to traditional antennas while meeting increasingly demanding applications. The market is seeing a strong drive toward highly integrated, multi-functional antenna systems.
Report Scope & Segmentation Analysis
This report segments the flat antenna market primarily by application: Aerospace, Defense, and Commercial. Each segment exhibits unique growth dynamics.
Aerospace: This segment is characterized by high performance requirements and a focus on integration with aircraft and satellite communication systems. Market growth is projected to be driven by the increasing adoption of satellite-based communication for commercial airliners and the growing need for reliable communication systems for military aircraft.
Defense: The defense segment prioritizes robust performance, wide bandwidth, and security features. Market growth is primarily driven by defense modernization programs and the increasing demand for advanced communication systems.
Commercial: This segment is witnessing increasing growth due to the rising adoption of flat antennas in wireless communication infrastructure, such as 5G networks and IoT devices. Market expansion is expected in this area.
Key Drivers of Flat Antenna Industry Growth
The flat antenna industry's growth is propelled by several key factors: the increasing demand for high-bandwidth wireless communication in various sectors; continuous technological advancements, such as the use of metamaterials and advanced manufacturing techniques; the ongoing miniaturization trend in electronic devices; and supportive government policies promoting the adoption of advanced technologies in communication systems.
Challenges in the Flat Antenna Industry Sector
Key challenges facing the flat antenna sector include maintaining high performance levels under challenging environmental conditions, such as humidity and temperature extremes; the cost of materials and manufacturing; intense competition from established players; the need for frequent updates to comply with evolving standards and regulations; and ensuring supply chain resilience during geopolitical instability, which can affect the procurement of crucial raw materials.
Emerging Opportunities in Flat Antenna Industry
Emerging opportunities exist in the integration of flat antennas with advanced sensor technologies; the development of antennas for high-frequency communication applications; and exploring new applications in emerging markets, such as autonomous vehicles and smart cities, creating demand for flexible and high-performance antennas in diverse use cases. This includes the increasing adoption in various applications beyond traditional sectors.
Leading Players in the Flat Antenna Industry Market
- Honeywell International Inc
- General Dynamics Corporation
- General Dynamics SATCOM Technologies Inc
- Airbus SE
- L-Com Global Connectivity (Infinite Electronics International Inc)
- Kymeta Corporation
- MacDonald Dettwiler and Associates Ltd
- Mars Antenna & RF Systems Ltd
- Phasor Inc
- Cobham PLC
- L3Harris Technologies
Key Developments in Flat Antenna Industry
- August 2022: Intellian Technologies launched new t-Series and S-Series antennas for improved marine TV quality.
- August 2022: KP Performance Antennas (Infinite Electronics) unveiled new 5G, low-PIM in-building DAS antennas.
- March 2022: Kymeta secured USD 84 Million for LEO satellite interface manufacturing.
- November 2021: Isotropic Systems successfully tested its flat-panel antenna with multi-orbit satellite connectivity.
Future Outlook for Flat Antenna Industry Market
The future of the flat antenna market is exceptionally promising, with ongoing technological advancements and increasing demand across diverse sectors fueling considerable growth. The market is projected to experience a significant expansion in the coming years, driven by the continued adoption of 5G and satellite communication technologies, alongside innovation in materials and design. Strategic opportunities lie in the development of highly integrated, multi-functional antennas and the exploration of niche applications across various industries.
Flat Antenna Industry Segmentation
-
1. Application
- 1.1. Aerospace
- 1.2. Defense
- 1.3. Commercial
Flat Antenna Industry Segmentation By Geography
- 1. North America
- 2. Asia Pacific
- 3. Europe
- 4. Rest of the World
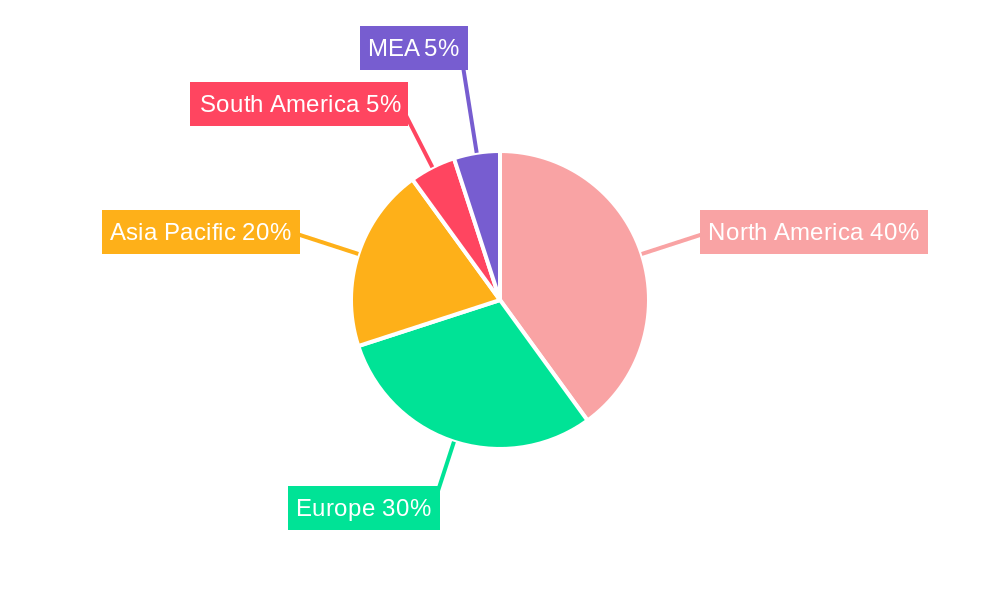
Flat Antenna Industry Regional Market Share
Geographic Coverage of Flat Antenna Industry
Flat Antenna Industry REPORT HIGHLIGHTS
| Aspects | Details |
|---|---|
| Study Period | 2020-2034 |
| Base Year | 2025 |
| Estimated Year | 2026 |
| Forecast Period | 2026-2034 |
| Historical Period | 2020-2025 |
| Growth Rate | CAGR of 7.4% from 2020-2034 |
| Segmentation |
|
Table of Contents
- 1. Introduction
- 1.1. Research Scope
- 1.2. Market Segmentation
- 1.3. Research Objective
- 1.4. Definitions and Assumptions
- 2. Executive Summary
- 2.1. Market Snapshot
- 3. Market Dynamics
- 3.1. Market Drivers
- 3.2. Market Restrains
- 3.3. Market Trends
- 3.4. Market Opportunities
- 4. Market Factor Analysis
- 4.1. Porters Five Forces
- 4.1.1. Bargaining Power of Suppliers
- 4.1.2. Bargaining Power of Buyers
- 4.1.3. Threat of New Entrants
- 4.1.4. Threat of Substitutes
- 4.1.5. Competitive Rivalry
- 4.2. PESTEL analysis
- 4.3. BCG Analysis
- 4.3.1. Stars (High Growth, High Market Share)
- 4.3.2. Cash Cows (Low Growth, High Market Share)
- 4.3.3. Question Mark (High Growth, Low Market Share)
- 4.3.4. Dogs (Low Growth, Low Market Share)
- 4.4. Ansoff Matrix Analysis
- 4.5. Supply Chain Analysis
- 4.6. Regulatory Landscape
- 4.7. Current Market Potential and Opportunity Assessment (TAM–SAM–SOM Framework)
- 4.8. PRI Analyst Note
- 4.1. Porters Five Forces
- 5. Market Analysis, Insights and Forecast 2021-2033
- 5.1. Market Analysis, Insights and Forecast - by Application
- 5.1.1. Aerospace
- 5.1.2. Defense
- 5.1.3. Commercial
- 5.2. Market Analysis, Insights and Forecast - by Region
- 5.2.1. North America
- 5.2.2. Asia Pacific
- 5.2.3. Europe
- 5.2.4. Rest of the World
- 5.1. Market Analysis, Insights and Forecast - by Application
- 6. Global Flat Antenna Industry Analysis, Insights and Forecast, 2021-2033
- 6.1. Market Analysis, Insights and Forecast - by Application
- 6.1.1. Aerospace
- 6.1.2. Defense
- 6.1.3. Commercial
- 6.1. Market Analysis, Insights and Forecast - by Application
- 7. North America Flat Antenna Industry Analysis, Insights and Forecast, 2020-2032
- 7.1. Market Analysis, Insights and Forecast - by Application
- 7.1.1. Aerospace
- 7.1.2. Defense
- 7.1.3. Commercial
- 7.1. Market Analysis, Insights and Forecast - by Application
- 8. Asia Pacific Flat Antenna Industry Analysis, Insights and Forecast, 2020-2032
- 8.1. Market Analysis, Insights and Forecast - by Application
- 8.1.1. Aerospace
- 8.1.2. Defense
- 8.1.3. Commercial
- 8.1. Market Analysis, Insights and Forecast - by Application
- 9. Europe Flat Antenna Industry Analysis, Insights and Forecast, 2020-2032
- 9.1. Market Analysis, Insights and Forecast - by Application
- 9.1.1. Aerospace
- 9.1.2. Defense
- 9.1.3. Commercial
- 9.1. Market Analysis, Insights and Forecast - by Application
- 10. Rest of the World Flat Antenna Industry Analysis, Insights and Forecast, 2020-2032
- 10.1. Market Analysis, Insights and Forecast - by Application
- 10.1.1. Aerospace
- 10.1.2. Defense
- 10.1.3. Commercial
- 10.1. Market Analysis, Insights and Forecast - by Application
- 11. Competitive Analysis
- 11.1. Company Profiles
- 11.1.1 Honeywell International Inc
- 11.1.1.1. Company Overview
- 11.1.1.2. Products
- 11.1.1.3. Company Financials
- 11.1.1.4. SWOT Analysis
- 11.1.2 General Dynamics Corporation
- 11.1.2.1. Company Overview
- 11.1.2.2. Products
- 11.1.2.3. Company Financials
- 11.1.2.4. SWOT Analysis
- 11.1.3 General Dynamics SATCOM Technologies Inc
- 11.1.3.1. Company Overview
- 11.1.3.2. Products
- 11.1.3.3. Company Financials
- 11.1.3.4. SWOT Analysis
- 11.1.4 Airbus SE
- 11.1.4.1. Company Overview
- 11.1.4.2. Products
- 11.1.4.3. Company Financials
- 11.1.4.4. SWOT Analysis
- 11.1.5 L-Com Global Connectivity (Infinite Electronics International Inc )
- 11.1.5.1. Company Overview
- 11.1.5.2. Products
- 11.1.5.3. Company Financials
- 11.1.5.4. SWOT Analysis
- 11.1.6 Kymeta Corporation
- 11.1.6.1. Company Overview
- 11.1.6.2. Products
- 11.1.6.3. Company Financials
- 11.1.6.4. SWOT Analysis
- 11.1.7 MacDonald Dettwiler and Associates Ltd
- 11.1.7.1. Company Overview
- 11.1.7.2. Products
- 11.1.7.3. Company Financials
- 11.1.7.4. SWOT Analysis
- 11.1.8 Mars Antenna & RF Systems Ltd
- 11.1.8.1. Company Overview
- 11.1.8.2. Products
- 11.1.8.3. Company Financials
- 11.1.8.4. SWOT Analysis
- 11.1.9 Phasor Inc
- 11.1.9.1. Company Overview
- 11.1.9.2. Products
- 11.1.9.3. Company Financials
- 11.1.9.4. SWOT Analysis
- 11.1.10 Cobham PLC
- 11.1.10.1. Company Overview
- 11.1.10.2. Products
- 11.1.10.3. Company Financials
- 11.1.10.4. SWOT Analysis
- 11.1.11 L3Harris Technologies
- 11.1.11.1. Company Overview
- 11.1.11.2. Products
- 11.1.11.3. Company Financials
- 11.1.11.4. SWOT Analysis
- 11.1.1 Honeywell International Inc
- 11.2. Market Entropy
- 11.2.1 Company's Key Areas Served
- 11.2.2 Recent Developments
- 11.3. Company Market Share Analysis 2025
- 11.3.1 Top 5 Companies Market Share Analysis
- 11.3.2 Top 3 Companies Market Share Analysis
- 11.4. List of Potential Customers
- 12. Research Methodology
List of Figures
- Figure 1: Global Flat Antenna Industry Revenue Breakdown (billion, %) by Region 2025 & 2033
- Figure 2: North America Flat Antenna Industry Revenue (billion), by Application 2025 & 2033
- Figure 3: North America Flat Antenna Industry Revenue Share (%), by Application 2025 & 2033
- Figure 4: North America Flat Antenna Industry Revenue (billion), by Country 2025 & 2033
- Figure 5: North America Flat Antenna Industry Revenue Share (%), by Country 2025 & 2033
- Figure 6: Asia Pacific Flat Antenna Industry Revenue (billion), by Application 2025 & 2033
- Figure 7: Asia Pacific Flat Antenna Industry Revenue Share (%), by Application 2025 & 2033
- Figure 8: Asia Pacific Flat Antenna Industry Revenue (billion), by Country 2025 & 2033
- Figure 9: Asia Pacific Flat Antenna Industry Revenue Share (%), by Country 2025 & 2033
- Figure 10: Europe Flat Antenna Industry Revenue (billion), by Application 2025 & 2033
- Figure 11: Europe Flat Antenna Industry Revenue Share (%), by Application 2025 & 2033
- Figure 12: Europe Flat Antenna Industry Revenue (billion), by Country 2025 & 2033
- Figure 13: Europe Flat Antenna Industry Revenue Share (%), by Country 2025 & 2033
- Figure 14: Rest of the World Flat Antenna Industry Revenue (billion), by Application 2025 & 2033
- Figure 15: Rest of the World Flat Antenna Industry Revenue Share (%), by Application 2025 & 2033
- Figure 16: Rest of the World Flat Antenna Industry Revenue (billion), by Country 2025 & 2033
- Figure 17: Rest of the World Flat Antenna Industry Revenue Share (%), by Country 2025 & 2033
List of Tables
- Table 1: Global Flat Antenna Industry Revenue billion Forecast, by Application 2020 & 2033
- Table 2: Global Flat Antenna Industry Revenue billion Forecast, by Region 2020 & 2033
- Table 3: Global Flat Antenna Industry Revenue billion Forecast, by Application 2020 & 2033
- Table 4: Global Flat Antenna Industry Revenue billion Forecast, by Country 2020 & 2033
- Table 5: Global Flat Antenna Industry Revenue billion Forecast, by Application 2020 & 2033
- Table 6: Global Flat Antenna Industry Revenue billion Forecast, by Country 2020 & 2033
- Table 7: Global Flat Antenna Industry Revenue billion Forecast, by Application 2020 & 2033
- Table 8: Global Flat Antenna Industry Revenue billion Forecast, by Country 2020 & 2033
- Table 9: Global Flat Antenna Industry Revenue billion Forecast, by Application 2020 & 2033
- Table 10: Global Flat Antenna Industry Revenue billion Forecast, by Country 2020 & 2033
Frequently Asked Questions
1. What is the projected Compound Annual Growth Rate (CAGR) of the Flat Antenna Industry?
The projected CAGR is approximately 7.4%.
2. Which companies are prominent players in the Flat Antenna Industry?
Key companies in the market include Honeywell International Inc, General Dynamics Corporation, General Dynamics SATCOM Technologies Inc, Airbus SE, L-Com Global Connectivity (Infinite Electronics International Inc ), Kymeta Corporation, MacDonald Dettwiler and Associates Ltd, Mars Antenna & RF Systems Ltd, Phasor Inc, Cobham PLC, L3Harris Technologies.
3. What are the main segments of the Flat Antenna Industry?
The market segments include Application.
4. Can you provide details about the market size?
The market size is estimated to be USD 7.27 billion as of 2022.
5. What are some drivers contributing to market growth?
Adoption of Unmanned Systems in Defense and Increasing demand for Commercial Aircraft are the Major Driver of the Market; Innovation Leading To Wider Application of Flat Antenna.
6. What are the notable trends driving market growth?
Adoption of Unmanned Systems in Defense and Increasing Demand for Commercial Aircraft.
7. Are there any restraints impacting market growth?
High Price acts as a Restraint for Wider Application.
8. Can you provide examples of recent developments in the market?
August 2022 - Intellian Technologies, Inc., the world's leading manufacturer of satellite communications technologies and solutions, has unveiled new t-Series and S-Series antennas to improve the live television (TV) quality for passengers onboard marine boats.
9. What pricing options are available for accessing the report?
Pricing options include single-user, multi-user, and enterprise licenses priced at USD 4750, USD 5250, and USD 8750 respectively.
10. Is the market size provided in terms of value or volume?
The market size is provided in terms of value, measured in billion.
11. Are there any specific market keywords associated with the report?
Yes, the market keyword associated with the report is "Flat Antenna Industry," which aids in identifying and referencing the specific market segment covered.
12. How do I determine which pricing option suits my needs best?
The pricing options vary based on user requirements and access needs. Individual users may opt for single-user licenses, while businesses requiring broader access may choose multi-user or enterprise licenses for cost-effective access to the report.
13. Are there any additional resources or data provided in the Flat Antenna Industry report?
While the report offers comprehensive insights, it's advisable to review the specific contents or supplementary materials provided to ascertain if additional resources or data are available.
14. How can I stay updated on further developments or reports in the Flat Antenna Industry?
To stay informed about further developments, trends, and reports in the Flat Antenna Industry, consider subscribing to industry newsletters, following relevant companies and organizations, or regularly checking reputable industry news sources and publications.
Methodology
Step 1 - Identification of Relevant Samples Size from Population Database


Step 2 - Approaches for Defining Global Market Size (Value, Volume* & Price*)

Note*: In applicable scenarios
Step 3 - Data Sources
Primary Research
- Web Analytics
- Survey Reports
- Research Institute
- Latest Research Reports
- Opinion Leaders
Secondary Research
- Annual Reports
- White Paper
- Latest Press Release
- Industry Association
- Paid Database
- Investor Presentations

Step 4 - Data Triangulation
Involves using different sources of information in order to increase the validity of a study
These sources are likely to be stakeholders in a program - participants, other researchers, program staff, other community members, and so on.
Then we put all data in single framework & apply various statistical tools to find out the dynamic on the market.
During the analysis stage, feedback from the stakeholder groups would be compared to determine areas of agreement as well as areas of divergence