

Key Insights
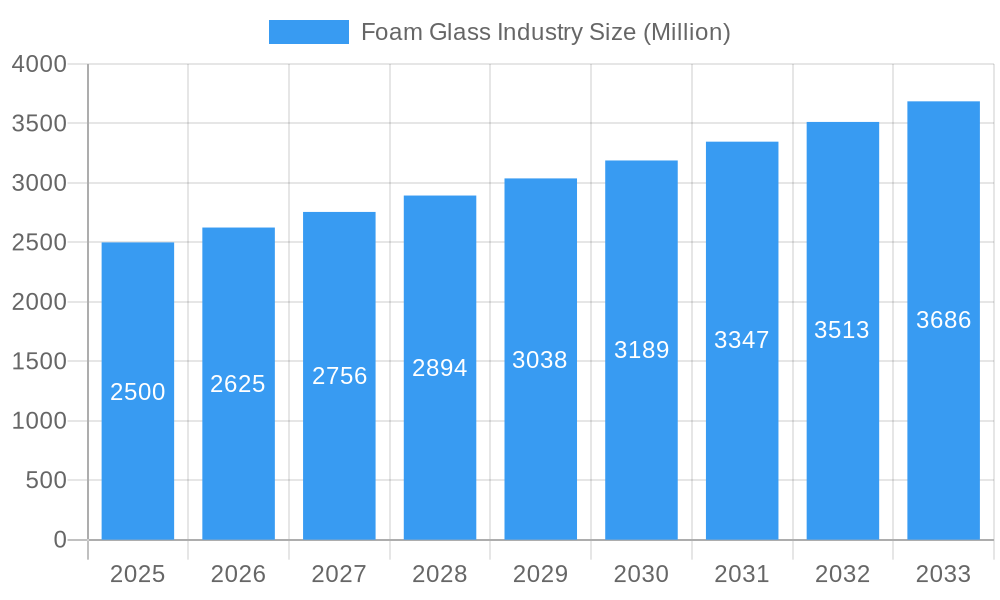
The global foam glass market is poised for significant expansion, projected to reach $2.82 billion by 2025, with a compound annual growth rate (CAGR) of 5.04% from 2025 to 2033. This growth is propelled by the material's superior thermal insulation capabilities, essential for energy-efficient construction in residential and commercial sectors. Growing adoption of sustainable building practices further amplifies demand, positioning foam glass as an eco-friendly alternative to conventional insulation. The market is segmented by foam glass type, with closed-cell variants leading due to their exceptional moisture resistance. Asia Pacific, driven by rapid infrastructure development in China and India, is a key growth region. Market restraints include cost competitiveness against alternative insulation materials and potential volatility in raw material and energy prices. The market is moderately consolidated, featuring established players and emerging regional manufacturers. Future growth will be driven by innovations in manufacturing processes and the development of specialized foam glass for niche applications like cryogenic insulation and infrastructure projects.
Foam Glass Industry Market Size (In Billion)
The competitive environment is characterized by a blend of established global corporations and dynamic regional contenders. Strategic collaborations, mergers, and acquisitions are anticipated as companies strive to enhance market share and broaden their geographic presence. Technological advancements in manufacturing efficiency and performance enhancement will be critical for sustained competitiveness. Supportive regulations for green building initiatives are expected to boost market growth, although raw material and energy price fluctuations may present challenges. The ongoing expansion of the construction industry, coupled with increasing awareness of sustainable building solutions, positions the foam glass market for continued robust growth. Further research into specialized applications and technological advancements will be instrumental in driving innovation and market expansion.
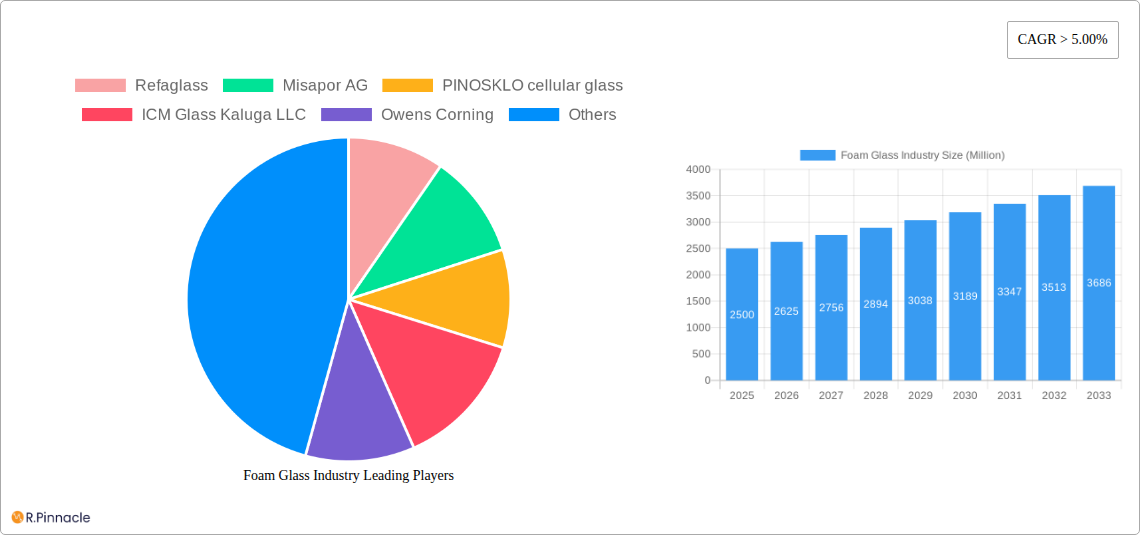
Foam Glass Industry Company Market Share
Foam Glass Industry: Market Analysis Report 2019-2033
This comprehensive report provides an in-depth analysis of the global foam glass industry, offering valuable insights for industry professionals, investors, and strategic decision-makers. With a study period spanning 2019-2033, a base year of 2025, and an estimated and forecast period of 2025-2033, this report meticulously examines market trends, competitive dynamics, and future growth potential. The report covers key players including Refaglass, Misapor AG, PINOSKLO cellular glass, and more, providing a granular understanding of the market's structure and evolution. The total market size is projected to reach xx Million by 2033.
Foam Glass Industry Market Structure & Innovation Trends
The global foam glass market exhibits a moderately fragmented structure, with several key players holding significant market share but no single dominant entity. Refaglass, Misapor AG, and Owens Corning are among the prominent players, collectively accounting for approximately xx% of the market share in 2025. Innovation in the foam glass industry is driven by the increasing demand for sustainable building materials and improved insulation properties. Regulatory frameworks, such as those promoting energy efficiency, are significantly influencing market growth. Product substitutes, such as other insulation materials, exert competitive pressure. The market is witnessing a rise in M&A activity, with deal values reaching approximately xx Million in the past five years. End-user demographics are shifting towards more environmentally conscious consumers, driving demand for sustainable options like foam glass.
- Market Concentration: Moderately fragmented.
- Innovation Drivers: Sustainable building materials, improved insulation.
- Regulatory Frameworks: Energy efficiency standards.
- M&A Activity: Significant activity with deal values of approximately xx Million in the last five years.
- Market Share (2025 Estimate): Refaglass: xx%; Misapor AG: xx%; Owens Corning: xx%; Others: xx%.
Foam Glass Industry Market Dynamics & Trends
The foam glass market is experiencing robust growth, driven by factors such as increasing construction activity globally, rising demand for energy-efficient buildings, and the growing adoption of sustainable construction practices. The CAGR for the forecast period (2025-2033) is projected to be xx%. Technological advancements in foam glass production are leading to improved product quality, cost-effectiveness, and enhanced performance characteristics. Consumer preferences are shifting towards high-performance, eco-friendly insulation materials, further boosting demand. Competitive dynamics are characterized by intense rivalry among existing players, with new entrants continually entering the market. Market penetration of foam glass in various end-user segments is expected to increase significantly over the forecast period.
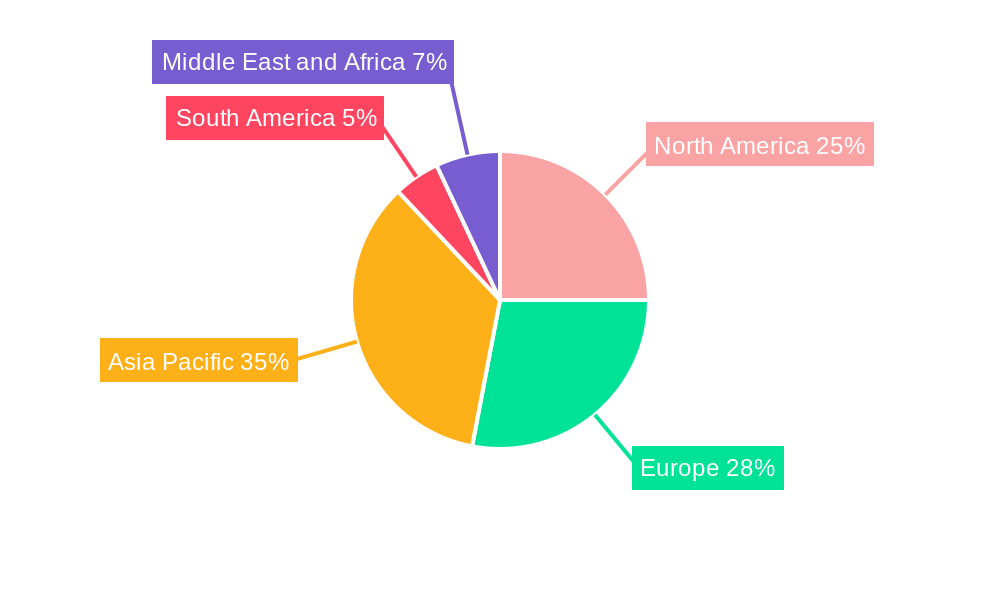
Dominant Regions & Segments in Foam Glass Industry
Europe currently holds the dominant position in the foam glass market, driven by stringent energy efficiency regulations and strong construction activity in countries like Germany and France. Within the product types, closed-cell foam glass accounts for the largest segment share, owing to its superior insulation properties and durability. The Commercial segment dominates the end-user industries.
- Key Drivers in Europe: Stringent energy efficiency regulations, robust construction sector.
- Leading Segment (Type): Closed-cell foam glass due to superior performance.
- Leading End-User Segment: Commercial sector due to large-scale construction projects.
- Key Drivers in Commercial Segment: Increased demand for energy-efficient buildings, government incentives.
Foam Glass Industry Product Innovations
Recent product innovations focus on enhancing the thermal performance and durability of foam glass, alongside explorations of new applications, such as in infrastructure and transportation. Technological trends include the development of lightweight, high-strength foam glass variants. These innovations aim to improve market fit by addressing the need for energy-efficient and sustainable building materials, as well as providing solutions for specialized applications.
Report Scope & Segmentation Analysis
This report segments the foam glass market by type (open-cell, closed-cell, other types) and end-user industry (commercial, residential, industrial). Each segment is analyzed in detail, covering market size, growth projections, and competitive dynamics. The closed-cell segment is projected to witness the highest growth, driven by its superior thermal insulation properties. The commercial sector holds the largest market share due to the high volume of construction activity in this sector.
- By Type: Open-cell, Closed-cell, Other Types (Growth projections for each provided within the report).
- By End-user Industry: Commercial, Residential, Industrial (Market sizes and competitive dynamics detailed in the report).
Key Drivers of Foam Glass Industry Growth
The growth of the foam glass industry is primarily fueled by the rising demand for energy-efficient building materials, stringent environmental regulations promoting sustainable construction, and increased government support for green building initiatives. Technological advancements leading to improved manufacturing processes and enhanced product properties are also major contributors to the industry's growth.
Challenges in the Foam Glass Industry Sector
The foam glass industry faces challenges such as high production costs, the availability of alternative insulation materials, and the complexity of the recycling process. These factors can hinder the widespread adoption of foam glass. Supply chain disruptions can also significantly impact production and market availability.
Emerging Opportunities in Foam Glass Industry
Emerging opportunities exist in the expansion into new geographic markets, particularly in developing economies experiencing rapid urbanization and infrastructure development. Moreover, advancements in production technologies and the exploration of new applications within specialized niches like infrastructure and transportation present significant growth potential.
Leading Players in the Foam Glass Industry Market
- Refaglass
- Misapor AG
- PINOSKLO cellular glass
- ICM Glass Kaluga LLC
- Owens Corning
- GEOCELL Schaumglas GmbH
- AeroAggregates of North America LLC
- Glapor Werk Mitterteich GmbH
- Glevel
- Styro Ltd
- Anhui Huichang New Material Co Ltd
- Ningbo Yoyo Foam Glass Co Ltd
- Zhejiang Zhenshen Insulation Technology Corp
- Polydros SA
- Uusioaines Oy
Key Developments in Foam Glass Industry Industry
- 2022 Q4: Refaglass announced a new production facility expansion.
- 2023 Q1: Misapor AG launched a new closed-cell foam glass product with enhanced insulation properties.
- 2023 Q3: A significant merger between two smaller foam glass producers resulted in a new major player. (Further details within the report)
Future Outlook for Foam Glass Industry Market
The foam glass market is poised for significant growth in the coming years, driven by increasing demand for sustainable and energy-efficient building solutions. Strategic opportunities lie in product innovation, expansion into new markets, and the development of sustainable production processes. The market's future is bright given the continuing focus on environmental sustainability and energy efficiency.
Foam Glass Industry Segmentation
-
1. Type
- 1.1. Open Cell
- 1.2. Closed Cell
- 1.3. Other Types
-
2. End-user Industry
- 2.1. Commercial
- 2.2. Residential
- 2.3. Industrial
Foam Glass Industry Segmentation By Geography
-
1. Asia Pacific
- 1.1. China
- 1.2. India
- 1.3. Japan
- 1.4. South Korea
- 1.5. Rest of Asia Pacific
-
2. North America
- 2.1. United States
- 2.2. Canada
- 2.3. Mexico
-
3. Europe
- 3.1. Germany
- 3.2. United Kingdom
- 3.3. France
- 3.4. Italy
- 3.5. Rest of Europe
-
4. South America
- 4.1. Brazil
- 4.2. Argentina
- 4.3. Rest of South America
-
5. Middle East and Africa
- 5.1. Saudi Arabia
- 5.2. South Africa
- 5.3. Rest of Middle East and Africa
Foam Glass Industry Regional Market Share
Geographic Coverage of Foam Glass Industry
Foam Glass Industry REPORT HIGHLIGHTS
| Aspects | Details |
|---|---|
| Study Period | 2020-2034 |
| Base Year | 2025 |
| Estimated Year | 2026 |
| Forecast Period | 2026-2034 |
| Historical Period | 2020-2025 |
| Growth Rate | CAGR of 5.04% from 2020-2034 |
| Segmentation |
|
Table of Contents
- 1. Introduction
- 1.1. Research Scope
- 1.2. Market Segmentation
- 1.3. Research Objective
- 1.4. Definitions and Assumptions
- 2. Executive Summary
- 2.1. Market Snapshot
- 3. Market Dynamics
- 3.1. Market Drivers
- 3.2. Market Restrains
- 3.3. Market Trends
- 3.4. Market Opportunities
- 4. Market Factor Analysis
- 4.1. Porters Five Forces
- 4.1.1. Bargaining Power of Suppliers
- 4.1.2. Bargaining Power of Buyers
- 4.1.3. Threat of New Entrants
- 4.1.4. Threat of Substitutes
- 4.1.5. Competitive Rivalry
- 4.2. PESTEL analysis
- 4.3. BCG Analysis
- 4.3.1. Stars (High Growth, High Market Share)
- 4.3.2. Cash Cows (Low Growth, High Market Share)
- 4.3.3. Question Mark (High Growth, Low Market Share)
- 4.3.4. Dogs (Low Growth, Low Market Share)
- 4.4. Ansoff Matrix Analysis
- 4.5. Supply Chain Analysis
- 4.6. Regulatory Landscape
- 4.7. Current Market Potential and Opportunity Assessment (TAM–SAM–SOM Framework)
- 4.8. PRI Analyst Note
- 4.1. Porters Five Forces
- 5. Market Analysis, Insights and Forecast 2021-2033
- 5.1. Market Analysis, Insights and Forecast - by Type
- 5.1.1. Open Cell
- 5.1.2. Closed Cell
- 5.1.3. Other Types
- 5.2. Market Analysis, Insights and Forecast - by End-user Industry
- 5.2.1. Commercial
- 5.2.2. Residential
- 5.2.3. Industrial
- 5.3. Market Analysis, Insights and Forecast - by Region
- 5.3.1. Asia Pacific
- 5.3.2. North America
- 5.3.3. Europe
- 5.3.4. South America
- 5.3.5. Middle East and Africa
- 5.1. Market Analysis, Insights and Forecast - by Type
- 6. Global Foam Glass Industry Analysis, Insights and Forecast, 2021-2033
- 6.1. Market Analysis, Insights and Forecast - by Type
- 6.1.1. Open Cell
- 6.1.2. Closed Cell
- 6.1.3. Other Types
- 6.2. Market Analysis, Insights and Forecast - by End-user Industry
- 6.2.1. Commercial
- 6.2.2. Residential
- 6.2.3. Industrial
- 6.1. Market Analysis, Insights and Forecast - by Type
- 7. Asia Pacific Foam Glass Industry Analysis, Insights and Forecast, 2020-2032
- 7.1. Market Analysis, Insights and Forecast - by Type
- 7.1.1. Open Cell
- 7.1.2. Closed Cell
- 7.1.3. Other Types
- 7.2. Market Analysis, Insights and Forecast - by End-user Industry
- 7.2.1. Commercial
- 7.2.2. Residential
- 7.2.3. Industrial
- 7.1. Market Analysis, Insights and Forecast - by Type
- 8. North America Foam Glass Industry Analysis, Insights and Forecast, 2020-2032
- 8.1. Market Analysis, Insights and Forecast - by Type
- 8.1.1. Open Cell
- 8.1.2. Closed Cell
- 8.1.3. Other Types
- 8.2. Market Analysis, Insights and Forecast - by End-user Industry
- 8.2.1. Commercial
- 8.2.2. Residential
- 8.2.3. Industrial
- 8.1. Market Analysis, Insights and Forecast - by Type
- 9. Europe Foam Glass Industry Analysis, Insights and Forecast, 2020-2032
- 9.1. Market Analysis, Insights and Forecast - by Type
- 9.1.1. Open Cell
- 9.1.2. Closed Cell
- 9.1.3. Other Types
- 9.2. Market Analysis, Insights and Forecast - by End-user Industry
- 9.2.1. Commercial
- 9.2.2. Residential
- 9.2.3. Industrial
- 9.1. Market Analysis, Insights and Forecast - by Type
- 10. South America Foam Glass Industry Analysis, Insights and Forecast, 2020-2032
- 10.1. Market Analysis, Insights and Forecast - by Type
- 10.1.1. Open Cell
- 10.1.2. Closed Cell
- 10.1.3. Other Types
- 10.2. Market Analysis, Insights and Forecast - by End-user Industry
- 10.2.1. Commercial
- 10.2.2. Residential
- 10.2.3. Industrial
- 10.1. Market Analysis, Insights and Forecast - by Type
- 11. Middle East and Africa Foam Glass Industry Analysis, Insights and Forecast, 2020-2032
- 11.1. Market Analysis, Insights and Forecast - by Type
- 11.1.1. Open Cell
- 11.1.2. Closed Cell
- 11.1.3. Other Types
- 11.2. Market Analysis, Insights and Forecast - by End-user Industry
- 11.2.1. Commercial
- 11.2.2. Residential
- 11.2.3. Industrial
- 11.1. Market Analysis, Insights and Forecast - by Type
- 12. Competitive Analysis
- 12.1. Company Profiles
- 12.1.1 Refaglass
- 12.1.1.1. Company Overview
- 12.1.1.2. Products
- 12.1.1.3. Company Financials
- 12.1.1.4. SWOT Analysis
- 12.1.2 Misapor AG
- 12.1.2.1. Company Overview
- 12.1.2.2. Products
- 12.1.2.3. Company Financials
- 12.1.2.4. SWOT Analysis
- 12.1.3 PINOSKLO cellular glass
- 12.1.3.1. Company Overview
- 12.1.3.2. Products
- 12.1.3.3. Company Financials
- 12.1.3.4. SWOT Analysis
- 12.1.4 ICM Glass Kaluga LLC
- 12.1.4.1. Company Overview
- 12.1.4.2. Products
- 12.1.4.3. Company Financials
- 12.1.4.4. SWOT Analysis
- 12.1.5 Owens Corning
- 12.1.5.1. Company Overview
- 12.1.5.2. Products
- 12.1.5.3. Company Financials
- 12.1.5.4. SWOT Analysis
- 12.1.6 GEOCELL Schaumglas GmbH
- 12.1.6.1. Company Overview
- 12.1.6.2. Products
- 12.1.6.3. Company Financials
- 12.1.6.4. SWOT Analysis
- 12.1.7 AeroAggregates of North America LLC
- 12.1.7.1. Company Overview
- 12.1.7.2. Products
- 12.1.7.3. Company Financials
- 12.1.7.4. SWOT Analysis
- 12.1.8 Glapor Werk Mitterteich GmbH
- 12.1.8.1. Company Overview
- 12.1.8.2. Products
- 12.1.8.3. Company Financials
- 12.1.8.4. SWOT Analysis
- 12.1.9 Glevel
- 12.1.9.1. Company Overview
- 12.1.9.2. Products
- 12.1.9.3. Company Financials
- 12.1.9.4. SWOT Analysis
- 12.1.10 Styro Ltd
- 12.1.10.1. Company Overview
- 12.1.10.2. Products
- 12.1.10.3. Company Financials
- 12.1.10.4. SWOT Analysis
- 12.1.11 Anhui Huichang New Material Co Ltd
- 12.1.11.1. Company Overview
- 12.1.11.2. Products
- 12.1.11.3. Company Financials
- 12.1.11.4. SWOT Analysis
- 12.1.12 Ningbo Yoyo Foam Glass Co Ltd
- 12.1.12.1. Company Overview
- 12.1.12.2. Products
- 12.1.12.3. Company Financials
- 12.1.12.4. SWOT Analysis
- 12.1.13 Zhejiang Zhenshen Insulation Technology Corp *List Not Exhaustive
- 12.1.13.1. Company Overview
- 12.1.13.2. Products
- 12.1.13.3. Company Financials
- 12.1.13.4. SWOT Analysis
- 12.1.14 Polydros SA
- 12.1.14.1. Company Overview
- 12.1.14.2. Products
- 12.1.14.3. Company Financials
- 12.1.14.4. SWOT Analysis
- 12.1.15 Uusioaines Oy
- 12.1.15.1. Company Overview
- 12.1.15.2. Products
- 12.1.15.3. Company Financials
- 12.1.15.4. SWOT Analysis
- 12.1.1 Refaglass
- 12.2. Market Entropy
- 12.2.1 Company's Key Areas Served
- 12.2.2 Recent Developments
- 12.3. Company Market Share Analysis 2025
- 12.3.1 Top 5 Companies Market Share Analysis
- 12.3.2 Top 3 Companies Market Share Analysis
- 12.4. List of Potential Customers
- 13. Research Methodology
List of Figures
- Figure 1: Global Foam Glass Industry Revenue Breakdown (billion, %) by Region 2025 & 2033
- Figure 2: Asia Pacific Foam Glass Industry Revenue (billion), by Type 2025 & 2033
- Figure 3: Asia Pacific Foam Glass Industry Revenue Share (%), by Type 2025 & 2033
- Figure 4: Asia Pacific Foam Glass Industry Revenue (billion), by End-user Industry 2025 & 2033
- Figure 5: Asia Pacific Foam Glass Industry Revenue Share (%), by End-user Industry 2025 & 2033
- Figure 6: Asia Pacific Foam Glass Industry Revenue (billion), by Country 2025 & 2033
- Figure 7: Asia Pacific Foam Glass Industry Revenue Share (%), by Country 2025 & 2033
- Figure 8: North America Foam Glass Industry Revenue (billion), by Type 2025 & 2033
- Figure 9: North America Foam Glass Industry Revenue Share (%), by Type 2025 & 2033
- Figure 10: North America Foam Glass Industry Revenue (billion), by End-user Industry 2025 & 2033
- Figure 11: North America Foam Glass Industry Revenue Share (%), by End-user Industry 2025 & 2033
- Figure 12: North America Foam Glass Industry Revenue (billion), by Country 2025 & 2033
- Figure 13: North America Foam Glass Industry Revenue Share (%), by Country 2025 & 2033
- Figure 14: Europe Foam Glass Industry Revenue (billion), by Type 2025 & 2033
- Figure 15: Europe Foam Glass Industry Revenue Share (%), by Type 2025 & 2033
- Figure 16: Europe Foam Glass Industry Revenue (billion), by End-user Industry 2025 & 2033
- Figure 17: Europe Foam Glass Industry Revenue Share (%), by End-user Industry 2025 & 2033
- Figure 18: Europe Foam Glass Industry Revenue (billion), by Country 2025 & 2033
- Figure 19: Europe Foam Glass Industry Revenue Share (%), by Country 2025 & 2033
- Figure 20: South America Foam Glass Industry Revenue (billion), by Type 2025 & 2033
- Figure 21: South America Foam Glass Industry Revenue Share (%), by Type 2025 & 2033
- Figure 22: South America Foam Glass Industry Revenue (billion), by End-user Industry 2025 & 2033
- Figure 23: South America Foam Glass Industry Revenue Share (%), by End-user Industry 2025 & 2033
- Figure 24: South America Foam Glass Industry Revenue (billion), by Country 2025 & 2033
- Figure 25: South America Foam Glass Industry Revenue Share (%), by Country 2025 & 2033
- Figure 26: Middle East and Africa Foam Glass Industry Revenue (billion), by Type 2025 & 2033
- Figure 27: Middle East and Africa Foam Glass Industry Revenue Share (%), by Type 2025 & 2033
- Figure 28: Middle East and Africa Foam Glass Industry Revenue (billion), by End-user Industry 2025 & 2033
- Figure 29: Middle East and Africa Foam Glass Industry Revenue Share (%), by End-user Industry 2025 & 2033
- Figure 30: Middle East and Africa Foam Glass Industry Revenue (billion), by Country 2025 & 2033
- Figure 31: Middle East and Africa Foam Glass Industry Revenue Share (%), by Country 2025 & 2033
List of Tables
- Table 1: Global Foam Glass Industry Revenue billion Forecast, by Type 2020 & 2033
- Table 2: Global Foam Glass Industry Revenue billion Forecast, by End-user Industry 2020 & 2033
- Table 3: Global Foam Glass Industry Revenue billion Forecast, by Region 2020 & 2033
- Table 4: Global Foam Glass Industry Revenue billion Forecast, by Type 2020 & 2033
- Table 5: Global Foam Glass Industry Revenue billion Forecast, by End-user Industry 2020 & 2033
- Table 6: Global Foam Glass Industry Revenue billion Forecast, by Country 2020 & 2033
- Table 7: China Foam Glass Industry Revenue (billion) Forecast, by Application 2020 & 2033
- Table 8: India Foam Glass Industry Revenue (billion) Forecast, by Application 2020 & 2033
- Table 9: Japan Foam Glass Industry Revenue (billion) Forecast, by Application 2020 & 2033
- Table 10: South Korea Foam Glass Industry Revenue (billion) Forecast, by Application 2020 & 2033
- Table 11: Rest of Asia Pacific Foam Glass Industry Revenue (billion) Forecast, by Application 2020 & 2033
- Table 12: Global Foam Glass Industry Revenue billion Forecast, by Type 2020 & 2033
- Table 13: Global Foam Glass Industry Revenue billion Forecast, by End-user Industry 2020 & 2033
- Table 14: Global Foam Glass Industry Revenue billion Forecast, by Country 2020 & 2033
- Table 15: United States Foam Glass Industry Revenue (billion) Forecast, by Application 2020 & 2033
- Table 16: Canada Foam Glass Industry Revenue (billion) Forecast, by Application 2020 & 2033
- Table 17: Mexico Foam Glass Industry Revenue (billion) Forecast, by Application 2020 & 2033
- Table 18: Global Foam Glass Industry Revenue billion Forecast, by Type 2020 & 2033
- Table 19: Global Foam Glass Industry Revenue billion Forecast, by End-user Industry 2020 & 2033
- Table 20: Global Foam Glass Industry Revenue billion Forecast, by Country 2020 & 2033
- Table 21: Germany Foam Glass Industry Revenue (billion) Forecast, by Application 2020 & 2033
- Table 22: United Kingdom Foam Glass Industry Revenue (billion) Forecast, by Application 2020 & 2033
- Table 23: France Foam Glass Industry Revenue (billion) Forecast, by Application 2020 & 2033
- Table 24: Italy Foam Glass Industry Revenue (billion) Forecast, by Application 2020 & 2033
- Table 25: Rest of Europe Foam Glass Industry Revenue (billion) Forecast, by Application 2020 & 2033
- Table 26: Global Foam Glass Industry Revenue billion Forecast, by Type 2020 & 2033
- Table 27: Global Foam Glass Industry Revenue billion Forecast, by End-user Industry 2020 & 2033
- Table 28: Global Foam Glass Industry Revenue billion Forecast, by Country 2020 & 2033
- Table 29: Brazil Foam Glass Industry Revenue (billion) Forecast, by Application 2020 & 2033
- Table 30: Argentina Foam Glass Industry Revenue (billion) Forecast, by Application 2020 & 2033
- Table 31: Rest of South America Foam Glass Industry Revenue (billion) Forecast, by Application 2020 & 2033
- Table 32: Global Foam Glass Industry Revenue billion Forecast, by Type 2020 & 2033
- Table 33: Global Foam Glass Industry Revenue billion Forecast, by End-user Industry 2020 & 2033
- Table 34: Global Foam Glass Industry Revenue billion Forecast, by Country 2020 & 2033
- Table 35: Saudi Arabia Foam Glass Industry Revenue (billion) Forecast, by Application 2020 & 2033
- Table 36: South Africa Foam Glass Industry Revenue (billion) Forecast, by Application 2020 & 2033
- Table 37: Rest of Middle East and Africa Foam Glass Industry Revenue (billion) Forecast, by Application 2020 & 2033
Frequently Asked Questions
1. What is the projected Compound Annual Growth Rate (CAGR) of the Foam Glass Industry?
The projected CAGR is approximately 5.04%.
2. Which companies are prominent players in the Foam Glass Industry?
Key companies in the market include Refaglass, Misapor AG, PINOSKLO cellular glass, ICM Glass Kaluga LLC, Owens Corning, GEOCELL Schaumglas GmbH, AeroAggregates of North America LLC, Glapor Werk Mitterteich GmbH, Glevel, Styro Ltd, Anhui Huichang New Material Co Ltd, Ningbo Yoyo Foam Glass Co Ltd, Zhejiang Zhenshen Insulation Technology Corp *List Not Exhaustive, Polydros SA, Uusioaines Oy.
3. What are the main segments of the Foam Glass Industry?
The market segments include Type, End-user Industry.
4. Can you provide details about the market size?
The market size is estimated to be USD 2.82 billion as of 2022.
5. What are some drivers contributing to market growth?
; Increasing Demand From the Industrial Sector; Other Drivers.
6. What are the notable trends driving market growth?
Industrial Segment to Dominate the Market.
7. Are there any restraints impacting market growth?
; High Capital Investment; Other Restraints.
8. Can you provide examples of recent developments in the market?
N/A
9. What pricing options are available for accessing the report?
Pricing options include single-user, multi-user, and enterprise licenses priced at USD 4750, USD 5250, and USD 8750 respectively.
10. Is the market size provided in terms of value or volume?
The market size is provided in terms of value, measured in billion.
11. Are there any specific market keywords associated with the report?
Yes, the market keyword associated with the report is "Foam Glass Industry," which aids in identifying and referencing the specific market segment covered.
12. How do I determine which pricing option suits my needs best?
The pricing options vary based on user requirements and access needs. Individual users may opt for single-user licenses, while businesses requiring broader access may choose multi-user or enterprise licenses for cost-effective access to the report.
13. Are there any additional resources or data provided in the Foam Glass Industry report?
While the report offers comprehensive insights, it's advisable to review the specific contents or supplementary materials provided to ascertain if additional resources or data are available.
14. How can I stay updated on further developments or reports in the Foam Glass Industry?
To stay informed about further developments, trends, and reports in the Foam Glass Industry, consider subscribing to industry newsletters, following relevant companies and organizations, or regularly checking reputable industry news sources and publications.
Methodology
Step 1 - Identification of Relevant Samples Size from Population Database


Step 2 - Approaches for Defining Global Market Size (Value, Volume* & Price*)

Note*: In applicable scenarios
Step 3 - Data Sources
Primary Research
- Web Analytics
- Survey Reports
- Research Institute
- Latest Research Reports
- Opinion Leaders
Secondary Research
- Annual Reports
- White Paper
- Latest Press Release
- Industry Association
- Paid Database
- Investor Presentations

Step 4 - Data Triangulation
Involves using different sources of information in order to increase the validity of a study
These sources are likely to be stakeholders in a program - participants, other researchers, program staff, other community members, and so on.
Then we put all data in single framework & apply various statistical tools to find out the dynamic on the market.
During the analysis stage, feedback from the stakeholder groups would be compared to determine areas of agreement as well as areas of divergence