

Key Insights
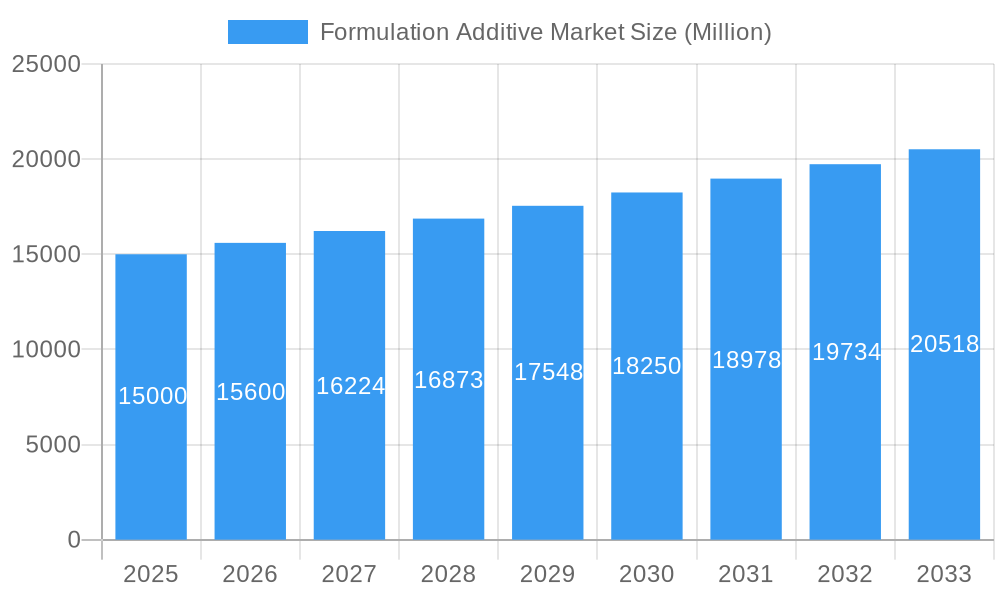
The global Formulation Additives market is experiencing robust growth, projected to maintain a Compound Annual Growth Rate (CAGR) exceeding 4.00% from 2025 to 2033. This expansion is driven by several key factors. The burgeoning construction and automotive sectors are significant contributors, demanding high-performance additives for enhanced durability, efficiency, and functionality in materials. The increasing adoption of advanced materials in electronics and the expanding food and beverage industries further fuel market demand. Technological advancements leading to the development of more specialized and eco-friendly additives are also driving growth. Specific trends include a shift toward bio-based additives to meet sustainability goals and the increasing demand for customized solutions tailored to specific application needs. While regulatory hurdles and raw material price fluctuations pose potential restraints, the overall market outlook remains positive, driven by continuous innovation and expanding end-user applications.
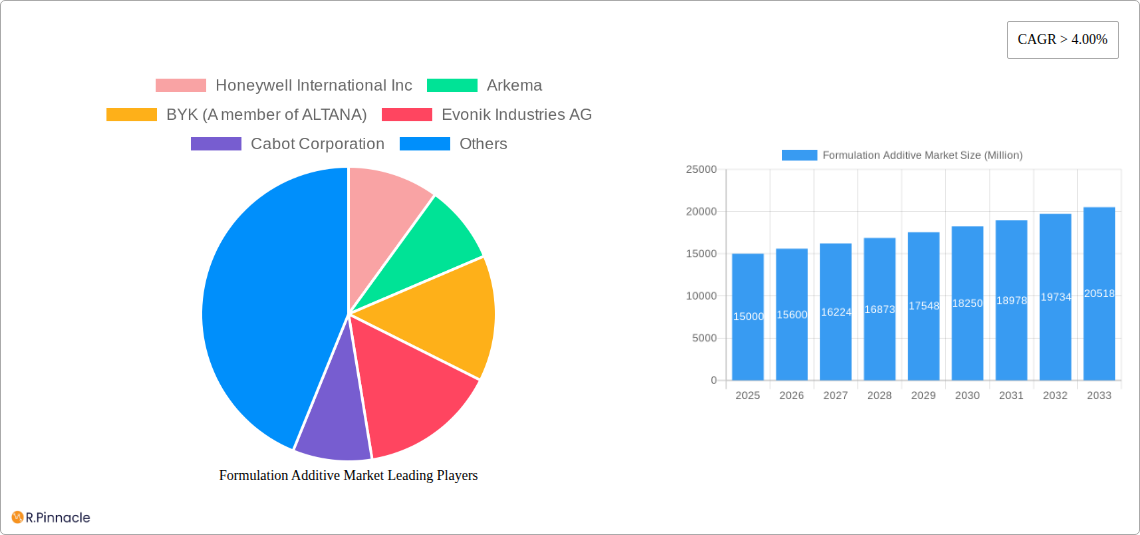
Formulation Additive Market Market Size (In Billion)
Growth is particularly strong in the Asia-Pacific region, fueled by rapid industrialization and infrastructure development in countries like China and India. North America and Europe also represent significant market segments, with established automotive and construction industries driving demand. Key players in the market, including Honeywell International Inc., Arkema, BYK, Evonik Industries AG, and BASF SE, are focusing on strategic partnerships, mergers and acquisitions, and product diversification to maintain their competitive edge. The market is segmented by additive type (defoamers, rheology modifiers, dispersing agents) and end-user industry, allowing for a granular understanding of market dynamics and future growth opportunities. This segmentation provides valuable insights for businesses looking to invest in or expand their presence within specific market niches. The forecast period from 2025 to 2033 offers substantial opportunities for growth, underpinned by the continuing development of innovative and sustainable formulation additives.
Formulation Additive Market Company Market Share
Formulation Additive Market: A Comprehensive Report 2019-2033
This in-depth report provides a comprehensive analysis of the Formulation Additive Market, offering valuable insights for industry professionals, investors, and strategists. Covering the period 2019-2033, with a focus on 2025, this study meticulously examines market dynamics, competitive landscapes, and future growth projections. The report's detailed segmentation analysis, coupled with actionable insights, empowers stakeholders to make informed decisions and capitalize on emerging opportunities. The market is projected to reach xx Million by 2033.
Formulation Additive Market Market Structure & Innovation Trends
The Formulation Additive market exhibits a moderately consolidated structure, with key players like Honeywell International Inc, Arkema, BYK (A member of ALTANA), Evonik Industries AG, Cabot Corporation, LANXESS, Momentive, BASF SE, Huntsman International LLC, Dow, Eastman Chemical Company, and MÜNZING Corporation holding significant market share. Market concentration is estimated at xx% in 2025, driven by economies of scale and extensive R&D capabilities. Innovation within the market is primarily fueled by the need for enhanced product performance, sustainability concerns, and stringent regulatory requirements.
- Innovation Drivers: Developing eco-friendly additives, improving material properties (e.g., strength, durability), and expanding application versatility.
- Regulatory Framework: Stringent environmental regulations and safety standards are shaping product development and market access.
- Product Substitutes: The emergence of bio-based additives and alternative materials poses a competitive challenge, yet also presents opportunities for innovation.
- M&A Activity: Consolidation through mergers and acquisitions has been notable, with deal values exceeding xx Million in the past five years. These activities aim to enhance market share, expand product portfolios, and access new technologies. For example, the merger between [Company A] and [Company B] in [Year] resulted in a significant increase in market share for the combined entity.
Formulation Additive Market Market Dynamics & Trends
The Formulation Additive market is witnessing robust growth, driven by rising demand across diverse end-use industries. The Construction, Automotive, and Oil & Gas sectors are major contributors, fueled by infrastructure development, vehicle production growth, and increasing oil extraction activities. The market's CAGR is projected at xx% during the forecast period (2025-2033), with significant market penetration expected in developing economies. Technological advancements, such as nanotechnology and bio-based additive development, are disrupting existing processes and driving product innovation. Consumer preferences for high-performance, sustainable, and cost-effective solutions are further shaping market trends. Competitive dynamics are characterized by intense rivalry, leading to pricing pressures and continuous innovation in product offerings and application technologies.
Dominant Regions & Segments in Formulation Additive Market
The North American region currently dominates the Formulation Additive market, driven by robust industrial activity and technological advancements. However, Asia-Pacific is projected to exhibit the highest growth rate during the forecast period, fueled by rapid industrialization and expanding infrastructure projects.
Leading Segments:
- By Type: Rheology modifiers currently hold the largest market share, followed by dispersing agents. Defoamers are expected to witness significant growth due to increasing demand from various industries.
- By End-user Industry: The Automotive sector accounts for the largest market share due to its high volume demand. The Construction and Oil & Gas sectors also demonstrate significant growth potential.
Key Drivers for Regional Dominance:
- North America: Strong regulatory frameworks supporting innovation, established industrial base, and high consumer demand for advanced materials.
- Asia-Pacific: Rapid industrialization, expanding infrastructure projects, and supportive government policies boosting manufacturing.
- Europe: Stringent environmental regulations driving the adoption of eco-friendly additives, and a well-established chemical industry.
Formulation Additive Market Product Innovations
Recent product innovations focus on improving the efficiency, sustainability, and performance of formulation additives. For example, the development of bio-based alternatives is gaining traction, addressing environmental concerns and reducing reliance on fossil fuels. Nanotechnology-enabled additives offer enhanced properties, leading to improved product performance and reduced material consumption. These innovations are well-positioned to meet the evolving needs of diverse end-user industries and contribute to sustainable development.
Report Scope & Segmentation Analysis
This report provides a detailed segmentation analysis of the Formulation Additive market based on type (Defoamers, Rheology Modifiers, Dispersing Agents, Other Additives) and end-user industry (Construction, Transportation, Automotive, Oil and Gas, Food and Beverage, Electronics, Other End-user Industries). Each segment's growth projection, market size, and competitive dynamics are comprehensively analyzed. The report projects substantial growth across all segments, driven by factors such as industrial expansion and rising demand for high-performance materials.
Key Drivers of Formulation Additive Market Growth
Several factors are driving the growth of the Formulation Additive market. These include the rising demand for high-performance materials in diverse end-use sectors, stringent regulatory requirements promoting the use of eco-friendly additives, and technological advancements leading to innovative product development. Government initiatives supporting sustainable manufacturing and infrastructure development are also contributing to market expansion.
Challenges in the Formulation Additive Market Sector
The Formulation Additive market faces challenges such as fluctuating raw material prices, stringent environmental regulations that increase production costs, and intense competition among established players. Supply chain disruptions can also impact production and availability. These factors necessitate strategic planning and innovative solutions to ensure market stability and profitability.
Emerging Opportunities in Formulation Additive Market
Emerging opportunities lie in the development of bio-based additives, nanotechnology-enhanced formulations, and customized solutions tailored to specific end-user needs. Expanding into high-growth markets such as renewable energy and sustainable packaging presents significant potential. Focus on eco-friendly and high-performance additives will be key to capitalizing on these opportunities.
Leading Players in the Formulation Additive Market Market
Key Developments in Formulation Additive Market Industry
- January 2023: Company X launched a new bio-based rheology modifier.
- April 2022: Company Y acquired Company Z, expanding its product portfolio.
- October 2021: New environmental regulations came into effect, impacting the formulation additive market. (Further entries would be added here for a full report.)
Future Outlook for Formulation Additive Market Market
The Formulation Additive market is poised for sustained growth, driven by increasing industrialization, technological innovation, and a growing focus on sustainability. Strategic investments in R&D, expansion into new markets, and the development of eco-friendly additives will play a crucial role in shaping the future of this dynamic industry. The market's potential for expansion remains high, particularly in emerging economies and niche applications.
Formulation Additive Market Segmentation
-
1. Type
- 1.1. Defoamers
- 1.2. Rheology
- 1.3. Modifier
- 1.4. Dispersing Agents
-
2. End-user Industry
- 2.1. Construction
- 2.2. Transportation
- 2.3. Automotive
- 2.4. Oil and Gas
- 2.5. Food and Beverage
- 2.6. Electronics
- 2.7. Other End-user Industries
Formulation Additive Market Segmentation By Geography
-
1. Asia Pacific
- 1.1. China
- 1.2. India
- 1.3. Japan
- 1.4. South Korea
- 1.5. Rest of Asia Pacific
-
2. North America
- 2.1. United States
- 2.2. Canada
- 2.3. Mexico
-
3. Europe
- 3.1. Germany
- 3.2. United Kingdom
- 3.3. France
- 3.4. Italy
- 3.5. Rest of Europe
-
4. South America
- 4.1. Brazil
- 4.2. Argentina
- 4.3. Rest of South America
-
5. Middle East and Africa
- 5.1. Saudi Arabia
- 5.2. South Africa
- 5.3. Rest of Middle East and Africa
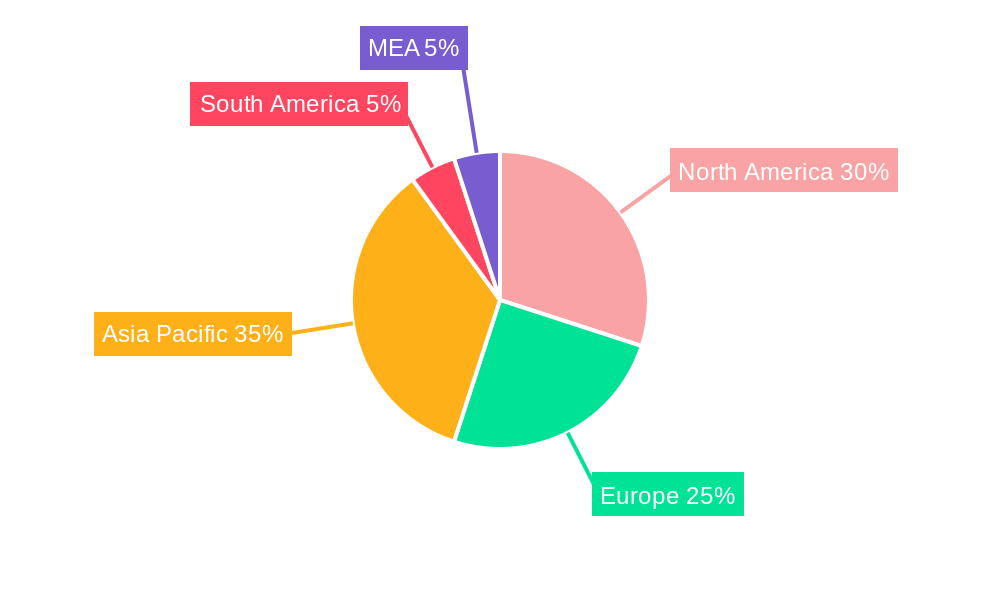
Formulation Additive Market Regional Market Share
Geographic Coverage of Formulation Additive Market
Formulation Additive Market REPORT HIGHLIGHTS
| Aspects | Details |
|---|---|
| Study Period | 2020-2034 |
| Base Year | 2025 |
| Estimated Year | 2026 |
| Forecast Period | 2026-2034 |
| Historical Period | 2020-2025 |
| Growth Rate | CAGR of > 4.00% from 2020-2034 |
| Segmentation |
|
Table of Contents
- 1. Introduction
- 1.1. Research Scope
- 1.2. Market Segmentation
- 1.3. Research Objective
- 1.4. Definitions and Assumptions
- 2. Executive Summary
- 2.1. Market Snapshot
- 3. Market Dynamics
- 3.1. Market Drivers
- 3.2. Market Restrains
- 3.3. Market Trends
- 3.4. Market Opportunities
- 4. Market Factor Analysis
- 4.1. Porters Five Forces
- 4.1.1. Bargaining Power of Suppliers
- 4.1.2. Bargaining Power of Buyers
- 4.1.3. Threat of New Entrants
- 4.1.4. Threat of Substitutes
- 4.1.5. Competitive Rivalry
- 4.2. PESTEL analysis
- 4.3. BCG Analysis
- 4.3.1. Stars (High Growth, High Market Share)
- 4.3.2. Cash Cows (Low Growth, High Market Share)
- 4.3.3. Question Mark (High Growth, Low Market Share)
- 4.3.4. Dogs (Low Growth, Low Market Share)
- 4.4. Ansoff Matrix Analysis
- 4.5. Supply Chain Analysis
- 4.6. Regulatory Landscape
- 4.7. Current Market Potential and Opportunity Assessment (TAM–SAM–SOM Framework)
- 4.8. PRI Analyst Note
- 4.1. Porters Five Forces
- 5. Market Analysis, Insights and Forecast 2021-2033
- 5.1. Market Analysis, Insights and Forecast - by Type
- 5.1.1. Defoamers
- 5.1.2. Rheology
- 5.1.3. Modifier
- 5.1.4. Dispersing Agents
- 5.2. Market Analysis, Insights and Forecast - by End-user Industry
- 5.2.1. Construction
- 5.2.2. Transportation
- 5.2.3. Automotive
- 5.2.4. Oil and Gas
- 5.2.5. Food and Beverage
- 5.2.6. Electronics
- 5.2.7. Other End-user Industries
- 5.3. Market Analysis, Insights and Forecast - by Region
- 5.3.1. Asia Pacific
- 5.3.2. North America
- 5.3.3. Europe
- 5.3.4. South America
- 5.3.5. Middle East and Africa
- 5.1. Market Analysis, Insights and Forecast - by Type
- 6. Global Formulation Additive Market Analysis, Insights and Forecast, 2021-2033
- 6.1. Market Analysis, Insights and Forecast - by Type
- 6.1.1. Defoamers
- 6.1.2. Rheology
- 6.1.3. Modifier
- 6.1.4. Dispersing Agents
- 6.2. Market Analysis, Insights and Forecast - by End-user Industry
- 6.2.1. Construction
- 6.2.2. Transportation
- 6.2.3. Automotive
- 6.2.4. Oil and Gas
- 6.2.5. Food and Beverage
- 6.2.6. Electronics
- 6.2.7. Other End-user Industries
- 6.1. Market Analysis, Insights and Forecast - by Type
- 7. Asia Pacific Formulation Additive Market Analysis, Insights and Forecast, 2020-2032
- 7.1. Market Analysis, Insights and Forecast - by Type
- 7.1.1. Defoamers
- 7.1.2. Rheology
- 7.1.3. Modifier
- 7.1.4. Dispersing Agents
- 7.2. Market Analysis, Insights and Forecast - by End-user Industry
- 7.2.1. Construction
- 7.2.2. Transportation
- 7.2.3. Automotive
- 7.2.4. Oil and Gas
- 7.2.5. Food and Beverage
- 7.2.6. Electronics
- 7.2.7. Other End-user Industries
- 7.1. Market Analysis, Insights and Forecast - by Type
- 8. North America Formulation Additive Market Analysis, Insights and Forecast, 2020-2032
- 8.1. Market Analysis, Insights and Forecast - by Type
- 8.1.1. Defoamers
- 8.1.2. Rheology
- 8.1.3. Modifier
- 8.1.4. Dispersing Agents
- 8.2. Market Analysis, Insights and Forecast - by End-user Industry
- 8.2.1. Construction
- 8.2.2. Transportation
- 8.2.3. Automotive
- 8.2.4. Oil and Gas
- 8.2.5. Food and Beverage
- 8.2.6. Electronics
- 8.2.7. Other End-user Industries
- 8.1. Market Analysis, Insights and Forecast - by Type
- 9. Europe Formulation Additive Market Analysis, Insights and Forecast, 2020-2032
- 9.1. Market Analysis, Insights and Forecast - by Type
- 9.1.1. Defoamers
- 9.1.2. Rheology
- 9.1.3. Modifier
- 9.1.4. Dispersing Agents
- 9.2. Market Analysis, Insights and Forecast - by End-user Industry
- 9.2.1. Construction
- 9.2.2. Transportation
- 9.2.3. Automotive
- 9.2.4. Oil and Gas
- 9.2.5. Food and Beverage
- 9.2.6. Electronics
- 9.2.7. Other End-user Industries
- 9.1. Market Analysis, Insights and Forecast - by Type
- 10. South America Formulation Additive Market Analysis, Insights and Forecast, 2020-2032
- 10.1. Market Analysis, Insights and Forecast - by Type
- 10.1.1. Defoamers
- 10.1.2. Rheology
- 10.1.3. Modifier
- 10.1.4. Dispersing Agents
- 10.2. Market Analysis, Insights and Forecast - by End-user Industry
- 10.2.1. Construction
- 10.2.2. Transportation
- 10.2.3. Automotive
- 10.2.4. Oil and Gas
- 10.2.5. Food and Beverage
- 10.2.6. Electronics
- 10.2.7. Other End-user Industries
- 10.1. Market Analysis, Insights and Forecast - by Type
- 11. Middle East and Africa Formulation Additive Market Analysis, Insights and Forecast, 2020-2032
- 11.1. Market Analysis, Insights and Forecast - by Type
- 11.1.1. Defoamers
- 11.1.2. Rheology
- 11.1.3. Modifier
- 11.1.4. Dispersing Agents
- 11.2. Market Analysis, Insights and Forecast - by End-user Industry
- 11.2.1. Construction
- 11.2.2. Transportation
- 11.2.3. Automotive
- 11.2.4. Oil and Gas
- 11.2.5. Food and Beverage
- 11.2.6. Electronics
- 11.2.7. Other End-user Industries
- 11.1. Market Analysis, Insights and Forecast - by Type
- 12. Competitive Analysis
- 12.1. Company Profiles
- 12.1.1 Honeywell International Inc
- 12.1.1.1. Company Overview
- 12.1.1.2. Products
- 12.1.1.3. Company Financials
- 12.1.1.4. SWOT Analysis
- 12.1.2 Arkema
- 12.1.2.1. Company Overview
- 12.1.2.2. Products
- 12.1.2.3. Company Financials
- 12.1.2.4. SWOT Analysis
- 12.1.3 BYK (A member of ALTANA)
- 12.1.3.1. Company Overview
- 12.1.3.2. Products
- 12.1.3.3. Company Financials
- 12.1.3.4. SWOT Analysis
- 12.1.4 Evonik Industries AG
- 12.1.4.1. Company Overview
- 12.1.4.2. Products
- 12.1.4.3. Company Financials
- 12.1.4.4. SWOT Analysis
- 12.1.5 Cabot Corporation
- 12.1.5.1. Company Overview
- 12.1.5.2. Products
- 12.1.5.3. Company Financials
- 12.1.5.4. SWOT Analysis
- 12.1.6 LANXESS
- 12.1.6.1. Company Overview
- 12.1.6.2. Products
- 12.1.6.3. Company Financials
- 12.1.6.4. SWOT Analysis
- 12.1.7 Momentive
- 12.1.7.1. Company Overview
- 12.1.7.2. Products
- 12.1.7.3. Company Financials
- 12.1.7.4. SWOT Analysis
- 12.1.8 BASF SE
- 12.1.8.1. Company Overview
- 12.1.8.2. Products
- 12.1.8.3. Company Financials
- 12.1.8.4. SWOT Analysis
- 12.1.9 Huntsman International LLC
- 12.1.9.1. Company Overview
- 12.1.9.2. Products
- 12.1.9.3. Company Financials
- 12.1.9.4. SWOT Analysis
- 12.1.10 Dow
- 12.1.10.1. Company Overview
- 12.1.10.2. Products
- 12.1.10.3. Company Financials
- 12.1.10.4. SWOT Analysis
- 12.1.11 Eastman Chemical Company
- 12.1.11.1. Company Overview
- 12.1.11.2. Products
- 12.1.11.3. Company Financials
- 12.1.11.4. SWOT Analysis
- 12.1.12 MÜNZING Corporation
- 12.1.12.1. Company Overview
- 12.1.12.2. Products
- 12.1.12.3. Company Financials
- 12.1.12.4. SWOT Analysis
- 12.1.1 Honeywell International Inc
- 12.2. Market Entropy
- 12.2.1 Company's Key Areas Served
- 12.2.2 Recent Developments
- 12.3. Company Market Share Analysis 2025
- 12.3.1 Top 5 Companies Market Share Analysis
- 12.3.2 Top 3 Companies Market Share Analysis
- 12.4. List of Potential Customers
- 13. Research Methodology
List of Figures
- Figure 1: Global Formulation Additive Market Revenue Breakdown (Million, %) by Region 2025 & 2033
- Figure 2: Global Formulation Additive Market Volume Breakdown (K Tons, %) by Region 2025 & 2033
- Figure 3: Asia Pacific Formulation Additive Market Revenue (Million), by Type 2025 & 2033
- Figure 4: Asia Pacific Formulation Additive Market Volume (K Tons), by Type 2025 & 2033
- Figure 5: Asia Pacific Formulation Additive Market Revenue Share (%), by Type 2025 & 2033
- Figure 6: Asia Pacific Formulation Additive Market Volume Share (%), by Type 2025 & 2033
- Figure 7: Asia Pacific Formulation Additive Market Revenue (Million), by End-user Industry 2025 & 2033
- Figure 8: Asia Pacific Formulation Additive Market Volume (K Tons), by End-user Industry 2025 & 2033
- Figure 9: Asia Pacific Formulation Additive Market Revenue Share (%), by End-user Industry 2025 & 2033
- Figure 10: Asia Pacific Formulation Additive Market Volume Share (%), by End-user Industry 2025 & 2033
- Figure 11: Asia Pacific Formulation Additive Market Revenue (Million), by Country 2025 & 2033
- Figure 12: Asia Pacific Formulation Additive Market Volume (K Tons), by Country 2025 & 2033
- Figure 13: Asia Pacific Formulation Additive Market Revenue Share (%), by Country 2025 & 2033
- Figure 14: Asia Pacific Formulation Additive Market Volume Share (%), by Country 2025 & 2033
- Figure 15: North America Formulation Additive Market Revenue (Million), by Type 2025 & 2033
- Figure 16: North America Formulation Additive Market Volume (K Tons), by Type 2025 & 2033
- Figure 17: North America Formulation Additive Market Revenue Share (%), by Type 2025 & 2033
- Figure 18: North America Formulation Additive Market Volume Share (%), by Type 2025 & 2033
- Figure 19: North America Formulation Additive Market Revenue (Million), by End-user Industry 2025 & 2033
- Figure 20: North America Formulation Additive Market Volume (K Tons), by End-user Industry 2025 & 2033
- Figure 21: North America Formulation Additive Market Revenue Share (%), by End-user Industry 2025 & 2033
- Figure 22: North America Formulation Additive Market Volume Share (%), by End-user Industry 2025 & 2033
- Figure 23: North America Formulation Additive Market Revenue (Million), by Country 2025 & 2033
- Figure 24: North America Formulation Additive Market Volume (K Tons), by Country 2025 & 2033
- Figure 25: North America Formulation Additive Market Revenue Share (%), by Country 2025 & 2033
- Figure 26: North America Formulation Additive Market Volume Share (%), by Country 2025 & 2033
- Figure 27: Europe Formulation Additive Market Revenue (Million), by Type 2025 & 2033
- Figure 28: Europe Formulation Additive Market Volume (K Tons), by Type 2025 & 2033
- Figure 29: Europe Formulation Additive Market Revenue Share (%), by Type 2025 & 2033
- Figure 30: Europe Formulation Additive Market Volume Share (%), by Type 2025 & 2033
- Figure 31: Europe Formulation Additive Market Revenue (Million), by End-user Industry 2025 & 2033
- Figure 32: Europe Formulation Additive Market Volume (K Tons), by End-user Industry 2025 & 2033
- Figure 33: Europe Formulation Additive Market Revenue Share (%), by End-user Industry 2025 & 2033
- Figure 34: Europe Formulation Additive Market Volume Share (%), by End-user Industry 2025 & 2033
- Figure 35: Europe Formulation Additive Market Revenue (Million), by Country 2025 & 2033
- Figure 36: Europe Formulation Additive Market Volume (K Tons), by Country 2025 & 2033
- Figure 37: Europe Formulation Additive Market Revenue Share (%), by Country 2025 & 2033
- Figure 38: Europe Formulation Additive Market Volume Share (%), by Country 2025 & 2033
- Figure 39: South America Formulation Additive Market Revenue (Million), by Type 2025 & 2033
- Figure 40: South America Formulation Additive Market Volume (K Tons), by Type 2025 & 2033
- Figure 41: South America Formulation Additive Market Revenue Share (%), by Type 2025 & 2033
- Figure 42: South America Formulation Additive Market Volume Share (%), by Type 2025 & 2033
- Figure 43: South America Formulation Additive Market Revenue (Million), by End-user Industry 2025 & 2033
- Figure 44: South America Formulation Additive Market Volume (K Tons), by End-user Industry 2025 & 2033
- Figure 45: South America Formulation Additive Market Revenue Share (%), by End-user Industry 2025 & 2033
- Figure 46: South America Formulation Additive Market Volume Share (%), by End-user Industry 2025 & 2033
- Figure 47: South America Formulation Additive Market Revenue (Million), by Country 2025 & 2033
- Figure 48: South America Formulation Additive Market Volume (K Tons), by Country 2025 & 2033
- Figure 49: South America Formulation Additive Market Revenue Share (%), by Country 2025 & 2033
- Figure 50: South America Formulation Additive Market Volume Share (%), by Country 2025 & 2033
- Figure 51: Middle East and Africa Formulation Additive Market Revenue (Million), by Type 2025 & 2033
- Figure 52: Middle East and Africa Formulation Additive Market Volume (K Tons), by Type 2025 & 2033
- Figure 53: Middle East and Africa Formulation Additive Market Revenue Share (%), by Type 2025 & 2033
- Figure 54: Middle East and Africa Formulation Additive Market Volume Share (%), by Type 2025 & 2033
- Figure 55: Middle East and Africa Formulation Additive Market Revenue (Million), by End-user Industry 2025 & 2033
- Figure 56: Middle East and Africa Formulation Additive Market Volume (K Tons), by End-user Industry 2025 & 2033
- Figure 57: Middle East and Africa Formulation Additive Market Revenue Share (%), by End-user Industry 2025 & 2033
- Figure 58: Middle East and Africa Formulation Additive Market Volume Share (%), by End-user Industry 2025 & 2033
- Figure 59: Middle East and Africa Formulation Additive Market Revenue (Million), by Country 2025 & 2033
- Figure 60: Middle East and Africa Formulation Additive Market Volume (K Tons), by Country 2025 & 2033
- Figure 61: Middle East and Africa Formulation Additive Market Revenue Share (%), by Country 2025 & 2033
- Figure 62: Middle East and Africa Formulation Additive Market Volume Share (%), by Country 2025 & 2033
List of Tables
- Table 1: Global Formulation Additive Market Revenue Million Forecast, by Type 2020 & 2033
- Table 2: Global Formulation Additive Market Volume K Tons Forecast, by Type 2020 & 2033
- Table 3: Global Formulation Additive Market Revenue Million Forecast, by End-user Industry 2020 & 2033
- Table 4: Global Formulation Additive Market Volume K Tons Forecast, by End-user Industry 2020 & 2033
- Table 5: Global Formulation Additive Market Revenue Million Forecast, by Region 2020 & 2033
- Table 6: Global Formulation Additive Market Volume K Tons Forecast, by Region 2020 & 2033
- Table 7: Global Formulation Additive Market Revenue Million Forecast, by Type 2020 & 2033
- Table 8: Global Formulation Additive Market Volume K Tons Forecast, by Type 2020 & 2033
- Table 9: Global Formulation Additive Market Revenue Million Forecast, by End-user Industry 2020 & 2033
- Table 10: Global Formulation Additive Market Volume K Tons Forecast, by End-user Industry 2020 & 2033
- Table 11: Global Formulation Additive Market Revenue Million Forecast, by Country 2020 & 2033
- Table 12: Global Formulation Additive Market Volume K Tons Forecast, by Country 2020 & 2033
- Table 13: China Formulation Additive Market Revenue (Million) Forecast, by Application 2020 & 2033
- Table 14: China Formulation Additive Market Volume (K Tons) Forecast, by Application 2020 & 2033
- Table 15: India Formulation Additive Market Revenue (Million) Forecast, by Application 2020 & 2033
- Table 16: India Formulation Additive Market Volume (K Tons) Forecast, by Application 2020 & 2033
- Table 17: Japan Formulation Additive Market Revenue (Million) Forecast, by Application 2020 & 2033
- Table 18: Japan Formulation Additive Market Volume (K Tons) Forecast, by Application 2020 & 2033
- Table 19: South Korea Formulation Additive Market Revenue (Million) Forecast, by Application 2020 & 2033
- Table 20: South Korea Formulation Additive Market Volume (K Tons) Forecast, by Application 2020 & 2033
- Table 21: Rest of Asia Pacific Formulation Additive Market Revenue (Million) Forecast, by Application 2020 & 2033
- Table 22: Rest of Asia Pacific Formulation Additive Market Volume (K Tons) Forecast, by Application 2020 & 2033
- Table 23: Global Formulation Additive Market Revenue Million Forecast, by Type 2020 & 2033
- Table 24: Global Formulation Additive Market Volume K Tons Forecast, by Type 2020 & 2033
- Table 25: Global Formulation Additive Market Revenue Million Forecast, by End-user Industry 2020 & 2033
- Table 26: Global Formulation Additive Market Volume K Tons Forecast, by End-user Industry 2020 & 2033
- Table 27: Global Formulation Additive Market Revenue Million Forecast, by Country 2020 & 2033
- Table 28: Global Formulation Additive Market Volume K Tons Forecast, by Country 2020 & 2033
- Table 29: United States Formulation Additive Market Revenue (Million) Forecast, by Application 2020 & 2033
- Table 30: United States Formulation Additive Market Volume (K Tons) Forecast, by Application 2020 & 2033
- Table 31: Canada Formulation Additive Market Revenue (Million) Forecast, by Application 2020 & 2033
- Table 32: Canada Formulation Additive Market Volume (K Tons) Forecast, by Application 2020 & 2033
- Table 33: Mexico Formulation Additive Market Revenue (Million) Forecast, by Application 2020 & 2033
- Table 34: Mexico Formulation Additive Market Volume (K Tons) Forecast, by Application 2020 & 2033
- Table 35: Global Formulation Additive Market Revenue Million Forecast, by Type 2020 & 2033
- Table 36: Global Formulation Additive Market Volume K Tons Forecast, by Type 2020 & 2033
- Table 37: Global Formulation Additive Market Revenue Million Forecast, by End-user Industry 2020 & 2033
- Table 38: Global Formulation Additive Market Volume K Tons Forecast, by End-user Industry 2020 & 2033
- Table 39: Global Formulation Additive Market Revenue Million Forecast, by Country 2020 & 2033
- Table 40: Global Formulation Additive Market Volume K Tons Forecast, by Country 2020 & 2033
- Table 41: Germany Formulation Additive Market Revenue (Million) Forecast, by Application 2020 & 2033
- Table 42: Germany Formulation Additive Market Volume (K Tons) Forecast, by Application 2020 & 2033
- Table 43: United Kingdom Formulation Additive Market Revenue (Million) Forecast, by Application 2020 & 2033
- Table 44: United Kingdom Formulation Additive Market Volume (K Tons) Forecast, by Application 2020 & 2033
- Table 45: France Formulation Additive Market Revenue (Million) Forecast, by Application 2020 & 2033
- Table 46: France Formulation Additive Market Volume (K Tons) Forecast, by Application 2020 & 2033
- Table 47: Italy Formulation Additive Market Revenue (Million) Forecast, by Application 2020 & 2033
- Table 48: Italy Formulation Additive Market Volume (K Tons) Forecast, by Application 2020 & 2033
- Table 49: Rest of Europe Formulation Additive Market Revenue (Million) Forecast, by Application 2020 & 2033
- Table 50: Rest of Europe Formulation Additive Market Volume (K Tons) Forecast, by Application 2020 & 2033
- Table 51: Global Formulation Additive Market Revenue Million Forecast, by Type 2020 & 2033
- Table 52: Global Formulation Additive Market Volume K Tons Forecast, by Type 2020 & 2033
- Table 53: Global Formulation Additive Market Revenue Million Forecast, by End-user Industry 2020 & 2033
- Table 54: Global Formulation Additive Market Volume K Tons Forecast, by End-user Industry 2020 & 2033
- Table 55: Global Formulation Additive Market Revenue Million Forecast, by Country 2020 & 2033
- Table 56: Global Formulation Additive Market Volume K Tons Forecast, by Country 2020 & 2033
- Table 57: Brazil Formulation Additive Market Revenue (Million) Forecast, by Application 2020 & 2033
- Table 58: Brazil Formulation Additive Market Volume (K Tons) Forecast, by Application 2020 & 2033
- Table 59: Argentina Formulation Additive Market Revenue (Million) Forecast, by Application 2020 & 2033
- Table 60: Argentina Formulation Additive Market Volume (K Tons) Forecast, by Application 2020 & 2033
- Table 61: Rest of South America Formulation Additive Market Revenue (Million) Forecast, by Application 2020 & 2033
- Table 62: Rest of South America Formulation Additive Market Volume (K Tons) Forecast, by Application 2020 & 2033
- Table 63: Global Formulation Additive Market Revenue Million Forecast, by Type 2020 & 2033
- Table 64: Global Formulation Additive Market Volume K Tons Forecast, by Type 2020 & 2033
- Table 65: Global Formulation Additive Market Revenue Million Forecast, by End-user Industry 2020 & 2033
- Table 66: Global Formulation Additive Market Volume K Tons Forecast, by End-user Industry 2020 & 2033
- Table 67: Global Formulation Additive Market Revenue Million Forecast, by Country 2020 & 2033
- Table 68: Global Formulation Additive Market Volume K Tons Forecast, by Country 2020 & 2033
- Table 69: Saudi Arabia Formulation Additive Market Revenue (Million) Forecast, by Application 2020 & 2033
- Table 70: Saudi Arabia Formulation Additive Market Volume (K Tons) Forecast, by Application 2020 & 2033
- Table 71: South Africa Formulation Additive Market Revenue (Million) Forecast, by Application 2020 & 2033
- Table 72: South Africa Formulation Additive Market Volume (K Tons) Forecast, by Application 2020 & 2033
- Table 73: Rest of Middle East and Africa Formulation Additive Market Revenue (Million) Forecast, by Application 2020 & 2033
- Table 74: Rest of Middle East and Africa Formulation Additive Market Volume (K Tons) Forecast, by Application 2020 & 2033
Frequently Asked Questions
1. What is the projected Compound Annual Growth Rate (CAGR) of the Formulation Additive Market?
The projected CAGR is approximately > 4.00%.
2. Which companies are prominent players in the Formulation Additive Market?
Key companies in the market include Honeywell International Inc, Arkema, BYK (A member of ALTANA), Evonik Industries AG, Cabot Corporation, LANXESS, Momentive, BASF SE, Huntsman International LLC, Dow, Eastman Chemical Company, MÜNZING Corporation.
3. What are the main segments of the Formulation Additive Market?
The market segments include Type, End-user Industry.
4. Can you provide details about the market size?
The market size is estimated to be USD XX Million as of 2022.
5. What are some drivers contributing to market growth?
; Increase Demand from Construction and Transportation Industries; Other Drivers.
6. What are the notable trends driving market growth?
Construction Sector to Dominate the Market.
7. Are there any restraints impacting market growth?
; Fluctuating Raw Material Prices; Unfavorable Conditions Arising Due to COVID-19.
8. Can you provide examples of recent developments in the market?
N/A
9. What pricing options are available for accessing the report?
Pricing options include single-user, multi-user, and enterprise licenses priced at USD 4750, USD 5250, and USD 8750 respectively.
10. Is the market size provided in terms of value or volume?
The market size is provided in terms of value, measured in Million and volume, measured in K Tons.
11. Are there any specific market keywords associated with the report?
Yes, the market keyword associated with the report is "Formulation Additive Market," which aids in identifying and referencing the specific market segment covered.
12. How do I determine which pricing option suits my needs best?
The pricing options vary based on user requirements and access needs. Individual users may opt for single-user licenses, while businesses requiring broader access may choose multi-user or enterprise licenses for cost-effective access to the report.
13. Are there any additional resources or data provided in the Formulation Additive Market report?
While the report offers comprehensive insights, it's advisable to review the specific contents or supplementary materials provided to ascertain if additional resources or data are available.
14. How can I stay updated on further developments or reports in the Formulation Additive Market?
To stay informed about further developments, trends, and reports in the Formulation Additive Market, consider subscribing to industry newsletters, following relevant companies and organizations, or regularly checking reputable industry news sources and publications.
Methodology
Step 1 - Identification of Relevant Samples Size from Population Database


Step 2 - Approaches for Defining Global Market Size (Value, Volume* & Price*)

Note*: In applicable scenarios
Step 3 - Data Sources
Primary Research
- Web Analytics
- Survey Reports
- Research Institute
- Latest Research Reports
- Opinion Leaders
Secondary Research
- Annual Reports
- White Paper
- Latest Press Release
- Industry Association
- Paid Database
- Investor Presentations

Step 4 - Data Triangulation
Involves using different sources of information in order to increase the validity of a study
These sources are likely to be stakeholders in a program - participants, other researchers, program staff, other community members, and so on.
Then we put all data in single framework & apply various statistical tools to find out the dynamic on the market.
During the analysis stage, feedback from the stakeholder groups would be compared to determine areas of agreement as well as areas of divergence