

Key Insights
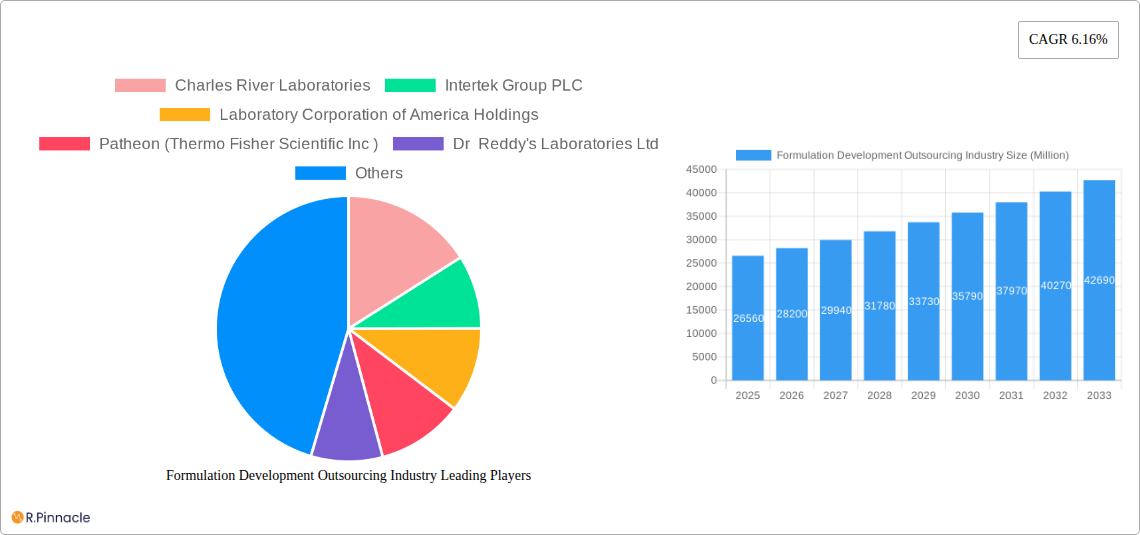
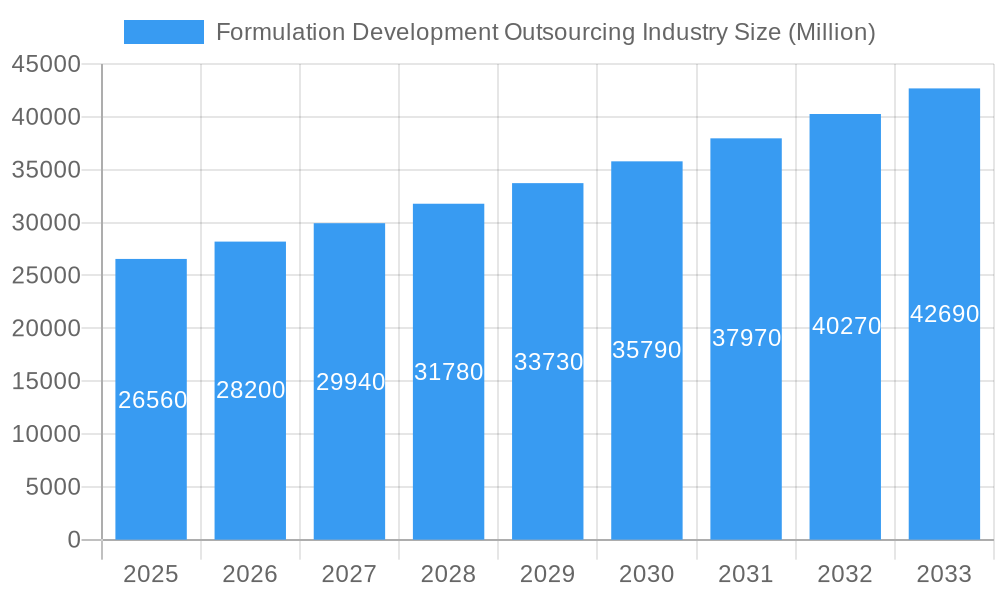
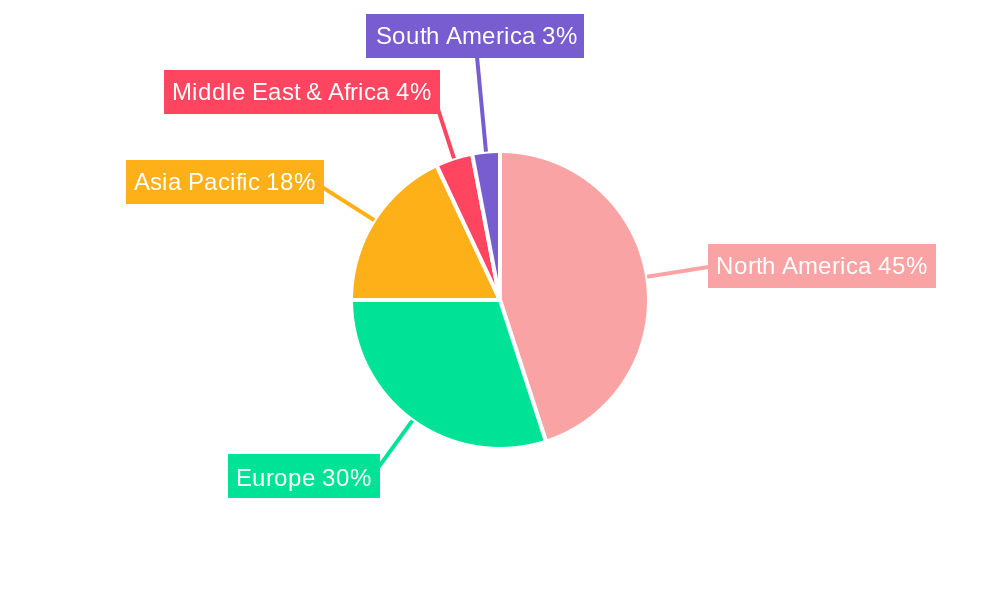
The Formulation Development Outsourcing (FDO) market is experiencing robust growth, projected to reach \$26.56 billion in 2025 and maintain a Compound Annual Growth Rate (CAGR) of 6.16% from 2025 to 2033. This expansion is driven by several key factors. Pharmaceutical and biopharmaceutical companies are increasingly outsourcing formulation development activities to specialized contract research organizations (CROs) and contract manufacturing organizations (CMOs) to reduce costs, accelerate time-to-market, and access specialized expertise. The rising complexity of drug development, particularly in areas like biologics and advanced therapies, further fuels this trend. Growing demand for innovative drug delivery systems, such as injectables and targeted therapies, also contributes significantly to market growth. Geographically, North America currently holds a dominant market share, owing to a strong presence of pharmaceutical companies and well-established CRO/CMO infrastructure. However, the Asia-Pacific region is expected to witness significant growth in the coming years, driven by expanding pharmaceutical industries in countries like India and China. Specific application areas like oncology, genetic disorders, and infectious diseases are major drivers, reflecting the ongoing focus on developing treatments for these prevalent conditions. The market is segmented by application, end-user, service type, and dosage form, providing opportunities for specialized CROs and CMOs to focus on niche areas and build expertise. Challenges such as stringent regulatory requirements and intellectual property concerns are expected to persist, but the overall market outlook remains positive, indicating substantial growth potential throughout the forecast period.
Formulation Development Outsourcing Industry Market Size (In Billion)
The FDO market's segmentation offers further insights into its dynamics. The oncology segment is expected to dominate due to the high investment in cancer research and development. Pre-formulation services are widely outsourced, reflecting the need for early-stage expertise in drug development. Pharmaceutical and biopharmaceutical companies represent the largest end-user segment, while the growing importance of academic research and government initiatives is driving growth in the government and academic institutes segment. Injectable dosage forms are expected to maintain a significant market share driven by the need for targeted delivery systems in areas like biologics and advanced therapies. While North America currently leads, the Asia-Pacific region presents significant untapped potential, promising considerable growth in the years to come, especially as regulatory frameworks evolve and become more supportive of outsourcing practices. The competitive landscape features both large multinational CROs and smaller specialized players, presenting opportunities for collaboration and consolidation.
Formulation Development Outsourcing Industry Company Market Share
Formulation Development Outsourcing Industry: A Comprehensive Market Report (2019-2033)
This comprehensive report provides an in-depth analysis of the Formulation Development Outsourcing industry, offering invaluable insights for industry professionals, investors, and strategic decision-makers. With a focus on market dynamics, key players, and future trends, this report covers the period from 2019 to 2033, with a base year of 2025 and a forecast period of 2025-2033. The global market size in 2025 is estimated at $XX Million.
Formulation Development Outsourcing Industry Market Structure & Innovation Trends
The Formulation Development Outsourcing market is characterized by a moderately concentrated landscape, with key players such as Charles River Laboratories, Intertek Group PLC, Laboratory Corporation of America Holdings, Patheon (Thermo Fisher Scientific Inc), Dr Reddy's Laboratories Ltd, and others holding significant market share. Market share analysis reveals that the top 5 companies collectively account for approximately XX% of the global market in 2025. Innovation is driven by the need for faster drug development, increasing demand for specialized services, and advancements in analytical technologies. Stringent regulatory frameworks, particularly from agencies like the FDA, heavily influence industry practices. The market witnesses continuous M&A activity, with deal values exceeding $XX Million in recent years. These activities are primarily aimed at expanding service portfolios, geographical reach, and technological capabilities. Product substitutes, such as in-house formulation development, pose a competitive challenge, however, outsourcing continues to grow due to cost-effectiveness and access to specialized expertise. End-user demographics are primarily concentrated in developed nations with robust pharmaceutical and biopharmaceutical sectors, but emerging markets are demonstrating significant growth potential.
Formulation Development Outsourcing Industry Market Dynamics & Trends
The Formulation Development Outsourcing market is experiencing robust growth, projected to register a CAGR of XX% during the forecast period (2025-2033). Several key factors contribute to this growth. The rising prevalence of chronic diseases like cancer, diabetes, and cardiovascular conditions fuels the demand for new and innovative therapies, increasing reliance on outsourcing. Technological advancements, including artificial intelligence (AI) and machine learning (ML) in drug discovery and formulation optimization, are significantly improving efficiency and reducing development timelines. Furthermore, a growing preference for personalized medicine and targeted therapies necessitates sophisticated formulation capabilities, further driving the demand for outsourcing services. Competitive dynamics are characterized by continuous innovation, strategic partnerships, and geographic expansion by leading players. Market penetration rates are high in established markets like North America and Europe, but significant growth opportunities exist in emerging economies of Asia-Pacific and Latin America.
Dominant Regions & Segments in Formulation Development Outsourcing Industry
North America currently holds the largest market share in the Formulation Development Outsourcing industry, driven by a strong presence of pharmaceutical and biopharmaceutical companies, robust R&D investments, and advanced regulatory frameworks. Key drivers include favorable government policies supporting drug development, well-established infrastructure, and a highly skilled workforce.
- Leading Application Segment: Oncology continues to dominate, fueled by the high prevalence of cancer and continuous advancements in cancer therapeutics.
- Leading End-User Segment: Pharmaceutical and biopharmaceutical companies constitute the largest end-user segment due to their increasing outsourcing needs.
- Leading Service Segment: Analytical services, particularly formulation optimization, is witnessing high demand due to the growing need for precise and efficient formulation development.
- Leading Dosage Form Segment: Injectable dosage forms maintain a significant market share due to their efficacy and suitability for various therapeutic applications.
Other regions like Europe and Asia-Pacific are exhibiting strong growth potential, driven by increasing investments in healthcare infrastructure, rising healthcare expenditure, and a growing prevalence of chronic diseases.
Formulation Development Outsourcing Industry Product Innovations
Recent innovations in the formulation development outsourcing sector include the application of advanced analytical techniques like high-throughput screening and AI-powered modeling for faster formulation optimization. The development of novel drug delivery systems, such as liposomes and nanoparticles, is enhancing drug efficacy and patient compliance. These innovations provide significant competitive advantages by reducing development time and cost, while simultaneously improving drug product quality and efficacy. Market fit is high due to a growing need for innovative drug delivery systems and improved drug development efficiency.
Report Scope & Segmentation Analysis
This report segments the Formulation Development Outsourcing market based on Application (Oncology, Genetic Disorders, Neurology, Infectious Diseases, Respiratory, Cardiovascular, Other Applications), End-User (Pharmaceutical and Biopharmaceutical Companies, Government and Academic Institutes), Service (Pre-formulation Services, Analytical Services: Formulation Optimization), and Dosage Form (Injectable, Oral, Topical, Other Dosage Forms). Each segment’s growth projections, market size estimates, and competitive dynamics are analyzed individually, providing a granular understanding of the market landscape. For example, the Oncology application segment is projected to grow at XX% CAGR during the forecast period, driven by the rising prevalence of cancer and increasing R&D investments.
Key Drivers of Formulation Development Outsourcing Industry Growth
Several factors fuel the growth of the Formulation Development Outsourcing industry. Technological advancements in drug delivery systems and analytical techniques are significantly impacting efficiency and innovation. Favorable regulatory frameworks and government incentives for drug development contribute to increased outsourcing. The rising prevalence of chronic diseases and the growing need for personalized medicine create a high demand for specialized formulation services. Cost-effectiveness and access to expert knowledge are other significant drivers that propel market growth.
Challenges in the Formulation Development Outsourcing Industry Sector
The Formulation Development Outsourcing industry faces several challenges. Stringent regulatory approvals and compliance requirements can lead to increased development timelines and costs. Maintaining a robust and reliable supply chain is critical, as disruptions can impact project timelines and overall efficiency. Intense competition from established players and new entrants necessitates continuous innovation and strategic adjustments. These challenges, if not addressed effectively, could impact overall market growth.
Emerging Opportunities in Formulation Development Outsourcing Industry
Emerging opportunities exist in personalized medicine, where tailored formulations are crucial. The adoption of advanced technologies such as AI and ML offers significant potential for improving formulation optimization and development speed. Expanding into emerging markets with high growth potential presents significant opportunities for market expansion. The increasing focus on sustainability and environmentally friendly formulations represents a further opportunity for specialized service providers.
Leading Players in the Formulation Development Outsourcing Industry Market
- Charles River Laboratories
- Intertek Group PLC
- Laboratory Corporation of America Holdings
- Patheon (Thermo Fisher Scientific Inc)
- Dr Reddy's Laboratories Ltd
- Irisys LLC
- Aizant Drug Research Solutions Private Limited
- Syngene International Ltd
- Lonza Group AG
- Piramal Pharma Solutions
- Qiotient Sciences
- Catalent Inc
- Emergent BioSolutions Inc
Key Developments in Formulation Development Outsourcing Industry
- January 2023: Company X launched a new AI-powered formulation optimization platform.
- June 2022: Company Y acquired Company Z, expanding its service portfolio.
- October 2021: New FDA guidelines on drug development were released, impacting industry practices. (Further details would be included in the full report)
Future Outlook for Formulation Development Outsourcing Industry Market
The Formulation Development Outsourcing market is poised for continued growth, driven by technological advancements, increasing demand for specialized services, and expanding global healthcare expenditure. Strategic partnerships, investments in R&D, and expansion into new markets will shape the competitive landscape. The market's future potential remains robust, with opportunities for innovation and market share expansion for leading players.
Formulation Development Outsourcing Industry Segmentation
-
1. Service
-
1.1. Pre-formulation Services
- 1.1.1. Discovery and Preclinical Services
- 1.1.2. Analytical Services
-
1.2. Formulation Optimization
- 1.2.1. Phase I
- 1.2.2. Phase II
- 1.2.3. Phase III
- 1.2.4. Phase IV
-
1.1. Pre-formulation Services
-
2. Dosage Form
- 2.1. Injectable
- 2.2. Oral
- 2.3. Topical
- 2.4. Other Dosage Forms
-
3. Application
- 3.1. Oncology
- 3.2. Genetic Disorders
- 3.3. Neurology
- 3.4. Infectious Diseases
- 3.5. Respiratory
- 3.6. Cardiovascular
- 3.7. Other Applications
-
4. End User
- 4.1. Pharmaceutical and Biopharmaceutical Companies
- 4.2. Government and Academic Institutes
Formulation Development Outsourcing Industry Segmentation By Geography
-
1. North America
- 1.1. United States
- 1.2. Canada
- 1.3. Mexico
-
2. Europe
- 2.1. Germany
- 2.2. United Kingdom
- 2.3. France
- 2.4. Italy
- 2.5. Spain
- 2.6. Rest of Europe
-
3. Asia Pacific
- 3.1. China
- 3.2. Japan
- 3.3. India
- 3.4. Australia
- 3.5. South Korea
- 3.6. Rest of Asia Pacific
-
4. Middle East and Africa
- 4.1. GCC
- 4.2. South Africa
- 4.3. Rest of Middle East and Africa
-
5. South America
- 5.1. Brazil
- 5.2. Argentina
- 5.3. Rest of South America
Formulation Development Outsourcing Industry Regional Market Share
Geographic Coverage of Formulation Development Outsourcing Industry
Formulation Development Outsourcing Industry REPORT HIGHLIGHTS
| Aspects | Details |
|---|---|
| Study Period | 2020-2034 |
| Base Year | 2025 |
| Estimated Year | 2026 |
| Forecast Period | 2026-2034 |
| Historical Period | 2020-2025 |
| Growth Rate | CAGR of 6.16% from 2020-2034 |
| Segmentation |
|
Table of Contents
- 1. Introduction
- 1.1. Research Scope
- 1.2. Market Segmentation
- 1.3. Research Objective
- 1.4. Definitions and Assumptions
- 2. Executive Summary
- 2.1. Market Snapshot
- 3. Market Dynamics
- 3.1. Market Drivers
- 3.2. Market Restrains
- 3.3. Market Trends
- 3.4. Market Opportunities
- 4. Market Factor Analysis
- 4.1. Porters Five Forces
- 4.1.1. Bargaining Power of Suppliers
- 4.1.2. Bargaining Power of Buyers
- 4.1.3. Threat of New Entrants
- 4.1.4. Threat of Substitutes
- 4.1.5. Competitive Rivalry
- 4.2. PESTEL analysis
- 4.3. BCG Analysis
- 4.3.1. Stars (High Growth, High Market Share)
- 4.3.2. Cash Cows (Low Growth, High Market Share)
- 4.3.3. Question Mark (High Growth, Low Market Share)
- 4.3.4. Dogs (Low Growth, Low Market Share)
- 4.4. Ansoff Matrix Analysis
- 4.5. Supply Chain Analysis
- 4.6. Regulatory Landscape
- 4.7. Current Market Potential and Opportunity Assessment (TAM–SAM–SOM Framework)
- 4.8. PRI Analyst Note
- 4.1. Porters Five Forces
- 5. Market Analysis, Insights and Forecast 2021-2033
- 5.1. Market Analysis, Insights and Forecast - by Service
- 5.1.1. Pre-formulation Services
- 5.1.1.1. Discovery and Preclinical Services
- 5.1.1.2. Analytical Services
- 5.1.2. Formulation Optimization
- 5.1.2.1. Phase I
- 5.1.2.2. Phase II
- 5.1.2.3. Phase III
- 5.1.2.4. Phase IV
- 5.1.1. Pre-formulation Services
- 5.2. Market Analysis, Insights and Forecast - by Dosage Form
- 5.2.1. Injectable
- 5.2.2. Oral
- 5.2.3. Topical
- 5.2.4. Other Dosage Forms
- 5.3. Market Analysis, Insights and Forecast - by Application
- 5.3.1. Oncology
- 5.3.2. Genetic Disorders
- 5.3.3. Neurology
- 5.3.4. Infectious Diseases
- 5.3.5. Respiratory
- 5.3.6. Cardiovascular
- 5.3.7. Other Applications
- 5.4. Market Analysis, Insights and Forecast - by End User
- 5.4.1. Pharmaceutical and Biopharmaceutical Companies
- 5.4.2. Government and Academic Institutes
- 5.5. Market Analysis, Insights and Forecast - by Region
- 5.5.1. North America
- 5.5.2. Europe
- 5.5.3. Asia Pacific
- 5.5.4. Middle East and Africa
- 5.5.5. South America
- 5.1. Market Analysis, Insights and Forecast - by Service
- 6. Global Formulation Development Outsourcing Industry Analysis, Insights and Forecast, 2021-2033
- 6.1. Market Analysis, Insights and Forecast - by Service
- 6.1.1. Pre-formulation Services
- 6.1.1.1. Discovery and Preclinical Services
- 6.1.1.2. Analytical Services
- 6.1.2. Formulation Optimization
- 6.1.2.1. Phase I
- 6.1.2.2. Phase II
- 6.1.2.3. Phase III
- 6.1.2.4. Phase IV
- 6.1.1. Pre-formulation Services
- 6.2. Market Analysis, Insights and Forecast - by Dosage Form
- 6.2.1. Injectable
- 6.2.2. Oral
- 6.2.3. Topical
- 6.2.4. Other Dosage Forms
- 6.3. Market Analysis, Insights and Forecast - by Application
- 6.3.1. Oncology
- 6.3.2. Genetic Disorders
- 6.3.3. Neurology
- 6.3.4. Infectious Diseases
- 6.3.5. Respiratory
- 6.3.6. Cardiovascular
- 6.3.7. Other Applications
- 6.4. Market Analysis, Insights and Forecast - by End User
- 6.4.1. Pharmaceutical and Biopharmaceutical Companies
- 6.4.2. Government and Academic Institutes
- 6.1. Market Analysis, Insights and Forecast - by Service
- 7. North America Formulation Development Outsourcing Industry Analysis, Insights and Forecast, 2020-2032
- 7.1. Market Analysis, Insights and Forecast - by Service
- 7.1.1. Pre-formulation Services
- 7.1.1.1. Discovery and Preclinical Services
- 7.1.1.2. Analytical Services
- 7.1.2. Formulation Optimization
- 7.1.2.1. Phase I
- 7.1.2.2. Phase II
- 7.1.2.3. Phase III
- 7.1.2.4. Phase IV
- 7.1.1. Pre-formulation Services
- 7.2. Market Analysis, Insights and Forecast - by Dosage Form
- 7.2.1. Injectable
- 7.2.2. Oral
- 7.2.3. Topical
- 7.2.4. Other Dosage Forms
- 7.3. Market Analysis, Insights and Forecast - by Application
- 7.3.1. Oncology
- 7.3.2. Genetic Disorders
- 7.3.3. Neurology
- 7.3.4. Infectious Diseases
- 7.3.5. Respiratory
- 7.3.6. Cardiovascular
- 7.3.7. Other Applications
- 7.4. Market Analysis, Insights and Forecast - by End User
- 7.4.1. Pharmaceutical and Biopharmaceutical Companies
- 7.4.2. Government and Academic Institutes
- 7.1. Market Analysis, Insights and Forecast - by Service
- 8. Europe Formulation Development Outsourcing Industry Analysis, Insights and Forecast, 2020-2032
- 8.1. Market Analysis, Insights and Forecast - by Service
- 8.1.1. Pre-formulation Services
- 8.1.1.1. Discovery and Preclinical Services
- 8.1.1.2. Analytical Services
- 8.1.2. Formulation Optimization
- 8.1.2.1. Phase I
- 8.1.2.2. Phase II
- 8.1.2.3. Phase III
- 8.1.2.4. Phase IV
- 8.1.1. Pre-formulation Services
- 8.2. Market Analysis, Insights and Forecast - by Dosage Form
- 8.2.1. Injectable
- 8.2.2. Oral
- 8.2.3. Topical
- 8.2.4. Other Dosage Forms
- 8.3. Market Analysis, Insights and Forecast - by Application
- 8.3.1. Oncology
- 8.3.2. Genetic Disorders
- 8.3.3. Neurology
- 8.3.4. Infectious Diseases
- 8.3.5. Respiratory
- 8.3.6. Cardiovascular
- 8.3.7. Other Applications
- 8.4. Market Analysis, Insights and Forecast - by End User
- 8.4.1. Pharmaceutical and Biopharmaceutical Companies
- 8.4.2. Government and Academic Institutes
- 8.1. Market Analysis, Insights and Forecast - by Service
- 9. Asia Pacific Formulation Development Outsourcing Industry Analysis, Insights and Forecast, 2020-2032
- 9.1. Market Analysis, Insights and Forecast - by Service
- 9.1.1. Pre-formulation Services
- 9.1.1.1. Discovery and Preclinical Services
- 9.1.1.2. Analytical Services
- 9.1.2. Formulation Optimization
- 9.1.2.1. Phase I
- 9.1.2.2. Phase II
- 9.1.2.3. Phase III
- 9.1.2.4. Phase IV
- 9.1.1. Pre-formulation Services
- 9.2. Market Analysis, Insights and Forecast - by Dosage Form
- 9.2.1. Injectable
- 9.2.2. Oral
- 9.2.3. Topical
- 9.2.4. Other Dosage Forms
- 9.3. Market Analysis, Insights and Forecast - by Application
- 9.3.1. Oncology
- 9.3.2. Genetic Disorders
- 9.3.3. Neurology
- 9.3.4. Infectious Diseases
- 9.3.5. Respiratory
- 9.3.6. Cardiovascular
- 9.3.7. Other Applications
- 9.4. Market Analysis, Insights and Forecast - by End User
- 9.4.1. Pharmaceutical and Biopharmaceutical Companies
- 9.4.2. Government and Academic Institutes
- 9.1. Market Analysis, Insights and Forecast - by Service
- 10. Middle East and Africa Formulation Development Outsourcing Industry Analysis, Insights and Forecast, 2020-2032
- 10.1. Market Analysis, Insights and Forecast - by Service
- 10.1.1. Pre-formulation Services
- 10.1.1.1. Discovery and Preclinical Services
- 10.1.1.2. Analytical Services
- 10.1.2. Formulation Optimization
- 10.1.2.1. Phase I
- 10.1.2.2. Phase II
- 10.1.2.3. Phase III
- 10.1.2.4. Phase IV
- 10.1.1. Pre-formulation Services
- 10.2. Market Analysis, Insights and Forecast - by Dosage Form
- 10.2.1. Injectable
- 10.2.2. Oral
- 10.2.3. Topical
- 10.2.4. Other Dosage Forms
- 10.3. Market Analysis, Insights and Forecast - by Application
- 10.3.1. Oncology
- 10.3.2. Genetic Disorders
- 10.3.3. Neurology
- 10.3.4. Infectious Diseases
- 10.3.5. Respiratory
- 10.3.6. Cardiovascular
- 10.3.7. Other Applications
- 10.4. Market Analysis, Insights and Forecast - by End User
- 10.4.1. Pharmaceutical and Biopharmaceutical Companies
- 10.4.2. Government and Academic Institutes
- 10.1. Market Analysis, Insights and Forecast - by Service
- 11. South America Formulation Development Outsourcing Industry Analysis, Insights and Forecast, 2020-2032
- 11.1. Market Analysis, Insights and Forecast - by Service
- 11.1.1. Pre-formulation Services
- 11.1.1.1. Discovery and Preclinical Services
- 11.1.1.2. Analytical Services
- 11.1.2. Formulation Optimization
- 11.1.2.1. Phase I
- 11.1.2.2. Phase II
- 11.1.2.3. Phase III
- 11.1.2.4. Phase IV
- 11.1.1. Pre-formulation Services
- 11.2. Market Analysis, Insights and Forecast - by Dosage Form
- 11.2.1. Injectable
- 11.2.2. Oral
- 11.2.3. Topical
- 11.2.4. Other Dosage Forms
- 11.3. Market Analysis, Insights and Forecast - by Application
- 11.3.1. Oncology
- 11.3.2. Genetic Disorders
- 11.3.3. Neurology
- 11.3.4. Infectious Diseases
- 11.3.5. Respiratory
- 11.3.6. Cardiovascular
- 11.3.7. Other Applications
- 11.4. Market Analysis, Insights and Forecast - by End User
- 11.4.1. Pharmaceutical and Biopharmaceutical Companies
- 11.4.2. Government and Academic Institutes
- 11.1. Market Analysis, Insights and Forecast - by Service
- 12. Competitive Analysis
- 12.1. Company Profiles
- 12.1.1 Charles River Laboratories
- 12.1.1.1. Company Overview
- 12.1.1.2. Products
- 12.1.1.3. Company Financials
- 12.1.1.4. SWOT Analysis
- 12.1.2 Intertek Group PLC
- 12.1.2.1. Company Overview
- 12.1.2.2. Products
- 12.1.2.3. Company Financials
- 12.1.2.4. SWOT Analysis
- 12.1.3 Laboratory Corporation of America Holdings
- 12.1.3.1. Company Overview
- 12.1.3.2. Products
- 12.1.3.3. Company Financials
- 12.1.3.4. SWOT Analysis
- 12.1.4 Patheon (Thermo Fisher Scientific Inc )
- 12.1.4.1. Company Overview
- 12.1.4.2. Products
- 12.1.4.3. Company Financials
- 12.1.4.4. SWOT Analysis
- 12.1.5 Dr Reddy's Laboratories Ltd
- 12.1.5.1. Company Overview
- 12.1.5.2. Products
- 12.1.5.3. Company Financials
- 12.1.5.4. SWOT Analysis
- 12.1.6 Irisys LLC
- 12.1.6.1. Company Overview
- 12.1.6.2. Products
- 12.1.6.3. Company Financials
- 12.1.6.4. SWOT Analysis
- 12.1.7 Aizant Drug Research Solutions Private Limited
- 12.1.7.1. Company Overview
- 12.1.7.2. Products
- 12.1.7.3. Company Financials
- 12.1.7.4. SWOT Analysis
- 12.1.8 Syngene International Ltd
- 12.1.8.1. Company Overview
- 12.1.8.2. Products
- 12.1.8.3. Company Financials
- 12.1.8.4. SWOT Analysis
- 12.1.9 Lonza Group AG
- 12.1.9.1. Company Overview
- 12.1.9.2. Products
- 12.1.9.3. Company Financials
- 12.1.9.4. SWOT Analysis
- 12.1.10 Piramal Pharma Solutions
- 12.1.10.1. Company Overview
- 12.1.10.2. Products
- 12.1.10.3. Company Financials
- 12.1.10.4. SWOT Analysis
- 12.1.11 Qiotient Sciences
- 12.1.11.1. Company Overview
- 12.1.11.2. Products
- 12.1.11.3. Company Financials
- 12.1.11.4. SWOT Analysis
- 12.1.12 Catalent Inc
- 12.1.12.1. Company Overview
- 12.1.12.2. Products
- 12.1.12.3. Company Financials
- 12.1.12.4. SWOT Analysis
- 12.1.13 Emergent BioSolutions Inc
- 12.1.13.1. Company Overview
- 12.1.13.2. Products
- 12.1.13.3. Company Financials
- 12.1.13.4. SWOT Analysis
- 12.1.1 Charles River Laboratories
- 12.2. Market Entropy
- 12.2.1 Company's Key Areas Served
- 12.2.2 Recent Developments
- 12.3. Company Market Share Analysis 2025
- 12.3.1 Top 5 Companies Market Share Analysis
- 12.3.2 Top 3 Companies Market Share Analysis
- 12.4. List of Potential Customers
- 13. Research Methodology
List of Figures
- Figure 1: Global Formulation Development Outsourcing Industry Revenue Breakdown (Million, %) by Region 2025 & 2033
- Figure 2: North America Formulation Development Outsourcing Industry Revenue (Million), by Service 2025 & 2033
- Figure 3: North America Formulation Development Outsourcing Industry Revenue Share (%), by Service 2025 & 2033
- Figure 4: North America Formulation Development Outsourcing Industry Revenue (Million), by Dosage Form 2025 & 2033
- Figure 5: North America Formulation Development Outsourcing Industry Revenue Share (%), by Dosage Form 2025 & 2033
- Figure 6: North America Formulation Development Outsourcing Industry Revenue (Million), by Application 2025 & 2033
- Figure 7: North America Formulation Development Outsourcing Industry Revenue Share (%), by Application 2025 & 2033
- Figure 8: North America Formulation Development Outsourcing Industry Revenue (Million), by End User 2025 & 2033
- Figure 9: North America Formulation Development Outsourcing Industry Revenue Share (%), by End User 2025 & 2033
- Figure 10: North America Formulation Development Outsourcing Industry Revenue (Million), by Country 2025 & 2033
- Figure 11: North America Formulation Development Outsourcing Industry Revenue Share (%), by Country 2025 & 2033
- Figure 12: Europe Formulation Development Outsourcing Industry Revenue (Million), by Service 2025 & 2033
- Figure 13: Europe Formulation Development Outsourcing Industry Revenue Share (%), by Service 2025 & 2033
- Figure 14: Europe Formulation Development Outsourcing Industry Revenue (Million), by Dosage Form 2025 & 2033
- Figure 15: Europe Formulation Development Outsourcing Industry Revenue Share (%), by Dosage Form 2025 & 2033
- Figure 16: Europe Formulation Development Outsourcing Industry Revenue (Million), by Application 2025 & 2033
- Figure 17: Europe Formulation Development Outsourcing Industry Revenue Share (%), by Application 2025 & 2033
- Figure 18: Europe Formulation Development Outsourcing Industry Revenue (Million), by End User 2025 & 2033
- Figure 19: Europe Formulation Development Outsourcing Industry Revenue Share (%), by End User 2025 & 2033
- Figure 20: Europe Formulation Development Outsourcing Industry Revenue (Million), by Country 2025 & 2033
- Figure 21: Europe Formulation Development Outsourcing Industry Revenue Share (%), by Country 2025 & 2033
- Figure 22: Asia Pacific Formulation Development Outsourcing Industry Revenue (Million), by Service 2025 & 2033
- Figure 23: Asia Pacific Formulation Development Outsourcing Industry Revenue Share (%), by Service 2025 & 2033
- Figure 24: Asia Pacific Formulation Development Outsourcing Industry Revenue (Million), by Dosage Form 2025 & 2033
- Figure 25: Asia Pacific Formulation Development Outsourcing Industry Revenue Share (%), by Dosage Form 2025 & 2033
- Figure 26: Asia Pacific Formulation Development Outsourcing Industry Revenue (Million), by Application 2025 & 2033
- Figure 27: Asia Pacific Formulation Development Outsourcing Industry Revenue Share (%), by Application 2025 & 2033
- Figure 28: Asia Pacific Formulation Development Outsourcing Industry Revenue (Million), by End User 2025 & 2033
- Figure 29: Asia Pacific Formulation Development Outsourcing Industry Revenue Share (%), by End User 2025 & 2033
- Figure 30: Asia Pacific Formulation Development Outsourcing Industry Revenue (Million), by Country 2025 & 2033
- Figure 31: Asia Pacific Formulation Development Outsourcing Industry Revenue Share (%), by Country 2025 & 2033
- Figure 32: Middle East and Africa Formulation Development Outsourcing Industry Revenue (Million), by Service 2025 & 2033
- Figure 33: Middle East and Africa Formulation Development Outsourcing Industry Revenue Share (%), by Service 2025 & 2033
- Figure 34: Middle East and Africa Formulation Development Outsourcing Industry Revenue (Million), by Dosage Form 2025 & 2033
- Figure 35: Middle East and Africa Formulation Development Outsourcing Industry Revenue Share (%), by Dosage Form 2025 & 2033
- Figure 36: Middle East and Africa Formulation Development Outsourcing Industry Revenue (Million), by Application 2025 & 2033
- Figure 37: Middle East and Africa Formulation Development Outsourcing Industry Revenue Share (%), by Application 2025 & 2033
- Figure 38: Middle East and Africa Formulation Development Outsourcing Industry Revenue (Million), by End User 2025 & 2033
- Figure 39: Middle East and Africa Formulation Development Outsourcing Industry Revenue Share (%), by End User 2025 & 2033
- Figure 40: Middle East and Africa Formulation Development Outsourcing Industry Revenue (Million), by Country 2025 & 2033
- Figure 41: Middle East and Africa Formulation Development Outsourcing Industry Revenue Share (%), by Country 2025 & 2033
- Figure 42: South America Formulation Development Outsourcing Industry Revenue (Million), by Service 2025 & 2033
- Figure 43: South America Formulation Development Outsourcing Industry Revenue Share (%), by Service 2025 & 2033
- Figure 44: South America Formulation Development Outsourcing Industry Revenue (Million), by Dosage Form 2025 & 2033
- Figure 45: South America Formulation Development Outsourcing Industry Revenue Share (%), by Dosage Form 2025 & 2033
- Figure 46: South America Formulation Development Outsourcing Industry Revenue (Million), by Application 2025 & 2033
- Figure 47: South America Formulation Development Outsourcing Industry Revenue Share (%), by Application 2025 & 2033
- Figure 48: South America Formulation Development Outsourcing Industry Revenue (Million), by End User 2025 & 2033
- Figure 49: South America Formulation Development Outsourcing Industry Revenue Share (%), by End User 2025 & 2033
- Figure 50: South America Formulation Development Outsourcing Industry Revenue (Million), by Country 2025 & 2033
- Figure 51: South America Formulation Development Outsourcing Industry Revenue Share (%), by Country 2025 & 2033
List of Tables
- Table 1: Global Formulation Development Outsourcing Industry Revenue Million Forecast, by Service 2020 & 2033
- Table 2: Global Formulation Development Outsourcing Industry Revenue Million Forecast, by Dosage Form 2020 & 2033
- Table 3: Global Formulation Development Outsourcing Industry Revenue Million Forecast, by Application 2020 & 2033
- Table 4: Global Formulation Development Outsourcing Industry Revenue Million Forecast, by End User 2020 & 2033
- Table 5: Global Formulation Development Outsourcing Industry Revenue Million Forecast, by Region 2020 & 2033
- Table 6: Global Formulation Development Outsourcing Industry Revenue Million Forecast, by Service 2020 & 2033
- Table 7: Global Formulation Development Outsourcing Industry Revenue Million Forecast, by Dosage Form 2020 & 2033
- Table 8: Global Formulation Development Outsourcing Industry Revenue Million Forecast, by Application 2020 & 2033
- Table 9: Global Formulation Development Outsourcing Industry Revenue Million Forecast, by End User 2020 & 2033
- Table 10: Global Formulation Development Outsourcing Industry Revenue Million Forecast, by Country 2020 & 2033
- Table 11: United States Formulation Development Outsourcing Industry Revenue (Million) Forecast, by Application 2020 & 2033
- Table 12: Canada Formulation Development Outsourcing Industry Revenue (Million) Forecast, by Application 2020 & 2033
- Table 13: Mexico Formulation Development Outsourcing Industry Revenue (Million) Forecast, by Application 2020 & 2033
- Table 14: Global Formulation Development Outsourcing Industry Revenue Million Forecast, by Service 2020 & 2033
- Table 15: Global Formulation Development Outsourcing Industry Revenue Million Forecast, by Dosage Form 2020 & 2033
- Table 16: Global Formulation Development Outsourcing Industry Revenue Million Forecast, by Application 2020 & 2033
- Table 17: Global Formulation Development Outsourcing Industry Revenue Million Forecast, by End User 2020 & 2033
- Table 18: Global Formulation Development Outsourcing Industry Revenue Million Forecast, by Country 2020 & 2033
- Table 19: Germany Formulation Development Outsourcing Industry Revenue (Million) Forecast, by Application 2020 & 2033
- Table 20: United Kingdom Formulation Development Outsourcing Industry Revenue (Million) Forecast, by Application 2020 & 2033
- Table 21: France Formulation Development Outsourcing Industry Revenue (Million) Forecast, by Application 2020 & 2033
- Table 22: Italy Formulation Development Outsourcing Industry Revenue (Million) Forecast, by Application 2020 & 2033
- Table 23: Spain Formulation Development Outsourcing Industry Revenue (Million) Forecast, by Application 2020 & 2033
- Table 24: Rest of Europe Formulation Development Outsourcing Industry Revenue (Million) Forecast, by Application 2020 & 2033
- Table 25: Global Formulation Development Outsourcing Industry Revenue Million Forecast, by Service 2020 & 2033
- Table 26: Global Formulation Development Outsourcing Industry Revenue Million Forecast, by Dosage Form 2020 & 2033
- Table 27: Global Formulation Development Outsourcing Industry Revenue Million Forecast, by Application 2020 & 2033
- Table 28: Global Formulation Development Outsourcing Industry Revenue Million Forecast, by End User 2020 & 2033
- Table 29: Global Formulation Development Outsourcing Industry Revenue Million Forecast, by Country 2020 & 2033
- Table 30: China Formulation Development Outsourcing Industry Revenue (Million) Forecast, by Application 2020 & 2033
- Table 31: Japan Formulation Development Outsourcing Industry Revenue (Million) Forecast, by Application 2020 & 2033
- Table 32: India Formulation Development Outsourcing Industry Revenue (Million) Forecast, by Application 2020 & 2033
- Table 33: Australia Formulation Development Outsourcing Industry Revenue (Million) Forecast, by Application 2020 & 2033
- Table 34: South Korea Formulation Development Outsourcing Industry Revenue (Million) Forecast, by Application 2020 & 2033
- Table 35: Rest of Asia Pacific Formulation Development Outsourcing Industry Revenue (Million) Forecast, by Application 2020 & 2033
- Table 36: Global Formulation Development Outsourcing Industry Revenue Million Forecast, by Service 2020 & 2033
- Table 37: Global Formulation Development Outsourcing Industry Revenue Million Forecast, by Dosage Form 2020 & 2033
- Table 38: Global Formulation Development Outsourcing Industry Revenue Million Forecast, by Application 2020 & 2033
- Table 39: Global Formulation Development Outsourcing Industry Revenue Million Forecast, by End User 2020 & 2033
- Table 40: Global Formulation Development Outsourcing Industry Revenue Million Forecast, by Country 2020 & 2033
- Table 41: GCC Formulation Development Outsourcing Industry Revenue (Million) Forecast, by Application 2020 & 2033
- Table 42: South Africa Formulation Development Outsourcing Industry Revenue (Million) Forecast, by Application 2020 & 2033
- Table 43: Rest of Middle East and Africa Formulation Development Outsourcing Industry Revenue (Million) Forecast, by Application 2020 & 2033
- Table 44: Global Formulation Development Outsourcing Industry Revenue Million Forecast, by Service 2020 & 2033
- Table 45: Global Formulation Development Outsourcing Industry Revenue Million Forecast, by Dosage Form 2020 & 2033
- Table 46: Global Formulation Development Outsourcing Industry Revenue Million Forecast, by Application 2020 & 2033
- Table 47: Global Formulation Development Outsourcing Industry Revenue Million Forecast, by End User 2020 & 2033
- Table 48: Global Formulation Development Outsourcing Industry Revenue Million Forecast, by Country 2020 & 2033
- Table 49: Brazil Formulation Development Outsourcing Industry Revenue (Million) Forecast, by Application 2020 & 2033
- Table 50: Argentina Formulation Development Outsourcing Industry Revenue (Million) Forecast, by Application 2020 & 2033
- Table 51: Rest of South America Formulation Development Outsourcing Industry Revenue (Million) Forecast, by Application 2020 & 2033
Frequently Asked Questions
1. What is the projected Compound Annual Growth Rate (CAGR) of the Formulation Development Outsourcing Industry?
The projected CAGR is approximately 6.16%.
2. Which companies are prominent players in the Formulation Development Outsourcing Industry?
Key companies in the market include Charles River Laboratories, Intertek Group PLC, Laboratory Corporation of America Holdings, Patheon (Thermo Fisher Scientific Inc ), Dr Reddy's Laboratories Ltd, Irisys LLC, Aizant Drug Research Solutions Private Limited, Syngene International Ltd, Lonza Group AG, Piramal Pharma Solutions, Qiotient Sciences, Catalent Inc, Emergent BioSolutions Inc.
3. What are the main segments of the Formulation Development Outsourcing Industry?
The market segments include Service, Dosage Form, Application, End User.
4. Can you provide details about the market size?
The market size is estimated to be USD 26.56 Million as of 2022.
5. What are some drivers contributing to market growth?
Increasing Trend of Patent Protection Expiration of Major Drugs; Rising Number of Pharmaceutical and Biopharmaceutical Companies Outsourcing Their Services.
6. What are the notable trends driving market growth?
The Oncology Segment is Expected to Witness Significant Growth over the Forecast Period.
7. Are there any restraints impacting market growth?
Structural Changes in the Pharmaceutical Industry; Insufficient Funding to Perform the Drug Development Process Through Formulation Development.
8. Can you provide examples of recent developments in the market?
N/A
9. What pricing options are available for accessing the report?
Pricing options include single-user, multi-user, and enterprise licenses priced at USD 4750, USD 5250, and USD 8750 respectively.
10. Is the market size provided in terms of value or volume?
The market size is provided in terms of value, measured in Million.
11. Are there any specific market keywords associated with the report?
Yes, the market keyword associated with the report is "Formulation Development Outsourcing Industry," which aids in identifying and referencing the specific market segment covered.
12. How do I determine which pricing option suits my needs best?
The pricing options vary based on user requirements and access needs. Individual users may opt for single-user licenses, while businesses requiring broader access may choose multi-user or enterprise licenses for cost-effective access to the report.
13. Are there any additional resources or data provided in the Formulation Development Outsourcing Industry report?
While the report offers comprehensive insights, it's advisable to review the specific contents or supplementary materials provided to ascertain if additional resources or data are available.
14. How can I stay updated on further developments or reports in the Formulation Development Outsourcing Industry?
To stay informed about further developments, trends, and reports in the Formulation Development Outsourcing Industry, consider subscribing to industry newsletters, following relevant companies and organizations, or regularly checking reputable industry news sources and publications.
Methodology
Step 1 - Identification of Relevant Samples Size from Population Database


Step 2 - Approaches for Defining Global Market Size (Value, Volume* & Price*)

Note*: In applicable scenarios
Step 3 - Data Sources
Primary Research
- Web Analytics
- Survey Reports
- Research Institute
- Latest Research Reports
- Opinion Leaders
Secondary Research
- Annual Reports
- White Paper
- Latest Press Release
- Industry Association
- Paid Database
- Investor Presentations

Step 4 - Data Triangulation
Involves using different sources of information in order to increase the validity of a study
These sources are likely to be stakeholders in a program - participants, other researchers, program staff, other community members, and so on.
Then we put all data in single framework & apply various statistical tools to find out the dynamic on the market.
During the analysis stage, feedback from the stakeholder groups would be compared to determine areas of agreement as well as areas of divergence