

Key Insights
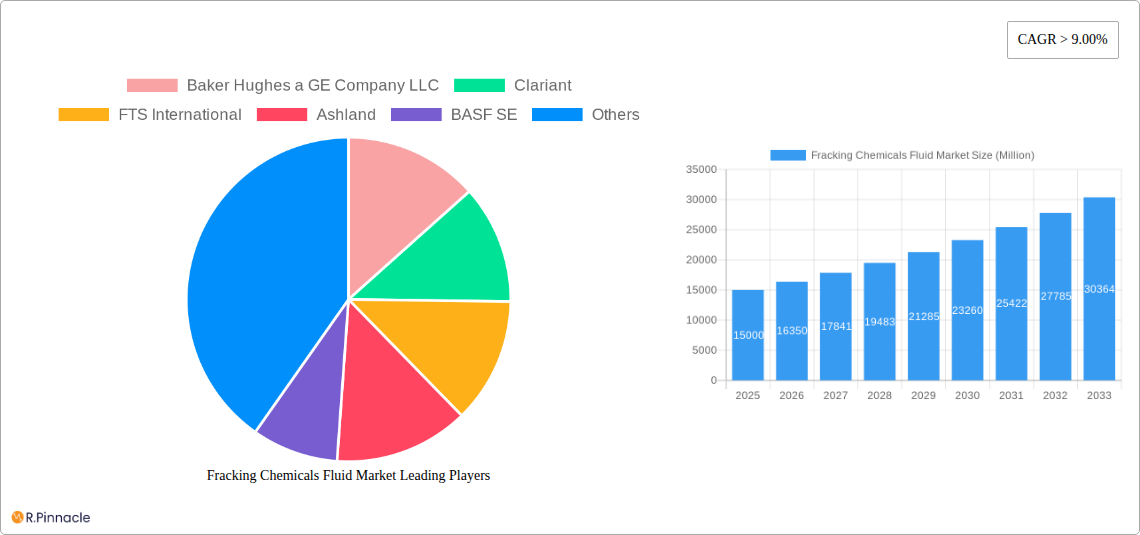
The global fracking chemicals fluid market is experiencing robust growth, driven by the increasing demand for oil and gas extraction, particularly from unconventional shale formations. The market's Compound Annual Growth Rate (CAGR) exceeding 9.00% from 2019 to 2024 indicates a significant upward trajectory. This expansion is fueled by several key factors: the continued adoption of hydraulic fracturing techniques in horizontal wells, especially in regions like North America and Asia-Pacific; the development of more efficient and environmentally friendly fluid formulations; and the growing investment in exploration and production activities across the globe. The market is segmented by fluid type (water-based, foam-based, oil-based, etc.), product type (linear gels, cross-linked fluids, etc.), function (surfactants, corrosion inhibitors, etc.), and application (oil & gas, mining). The water-based segment currently holds a significant market share due to its cost-effectiveness and relative environmental friendliness compared to oil-based alternatives. However, the synthetic-based segment is witnessing faster growth due to its enhanced performance characteristics and reduced environmental impact. Major players like Baker Hughes, Clariant, Halliburton, and Schlumberger are actively involved in developing innovative solutions and expanding their market presence through strategic partnerships and acquisitions.
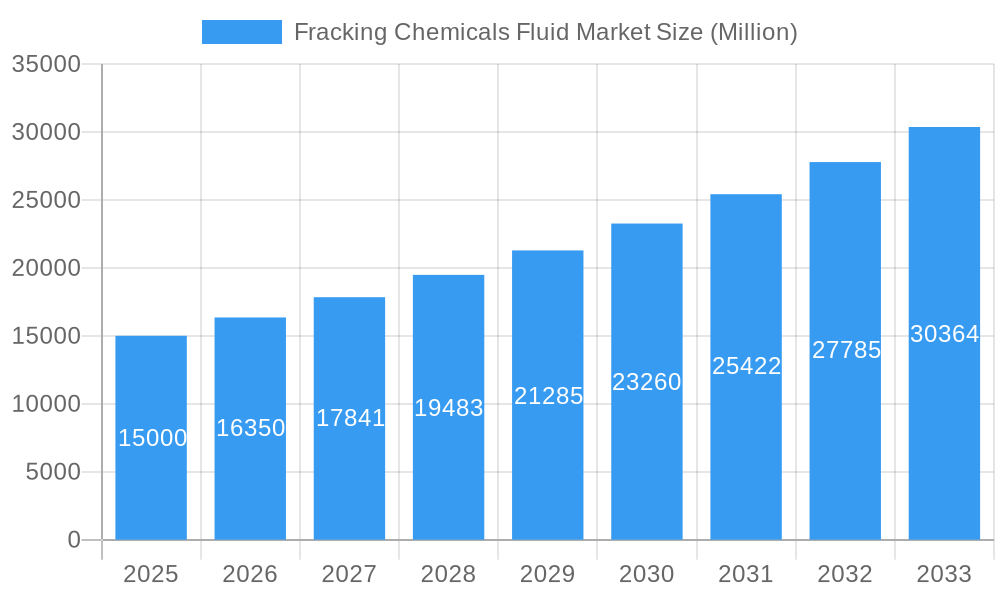
Fracking Chemicals Fluid Market Market Size (In Billion)
The growth of the fracking chemicals fluid market is also influenced by various trends such as increasing regulations concerning environmental protection, the ongoing development of advanced fluid technologies focusing on improved efficiency and reduced environmental footprint, and the exploration of new unconventional energy resources. Despite these positive factors, challenges such as price volatility of raw materials, fluctuating oil and gas prices, and stringent environmental regulations pose potential restraints on market growth. The Asia-Pacific region is expected to exhibit substantial growth, driven by increasing energy demand and exploration activities in countries like China and India. North America continues to be a dominant market, largely due to the established shale gas production activities in the US and Canada. Future market growth will depend on the global energy landscape, technological advancements in fluid chemistry, and the regulatory environment governing hydraulic fracturing operations. The forecast period of 2025-2033 projects continued expansion, albeit potentially at a slightly moderated pace compared to the historical period, reflecting the impact of market stabilization and maturity.
Fracking Chemicals Fluid Market Company Market Share
Fracking Chemicals Fluid Market: A Comprehensive Report (2019-2033)
This in-depth report provides a comprehensive analysis of the Fracking Chemicals Fluid market, offering actionable insights for industry professionals. The study covers the period from 2019 to 2033, with 2025 as the base year and a forecast period from 2025 to 2033. The report meticulously examines market dynamics, competitive landscapes, and future growth potential, empowering stakeholders to make informed strategic decisions. Key segments analyzed include Fluid Type (Water Based, Foam Based, Gelled Oil-Based, Slick Water-Based, Synthetic Based, Others), Product Type (Conventional Linear Gels, Borate Cross-Linked Fluids, Organometallic Cross-Linked Fluids, Aluminium Phosphate Ester Oil Gels), Function (Surfactant, Scale Inhibitor, Friction Reducer, Corrosion Inhibitor, Biocide, Crosslinker, Gelling Agent, Others), and Application (Oil and Gas, Horizontal Well, Mining, Others). Leading players like Baker Hughes a GE Company LLC, Clariant, FTS International, Ashland, BASF SE, Weatherford, DuPont, Dow, SNP Inc, Halliburton, Schlumberger Limited, Chevron Phillips Chemical Company, Albemarle Corporation, and Calfrac Well Services Ltd are profiled in detail.
Fracking Chemicals Fluid Market Market Structure & Innovation Trends
The Fracking Chemicals Fluid market exhibits a moderately concentrated structure, with a few major players holding significant market share. The market share of the top five companies is estimated at xx% in 2025. Innovation is driven by the need for environmentally friendly and cost-effective solutions, leading to the development of advanced fluid chemistries. Stringent regulatory frameworks concerning environmental impact and worker safety significantly influence market dynamics. The emergence of biodegradable and less-toxic alternatives is a prominent trend. Mergers and acquisitions (M&A) play a vital role in shaping the market landscape. Recent M&A activities in the sector include [insert specific examples of M&A deals with values if available, otherwise state “xx Million” for deal values]. The average deal value in the past five years is estimated at xx Million. Product substitutes, particularly in specific niche applications, pose a challenge to established players. End-user demographics are heavily influenced by the geographical distribution of oil and gas extraction activities, and this analysis highlights the regional variations in demand patterns.
Fracking Chemicals Fluid Market Market Dynamics & Trends
The global Fracking Chemicals Fluid market is projected to experience a CAGR of xx% during the forecast period (2025-2033), driven primarily by the increasing demand for oil and gas extraction, particularly in shale formations. Technological advancements, including the development of more efficient and environmentally friendly fracturing fluids, contribute to market growth. Consumer preferences are increasingly shifting towards eco-friendly solutions, pushing manufacturers to innovate and develop sustainable alternatives. The competitive landscape is highly dynamic, marked by intense competition among established players and emerging companies. Market penetration rates vary significantly across regions, with [mention a specific region with high penetration, if available]. Challenges such as fluctuating oil prices and environmental regulations significantly influence market dynamics.
Dominant Regions & Segments in Fracking Chemicals Fluid Market
Dominant Region: North America (particularly the United States) currently dominates the Fracking Chemicals Fluid market due to extensive shale gas exploration and production. This dominance is attributed to robust economic policies supporting energy exploration and well-developed infrastructure.
Dominant Fluid Type: Water-based fluids hold the largest market share due to their cost-effectiveness and relatively lower environmental impact compared to oil-based fluids. However, the segment for slick water-based fluids is also exhibiting strong growth due to increased efficiency.
Dominant Product Type: Conventional linear gels dominate the market owing to their established use and relatively lower cost. However, demand for Borate Cross-Linked Fluids and Organometallic Cross-Linked Fluids are increasing due to superior performance characteristics.
Dominant Function: Surfactants are the most widely used function in fracking fluids, contributing to better fluid rheology and efficient stimulation.
Dominant Application: The oil and gas sector forms the primary application area, with horizontal wells showing especially high demand.
Fracking Chemicals Fluid Market Product Innovations
Recent innovations in the Fracking Chemicals Fluid market focus on developing environmentally benign, high-performance fluids. This includes the development of biodegradable polymers, improved rheological additives, and advanced fluid management techniques. These innovations aim to enhance well productivity, reduce environmental impact, and optimize operational costs. The market is witnessing a shift towards customized fluid solutions designed to address specific geological conditions and wellbore complexities. The focus on efficiency and improved recovery rates remains a key driver of product development.
Report Scope & Segmentation Analysis
This report comprehensively segments the Fracking Chemicals Fluid market based on Fluid Type, Product Type, Function, and Application. Each segment is analyzed in detail, providing market size, growth projections, and competitive dynamics. Growth projections vary across segments, with some segments experiencing faster growth than others. For example, the synthetic-based fluid type segment is predicted to have a higher growth rate than the traditional water-based segment due to its superior performance properties. Competitive intensity also differs across segments; some niches may exhibit higher levels of competition than others. The report provides a granular analysis of the market to provide a detailed understanding of segment performance.
Key Drivers of Fracking Chemicals Fluid Market Growth
Several factors propel the growth of the Fracking Chemicals Fluid market. Firstly, the growing global demand for energy, especially natural gas, fuels the need for efficient shale gas extraction methods. Secondly, technological advancements in hydraulic fracturing techniques and the development of improved fluids enhance production efficiency. Thirdly, supportive government policies in key regions encourage exploration and production, stimulating demand for fracturing fluids.
Challenges in the Fracking Chemicals Fluid Market Sector
The Fracking Chemicals Fluid market faces several significant challenges. Stringent environmental regulations and concerns about water contamination impose constraints on operations. Fluctuations in crude oil prices directly impact the overall demand for natural gas and hence fracking fluids. Furthermore, the intensifying competition among industry players necessitates cost optimization and continuous innovation.
Emerging Opportunities in Fracking Chemicals Fluid Market
The Fracking Chemicals Fluid market presents various opportunities. The growing exploration and production activities in unconventional oil and gas reserves in emerging economies offer significant expansion potential. The development and adoption of sustainable and biodegradable fluids represent a key growth opportunity. Furthermore, the increasing demand for efficient fluid management and improved well stimulation technologies creates space for specialized products and services.
Leading Players in the Fracking Chemicals Fluid Market Market
- Baker Hughes a GE Company LLC
- Clariant
- FTS International
- Ashland
- BASF SE
- Weatherford
- DuPont
- Dow
- SNP Inc
- Halliburton
- Schlumberger Limited
- Chevron Phillips Chemical Company
- Albemarle Corporation
- Calfrac Well Services Ltd
Key Developments in Fracking Chemicals Fluid Market Industry
- 2022-Q4: [Insert example of a key development, e.g., "Company X launched a new environmentally friendly fracking fluid."]
- 2023-Q1: [Insert example of a key development]
- 2023-Q3: [Insert example of a key development]
Future Outlook for Fracking Chemicals Fluid Market Market
The Fracking Chemicals Fluid market is poised for sustained growth, driven by the continued expansion of shale gas production and the ongoing technological advancements in hydraulic fracturing. The increasing demand for efficient and sustainable solutions will create new opportunities for innovative products and services. Strategic partnerships and collaborations will be crucial for companies to gain a competitive edge in this evolving market.
Fracking Chemicals Fluid Market Segmentation
-
1. Fluid Type
- 1.1. Water Based
- 1.2. Foam Based
- 1.3. Gelled Oil-Based
- 1.4. Slick Water-Based
- 1.5. Synthetic Based
- 1.6. Others
-
2. Product Type
- 2.1. Conventional Linear Gels
- 2.2. Borate Cross-Linked Fluids
- 2.3. Organometallic Cross-Linked Fluids
- 2.4. Aluminium Phosphate Ester Oil Gels
-
3. Function
- 3.1. Surfactant
- 3.2. Scale Inhibitor
- 3.3. Friction Reducer
- 3.4. Corrosion Inhibitor
- 3.5. Biocide
- 3.6. Crosslinker
- 3.7. Gelling Agent
- 3.8. Others
-
4. Application
-
4.1. Oil and Gas
- 4.1.1. Oil Well
- 4.1.2. Shale Gas Well
- 4.1.3. Horizontal Well
- 4.2. Mining
- 4.3. Others
-
4.1. Oil and Gas
Fracking Chemicals Fluid Market Segmentation By Geography
-
1. Asia Pacific
- 1.1. China
- 1.2. India
- 1.3. Japan
- 1.4. South Korea
- 1.5. Rest of Asia Pacific
-
2. North America
- 2.1. United States
- 2.2. Canada
- 2.3. Mexico
-
3. Europe
- 3.1. Germany
- 3.2. United Kingdom
- 3.3. France
- 3.4. Italy
- 3.5. Rest of Europe
-
4. South America
- 4.1. Brazil
- 4.2. Argentina
- 4.3. Rest of South America
-
5. Middle East and Africa
- 5.1. Saudi Arabia
- 5.2. South Africa
- 5.3. Rest of Middle East and Africa
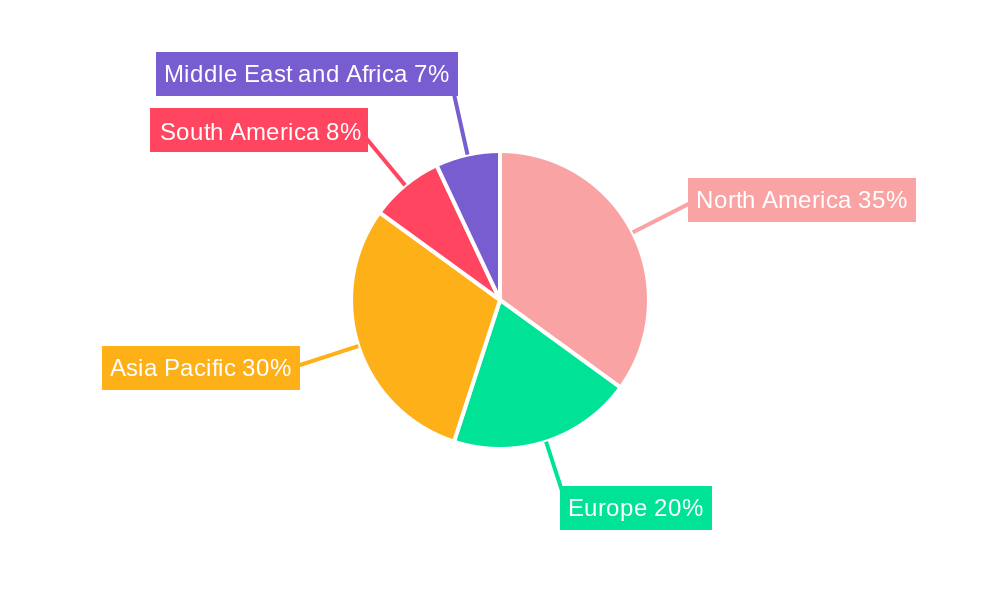
Fracking Chemicals Fluid Market Regional Market Share
Geographic Coverage of Fracking Chemicals Fluid Market
Fracking Chemicals Fluid Market REPORT HIGHLIGHTS
| Aspects | Details |
|---|---|
| Study Period | 2020-2034 |
| Base Year | 2025 |
| Estimated Year | 2026 |
| Forecast Period | 2026-2034 |
| Historical Period | 2020-2025 |
| Growth Rate | CAGR of 7.2% from 2020-2034 |
| Segmentation |
|
Table of Contents
- 1. Introduction
- 1.1. Research Scope
- 1.2. Market Segmentation
- 1.3. Research Objective
- 1.4. Definitions and Assumptions
- 2. Executive Summary
- 2.1. Market Snapshot
- 3. Market Dynamics
- 3.1. Market Drivers
- 3.2. Market Restrains
- 3.3. Market Trends
- 3.4. Market Opportunities
- 4. Market Factor Analysis
- 4.1. Porters Five Forces
- 4.1.1. Bargaining Power of Suppliers
- 4.1.2. Bargaining Power of Buyers
- 4.1.3. Threat of New Entrants
- 4.1.4. Threat of Substitutes
- 4.1.5. Competitive Rivalry
- 4.2. PESTEL analysis
- 4.3. BCG Analysis
- 4.3.1. Stars (High Growth, High Market Share)
- 4.3.2. Cash Cows (Low Growth, High Market Share)
- 4.3.3. Question Mark (High Growth, Low Market Share)
- 4.3.4. Dogs (Low Growth, Low Market Share)
- 4.4. Ansoff Matrix Analysis
- 4.5. Supply Chain Analysis
- 4.6. Regulatory Landscape
- 4.7. Current Market Potential and Opportunity Assessment (TAM–SAM–SOM Framework)
- 4.8. PRI Analyst Note
- 4.1. Porters Five Forces
- 5. Market Analysis, Insights and Forecast 2021-2033
- 5.1. Market Analysis, Insights and Forecast - by Fluid Type
- 5.1.1. Water Based
- 5.1.2. Foam Based
- 5.1.3. Gelled Oil-Based
- 5.1.4. Slick Water-Based
- 5.1.5. Synthetic Based
- 5.1.6. Others
- 5.2. Market Analysis, Insights and Forecast - by Product Type
- 5.2.1. Conventional Linear Gels
- 5.2.2. Borate Cross-Linked Fluids
- 5.2.3. Organometallic Cross-Linked Fluids
- 5.2.4. Aluminium Phosphate Ester Oil Gels
- 5.3. Market Analysis, Insights and Forecast - by Function
- 5.3.1. Surfactant
- 5.3.2. Scale Inhibitor
- 5.3.3. Friction Reducer
- 5.3.4. Corrosion Inhibitor
- 5.3.5. Biocide
- 5.3.6. Crosslinker
- 5.3.7. Gelling Agent
- 5.3.8. Others
- 5.4. Market Analysis, Insights and Forecast - by Application
- 5.4.1. Oil and Gas
- 5.4.1.1. Oil Well
- 5.4.1.2. Shale Gas Well
- 5.4.1.3. Horizontal Well
- 5.4.2. Mining
- 5.4.3. Others
- 5.4.1. Oil and Gas
- 5.5. Market Analysis, Insights and Forecast - by Region
- 5.5.1. Asia Pacific
- 5.5.2. North America
- 5.5.3. Europe
- 5.5.4. South America
- 5.5.5. Middle East and Africa
- 5.1. Market Analysis, Insights and Forecast - by Fluid Type
- 6. Global Fracking Chemicals Fluid Market Analysis, Insights and Forecast, 2021-2033
- 6.1. Market Analysis, Insights and Forecast - by Fluid Type
- 6.1.1. Water Based
- 6.1.2. Foam Based
- 6.1.3. Gelled Oil-Based
- 6.1.4. Slick Water-Based
- 6.1.5. Synthetic Based
- 6.1.6. Others
- 6.2. Market Analysis, Insights and Forecast - by Product Type
- 6.2.1. Conventional Linear Gels
- 6.2.2. Borate Cross-Linked Fluids
- 6.2.3. Organometallic Cross-Linked Fluids
- 6.2.4. Aluminium Phosphate Ester Oil Gels
- 6.3. Market Analysis, Insights and Forecast - by Function
- 6.3.1. Surfactant
- 6.3.2. Scale Inhibitor
- 6.3.3. Friction Reducer
- 6.3.4. Corrosion Inhibitor
- 6.3.5. Biocide
- 6.3.6. Crosslinker
- 6.3.7. Gelling Agent
- 6.3.8. Others
- 6.4. Market Analysis, Insights and Forecast - by Application
- 6.4.1. Oil and Gas
- 6.4.1.1. Oil Well
- 6.4.1.2. Shale Gas Well
- 6.4.1.3. Horizontal Well
- 6.4.2. Mining
- 6.4.3. Others
- 6.4.1. Oil and Gas
- 6.1. Market Analysis, Insights and Forecast - by Fluid Type
- 7. Asia Pacific Fracking Chemicals Fluid Market Analysis, Insights and Forecast, 2020-2032
- 7.1. Market Analysis, Insights and Forecast - by Fluid Type
- 7.1.1. Water Based
- 7.1.2. Foam Based
- 7.1.3. Gelled Oil-Based
- 7.1.4. Slick Water-Based
- 7.1.5. Synthetic Based
- 7.1.6. Others
- 7.2. Market Analysis, Insights and Forecast - by Product Type
- 7.2.1. Conventional Linear Gels
- 7.2.2. Borate Cross-Linked Fluids
- 7.2.3. Organometallic Cross-Linked Fluids
- 7.2.4. Aluminium Phosphate Ester Oil Gels
- 7.3. Market Analysis, Insights and Forecast - by Function
- 7.3.1. Surfactant
- 7.3.2. Scale Inhibitor
- 7.3.3. Friction Reducer
- 7.3.4. Corrosion Inhibitor
- 7.3.5. Biocide
- 7.3.6. Crosslinker
- 7.3.7. Gelling Agent
- 7.3.8. Others
- 7.4. Market Analysis, Insights and Forecast - by Application
- 7.4.1. Oil and Gas
- 7.4.1.1. Oil Well
- 7.4.1.2. Shale Gas Well
- 7.4.1.3. Horizontal Well
- 7.4.2. Mining
- 7.4.3. Others
- 7.4.1. Oil and Gas
- 7.1. Market Analysis, Insights and Forecast - by Fluid Type
- 8. North America Fracking Chemicals Fluid Market Analysis, Insights and Forecast, 2020-2032
- 8.1. Market Analysis, Insights and Forecast - by Fluid Type
- 8.1.1. Water Based
- 8.1.2. Foam Based
- 8.1.3. Gelled Oil-Based
- 8.1.4. Slick Water-Based
- 8.1.5. Synthetic Based
- 8.1.6. Others
- 8.2. Market Analysis, Insights and Forecast - by Product Type
- 8.2.1. Conventional Linear Gels
- 8.2.2. Borate Cross-Linked Fluids
- 8.2.3. Organometallic Cross-Linked Fluids
- 8.2.4. Aluminium Phosphate Ester Oil Gels
- 8.3. Market Analysis, Insights and Forecast - by Function
- 8.3.1. Surfactant
- 8.3.2. Scale Inhibitor
- 8.3.3. Friction Reducer
- 8.3.4. Corrosion Inhibitor
- 8.3.5. Biocide
- 8.3.6. Crosslinker
- 8.3.7. Gelling Agent
- 8.3.8. Others
- 8.4. Market Analysis, Insights and Forecast - by Application
- 8.4.1. Oil and Gas
- 8.4.1.1. Oil Well
- 8.4.1.2. Shale Gas Well
- 8.4.1.3. Horizontal Well
- 8.4.2. Mining
- 8.4.3. Others
- 8.4.1. Oil and Gas
- 8.1. Market Analysis, Insights and Forecast - by Fluid Type
- 9. Europe Fracking Chemicals Fluid Market Analysis, Insights and Forecast, 2020-2032
- 9.1. Market Analysis, Insights and Forecast - by Fluid Type
- 9.1.1. Water Based
- 9.1.2. Foam Based
- 9.1.3. Gelled Oil-Based
- 9.1.4. Slick Water-Based
- 9.1.5. Synthetic Based
- 9.1.6. Others
- 9.2. Market Analysis, Insights and Forecast - by Product Type
- 9.2.1. Conventional Linear Gels
- 9.2.2. Borate Cross-Linked Fluids
- 9.2.3. Organometallic Cross-Linked Fluids
- 9.2.4. Aluminium Phosphate Ester Oil Gels
- 9.3. Market Analysis, Insights and Forecast - by Function
- 9.3.1. Surfactant
- 9.3.2. Scale Inhibitor
- 9.3.3. Friction Reducer
- 9.3.4. Corrosion Inhibitor
- 9.3.5. Biocide
- 9.3.6. Crosslinker
- 9.3.7. Gelling Agent
- 9.3.8. Others
- 9.4. Market Analysis, Insights and Forecast - by Application
- 9.4.1. Oil and Gas
- 9.4.1.1. Oil Well
- 9.4.1.2. Shale Gas Well
- 9.4.1.3. Horizontal Well
- 9.4.2. Mining
- 9.4.3. Others
- 9.4.1. Oil and Gas
- 9.1. Market Analysis, Insights and Forecast - by Fluid Type
- 10. South America Fracking Chemicals Fluid Market Analysis, Insights and Forecast, 2020-2032
- 10.1. Market Analysis, Insights and Forecast - by Fluid Type
- 10.1.1. Water Based
- 10.1.2. Foam Based
- 10.1.3. Gelled Oil-Based
- 10.1.4. Slick Water-Based
- 10.1.5. Synthetic Based
- 10.1.6. Others
- 10.2. Market Analysis, Insights and Forecast - by Product Type
- 10.2.1. Conventional Linear Gels
- 10.2.2. Borate Cross-Linked Fluids
- 10.2.3. Organometallic Cross-Linked Fluids
- 10.2.4. Aluminium Phosphate Ester Oil Gels
- 10.3. Market Analysis, Insights and Forecast - by Function
- 10.3.1. Surfactant
- 10.3.2. Scale Inhibitor
- 10.3.3. Friction Reducer
- 10.3.4. Corrosion Inhibitor
- 10.3.5. Biocide
- 10.3.6. Crosslinker
- 10.3.7. Gelling Agent
- 10.3.8. Others
- 10.4. Market Analysis, Insights and Forecast - by Application
- 10.4.1. Oil and Gas
- 10.4.1.1. Oil Well
- 10.4.1.2. Shale Gas Well
- 10.4.1.3. Horizontal Well
- 10.4.2. Mining
- 10.4.3. Others
- 10.4.1. Oil and Gas
- 10.1. Market Analysis, Insights and Forecast - by Fluid Type
- 11. Middle East and Africa Fracking Chemicals Fluid Market Analysis, Insights and Forecast, 2020-2032
- 11.1. Market Analysis, Insights and Forecast - by Fluid Type
- 11.1.1. Water Based
- 11.1.2. Foam Based
- 11.1.3. Gelled Oil-Based
- 11.1.4. Slick Water-Based
- 11.1.5. Synthetic Based
- 11.1.6. Others
- 11.2. Market Analysis, Insights and Forecast - by Product Type
- 11.2.1. Conventional Linear Gels
- 11.2.2. Borate Cross-Linked Fluids
- 11.2.3. Organometallic Cross-Linked Fluids
- 11.2.4. Aluminium Phosphate Ester Oil Gels
- 11.3. Market Analysis, Insights and Forecast - by Function
- 11.3.1. Surfactant
- 11.3.2. Scale Inhibitor
- 11.3.3. Friction Reducer
- 11.3.4. Corrosion Inhibitor
- 11.3.5. Biocide
- 11.3.6. Crosslinker
- 11.3.7. Gelling Agent
- 11.3.8. Others
- 11.4. Market Analysis, Insights and Forecast - by Application
- 11.4.1. Oil and Gas
- 11.4.1.1. Oil Well
- 11.4.1.2. Shale Gas Well
- 11.4.1.3. Horizontal Well
- 11.4.2. Mining
- 11.4.3. Others
- 11.4.1. Oil and Gas
- 11.1. Market Analysis, Insights and Forecast - by Fluid Type
- 12. Competitive Analysis
- 12.1. Company Profiles
- 12.1.1 Baker Hughes a GE Company LLC
- 12.1.1.1. Company Overview
- 12.1.1.2. Products
- 12.1.1.3. Company Financials
- 12.1.1.4. SWOT Analysis
- 12.1.2 Clariant
- 12.1.2.1. Company Overview
- 12.1.2.2. Products
- 12.1.2.3. Company Financials
- 12.1.2.4. SWOT Analysis
- 12.1.3 FTS International
- 12.1.3.1. Company Overview
- 12.1.3.2. Products
- 12.1.3.3. Company Financials
- 12.1.3.4. SWOT Analysis
- 12.1.4 Ashland
- 12.1.4.1. Company Overview
- 12.1.4.2. Products
- 12.1.4.3. Company Financials
- 12.1.4.4. SWOT Analysis
- 12.1.5 BASF SE
- 12.1.5.1. Company Overview
- 12.1.5.2. Products
- 12.1.5.3. Company Financials
- 12.1.5.4. SWOT Analysis
- 12.1.6 Weatherford
- 12.1.6.1. Company Overview
- 12.1.6.2. Products
- 12.1.6.3. Company Financials
- 12.1.6.4. SWOT Analysis
- 12.1.7 DuPont
- 12.1.7.1. Company Overview
- 12.1.7.2. Products
- 12.1.7.3. Company Financials
- 12.1.7.4. SWOT Analysis
- 12.1.8 Dow
- 12.1.8.1. Company Overview
- 12.1.8.2. Products
- 12.1.8.3. Company Financials
- 12.1.8.4. SWOT Analysis
- 12.1.9 SNP Inc
- 12.1.9.1. Company Overview
- 12.1.9.2. Products
- 12.1.9.3. Company Financials
- 12.1.9.4. SWOT Analysis
- 12.1.10 Halliburton
- 12.1.10.1. Company Overview
- 12.1.10.2. Products
- 12.1.10.3. Company Financials
- 12.1.10.4. SWOT Analysis
- 12.1.11 Schlumberger Limited
- 12.1.11.1. Company Overview
- 12.1.11.2. Products
- 12.1.11.3. Company Financials
- 12.1.11.4. SWOT Analysis
- 12.1.12 Chevron PhillipsChemicalCompay*List Not Exhaustive
- 12.1.12.1. Company Overview
- 12.1.12.2. Products
- 12.1.12.3. Company Financials
- 12.1.12.4. SWOT Analysis
- 12.1.13 Albemarle Corporation
- 12.1.13.1. Company Overview
- 12.1.13.2. Products
- 12.1.13.3. Company Financials
- 12.1.13.4. SWOT Analysis
- 12.1.14 Calfrac Well Services Ltd
- 12.1.14.1. Company Overview
- 12.1.14.2. Products
- 12.1.14.3. Company Financials
- 12.1.14.4. SWOT Analysis
- 12.1.1 Baker Hughes a GE Company LLC
- 12.2. Market Entropy
- 12.2.1 Company's Key Areas Served
- 12.2.2 Recent Developments
- 12.3. Company Market Share Analysis 2025
- 12.3.1 Top 5 Companies Market Share Analysis
- 12.3.2 Top 3 Companies Market Share Analysis
- 12.4. List of Potential Customers
- 13. Research Methodology
List of Figures
- Figure 1: Global Fracking Chemicals Fluid Market Revenue Breakdown (billion, %) by Region 2025 & 2033
- Figure 2: Asia Pacific Fracking Chemicals Fluid Market Revenue (billion), by Fluid Type 2025 & 2033
- Figure 3: Asia Pacific Fracking Chemicals Fluid Market Revenue Share (%), by Fluid Type 2025 & 2033
- Figure 4: Asia Pacific Fracking Chemicals Fluid Market Revenue (billion), by Product Type 2025 & 2033
- Figure 5: Asia Pacific Fracking Chemicals Fluid Market Revenue Share (%), by Product Type 2025 & 2033
- Figure 6: Asia Pacific Fracking Chemicals Fluid Market Revenue (billion), by Function 2025 & 2033
- Figure 7: Asia Pacific Fracking Chemicals Fluid Market Revenue Share (%), by Function 2025 & 2033
- Figure 8: Asia Pacific Fracking Chemicals Fluid Market Revenue (billion), by Application 2025 & 2033
- Figure 9: Asia Pacific Fracking Chemicals Fluid Market Revenue Share (%), by Application 2025 & 2033
- Figure 10: Asia Pacific Fracking Chemicals Fluid Market Revenue (billion), by Country 2025 & 2033
- Figure 11: Asia Pacific Fracking Chemicals Fluid Market Revenue Share (%), by Country 2025 & 2033
- Figure 12: North America Fracking Chemicals Fluid Market Revenue (billion), by Fluid Type 2025 & 2033
- Figure 13: North America Fracking Chemicals Fluid Market Revenue Share (%), by Fluid Type 2025 & 2033
- Figure 14: North America Fracking Chemicals Fluid Market Revenue (billion), by Product Type 2025 & 2033
- Figure 15: North America Fracking Chemicals Fluid Market Revenue Share (%), by Product Type 2025 & 2033
- Figure 16: North America Fracking Chemicals Fluid Market Revenue (billion), by Function 2025 & 2033
- Figure 17: North America Fracking Chemicals Fluid Market Revenue Share (%), by Function 2025 & 2033
- Figure 18: North America Fracking Chemicals Fluid Market Revenue (billion), by Application 2025 & 2033
- Figure 19: North America Fracking Chemicals Fluid Market Revenue Share (%), by Application 2025 & 2033
- Figure 20: North America Fracking Chemicals Fluid Market Revenue (billion), by Country 2025 & 2033
- Figure 21: North America Fracking Chemicals Fluid Market Revenue Share (%), by Country 2025 & 2033
- Figure 22: Europe Fracking Chemicals Fluid Market Revenue (billion), by Fluid Type 2025 & 2033
- Figure 23: Europe Fracking Chemicals Fluid Market Revenue Share (%), by Fluid Type 2025 & 2033
- Figure 24: Europe Fracking Chemicals Fluid Market Revenue (billion), by Product Type 2025 & 2033
- Figure 25: Europe Fracking Chemicals Fluid Market Revenue Share (%), by Product Type 2025 & 2033
- Figure 26: Europe Fracking Chemicals Fluid Market Revenue (billion), by Function 2025 & 2033
- Figure 27: Europe Fracking Chemicals Fluid Market Revenue Share (%), by Function 2025 & 2033
- Figure 28: Europe Fracking Chemicals Fluid Market Revenue (billion), by Application 2025 & 2033
- Figure 29: Europe Fracking Chemicals Fluid Market Revenue Share (%), by Application 2025 & 2033
- Figure 30: Europe Fracking Chemicals Fluid Market Revenue (billion), by Country 2025 & 2033
- Figure 31: Europe Fracking Chemicals Fluid Market Revenue Share (%), by Country 2025 & 2033
- Figure 32: South America Fracking Chemicals Fluid Market Revenue (billion), by Fluid Type 2025 & 2033
- Figure 33: South America Fracking Chemicals Fluid Market Revenue Share (%), by Fluid Type 2025 & 2033
- Figure 34: South America Fracking Chemicals Fluid Market Revenue (billion), by Product Type 2025 & 2033
- Figure 35: South America Fracking Chemicals Fluid Market Revenue Share (%), by Product Type 2025 & 2033
- Figure 36: South America Fracking Chemicals Fluid Market Revenue (billion), by Function 2025 & 2033
- Figure 37: South America Fracking Chemicals Fluid Market Revenue Share (%), by Function 2025 & 2033
- Figure 38: South America Fracking Chemicals Fluid Market Revenue (billion), by Application 2025 & 2033
- Figure 39: South America Fracking Chemicals Fluid Market Revenue Share (%), by Application 2025 & 2033
- Figure 40: South America Fracking Chemicals Fluid Market Revenue (billion), by Country 2025 & 2033
- Figure 41: South America Fracking Chemicals Fluid Market Revenue Share (%), by Country 2025 & 2033
- Figure 42: Middle East and Africa Fracking Chemicals Fluid Market Revenue (billion), by Fluid Type 2025 & 2033
- Figure 43: Middle East and Africa Fracking Chemicals Fluid Market Revenue Share (%), by Fluid Type 2025 & 2033
- Figure 44: Middle East and Africa Fracking Chemicals Fluid Market Revenue (billion), by Product Type 2025 & 2033
- Figure 45: Middle East and Africa Fracking Chemicals Fluid Market Revenue Share (%), by Product Type 2025 & 2033
- Figure 46: Middle East and Africa Fracking Chemicals Fluid Market Revenue (billion), by Function 2025 & 2033
- Figure 47: Middle East and Africa Fracking Chemicals Fluid Market Revenue Share (%), by Function 2025 & 2033
- Figure 48: Middle East and Africa Fracking Chemicals Fluid Market Revenue (billion), by Application 2025 & 2033
- Figure 49: Middle East and Africa Fracking Chemicals Fluid Market Revenue Share (%), by Application 2025 & 2033
- Figure 50: Middle East and Africa Fracking Chemicals Fluid Market Revenue (billion), by Country 2025 & 2033
- Figure 51: Middle East and Africa Fracking Chemicals Fluid Market Revenue Share (%), by Country 2025 & 2033
List of Tables
- Table 1: Global Fracking Chemicals Fluid Market Revenue billion Forecast, by Fluid Type 2020 & 2033
- Table 2: Global Fracking Chemicals Fluid Market Revenue billion Forecast, by Product Type 2020 & 2033
- Table 3: Global Fracking Chemicals Fluid Market Revenue billion Forecast, by Function 2020 & 2033
- Table 4: Global Fracking Chemicals Fluid Market Revenue billion Forecast, by Application 2020 & 2033
- Table 5: Global Fracking Chemicals Fluid Market Revenue billion Forecast, by Region 2020 & 2033
- Table 6: Global Fracking Chemicals Fluid Market Revenue billion Forecast, by Fluid Type 2020 & 2033
- Table 7: Global Fracking Chemicals Fluid Market Revenue billion Forecast, by Product Type 2020 & 2033
- Table 8: Global Fracking Chemicals Fluid Market Revenue billion Forecast, by Function 2020 & 2033
- Table 9: Global Fracking Chemicals Fluid Market Revenue billion Forecast, by Application 2020 & 2033
- Table 10: Global Fracking Chemicals Fluid Market Revenue billion Forecast, by Country 2020 & 2033
- Table 11: China Fracking Chemicals Fluid Market Revenue (billion) Forecast, by Application 2020 & 2033
- Table 12: India Fracking Chemicals Fluid Market Revenue (billion) Forecast, by Application 2020 & 2033
- Table 13: Japan Fracking Chemicals Fluid Market Revenue (billion) Forecast, by Application 2020 & 2033
- Table 14: South Korea Fracking Chemicals Fluid Market Revenue (billion) Forecast, by Application 2020 & 2033
- Table 15: Rest of Asia Pacific Fracking Chemicals Fluid Market Revenue (billion) Forecast, by Application 2020 & 2033
- Table 16: Global Fracking Chemicals Fluid Market Revenue billion Forecast, by Fluid Type 2020 & 2033
- Table 17: Global Fracking Chemicals Fluid Market Revenue billion Forecast, by Product Type 2020 & 2033
- Table 18: Global Fracking Chemicals Fluid Market Revenue billion Forecast, by Function 2020 & 2033
- Table 19: Global Fracking Chemicals Fluid Market Revenue billion Forecast, by Application 2020 & 2033
- Table 20: Global Fracking Chemicals Fluid Market Revenue billion Forecast, by Country 2020 & 2033
- Table 21: United States Fracking Chemicals Fluid Market Revenue (billion) Forecast, by Application 2020 & 2033
- Table 22: Canada Fracking Chemicals Fluid Market Revenue (billion) Forecast, by Application 2020 & 2033
- Table 23: Mexico Fracking Chemicals Fluid Market Revenue (billion) Forecast, by Application 2020 & 2033
- Table 24: Global Fracking Chemicals Fluid Market Revenue billion Forecast, by Fluid Type 2020 & 2033
- Table 25: Global Fracking Chemicals Fluid Market Revenue billion Forecast, by Product Type 2020 & 2033
- Table 26: Global Fracking Chemicals Fluid Market Revenue billion Forecast, by Function 2020 & 2033
- Table 27: Global Fracking Chemicals Fluid Market Revenue billion Forecast, by Application 2020 & 2033
- Table 28: Global Fracking Chemicals Fluid Market Revenue billion Forecast, by Country 2020 & 2033
- Table 29: Germany Fracking Chemicals Fluid Market Revenue (billion) Forecast, by Application 2020 & 2033
- Table 30: United Kingdom Fracking Chemicals Fluid Market Revenue (billion) Forecast, by Application 2020 & 2033
- Table 31: France Fracking Chemicals Fluid Market Revenue (billion) Forecast, by Application 2020 & 2033
- Table 32: Italy Fracking Chemicals Fluid Market Revenue (billion) Forecast, by Application 2020 & 2033
- Table 33: Rest of Europe Fracking Chemicals Fluid Market Revenue (billion) Forecast, by Application 2020 & 2033
- Table 34: Global Fracking Chemicals Fluid Market Revenue billion Forecast, by Fluid Type 2020 & 2033
- Table 35: Global Fracking Chemicals Fluid Market Revenue billion Forecast, by Product Type 2020 & 2033
- Table 36: Global Fracking Chemicals Fluid Market Revenue billion Forecast, by Function 2020 & 2033
- Table 37: Global Fracking Chemicals Fluid Market Revenue billion Forecast, by Application 2020 & 2033
- Table 38: Global Fracking Chemicals Fluid Market Revenue billion Forecast, by Country 2020 & 2033
- Table 39: Brazil Fracking Chemicals Fluid Market Revenue (billion) Forecast, by Application 2020 & 2033
- Table 40: Argentina Fracking Chemicals Fluid Market Revenue (billion) Forecast, by Application 2020 & 2033
- Table 41: Rest of South America Fracking Chemicals Fluid Market Revenue (billion) Forecast, by Application 2020 & 2033
- Table 42: Global Fracking Chemicals Fluid Market Revenue billion Forecast, by Fluid Type 2020 & 2033
- Table 43: Global Fracking Chemicals Fluid Market Revenue billion Forecast, by Product Type 2020 & 2033
- Table 44: Global Fracking Chemicals Fluid Market Revenue billion Forecast, by Function 2020 & 2033
- Table 45: Global Fracking Chemicals Fluid Market Revenue billion Forecast, by Application 2020 & 2033
- Table 46: Global Fracking Chemicals Fluid Market Revenue billion Forecast, by Country 2020 & 2033
- Table 47: Saudi Arabia Fracking Chemicals Fluid Market Revenue (billion) Forecast, by Application 2020 & 2033
- Table 48: South Africa Fracking Chemicals Fluid Market Revenue (billion) Forecast, by Application 2020 & 2033
- Table 49: Rest of Middle East and Africa Fracking Chemicals Fluid Market Revenue (billion) Forecast, by Application 2020 & 2033
Frequently Asked Questions
1. What is the projected Compound Annual Growth Rate (CAGR) of the Fracking Chemicals Fluid Market?
The projected CAGR is approximately 7.2%.
2. Which companies are prominent players in the Fracking Chemicals Fluid Market?
Key companies in the market include Baker Hughes a GE Company LLC, Clariant, FTS International, Ashland, BASF SE, Weatherford, DuPont, Dow, SNP Inc, Halliburton, Schlumberger Limited, Chevron PhillipsChemicalCompay*List Not Exhaustive, Albemarle Corporation, Calfrac Well Services Ltd.
3. What are the main segments of the Fracking Chemicals Fluid Market?
The market segments include Fluid Type, Product Type, Function, Application.
4. Can you provide details about the market size?
The market size is estimated to be USD 46.9 billion as of 2022.
5. What are some drivers contributing to market growth?
; Growing Demand of Fracking Chemicals Fluid from Oil and Gas Industry; Other Drivers.
6. What are the notable trends driving market growth?
Growing Demand of Fracking Chemicals Fluid from Oil and Gas Industry.
7. Are there any restraints impacting market growth?
; Stringent Environmental and Governmental Regulations towards Fracking Fluids; Impact of COVID - 19.
8. Can you provide examples of recent developments in the market?
N/A
9. What pricing options are available for accessing the report?
Pricing options include single-user, multi-user, and enterprise licenses priced at USD 4750, USD 5250, and USD 8750 respectively.
10. Is the market size provided in terms of value or volume?
The market size is provided in terms of value, measured in billion.
11. Are there any specific market keywords associated with the report?
Yes, the market keyword associated with the report is "Fracking Chemicals Fluid Market," which aids in identifying and referencing the specific market segment covered.
12. How do I determine which pricing option suits my needs best?
The pricing options vary based on user requirements and access needs. Individual users may opt for single-user licenses, while businesses requiring broader access may choose multi-user or enterprise licenses for cost-effective access to the report.
13. Are there any additional resources or data provided in the Fracking Chemicals Fluid Market report?
While the report offers comprehensive insights, it's advisable to review the specific contents or supplementary materials provided to ascertain if additional resources or data are available.
14. How can I stay updated on further developments or reports in the Fracking Chemicals Fluid Market?
To stay informed about further developments, trends, and reports in the Fracking Chemicals Fluid Market, consider subscribing to industry newsletters, following relevant companies and organizations, or regularly checking reputable industry news sources and publications.
Methodology
Step 1 - Identification of Relevant Samples Size from Population Database


Step 2 - Approaches for Defining Global Market Size (Value, Volume* & Price*)

Note*: In applicable scenarios
Step 3 - Data Sources
Primary Research
- Web Analytics
- Survey Reports
- Research Institute
- Latest Research Reports
- Opinion Leaders
Secondary Research
- Annual Reports
- White Paper
- Latest Press Release
- Industry Association
- Paid Database
- Investor Presentations

Step 4 - Data Triangulation
Involves using different sources of information in order to increase the validity of a study
These sources are likely to be stakeholders in a program - participants, other researchers, program staff, other community members, and so on.
Then we put all data in single framework & apply various statistical tools to find out the dynamic on the market.
During the analysis stage, feedback from the stakeholder groups would be compared to determine areas of agreement as well as areas of divergence