

Key Insights
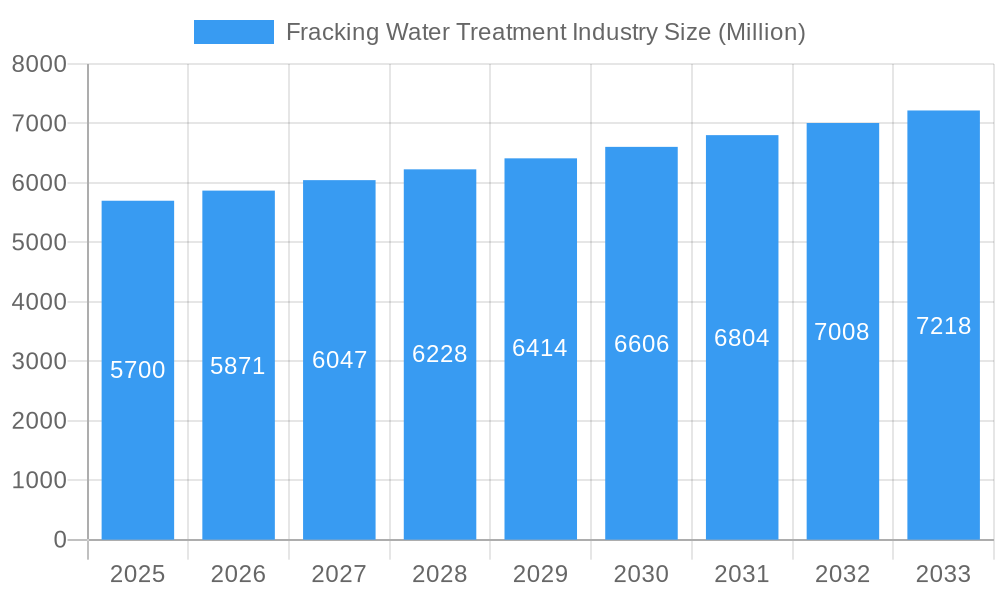
The fracking water treatment market, valued at $5.7 billion in 2025, is experiencing robust growth, projected to expand at a CAGR exceeding 3% from 2025 to 2033. This growth is fueled by increasing shale gas and oil exploration activities globally, necessitating effective water treatment solutions to manage the large volumes of produced water generated during hydraulic fracturing. Stringent environmental regulations concerning wastewater disposal are driving demand for advanced treatment technologies, such as membrane filtration, evaporation, and deep well injection, ensuring compliance and minimizing environmental impact. The market is segmented by application, with treatment and recycle dominating due to cost-effectiveness and sustainability concerns. Deep well injection, while a significant segment, faces increasing scrutiny and regulatory limitations in certain regions. North America, particularly the United States and Canada, currently holds a significant market share due to established shale gas production. However, Asia-Pacific, driven by rapid industrialization and energy demands in countries like China and India, is poised for substantial growth in the coming years. Key players like Filtra Systems, Aquatech International, and Halliburton are leveraging technological advancements and strategic partnerships to consolidate their market position.
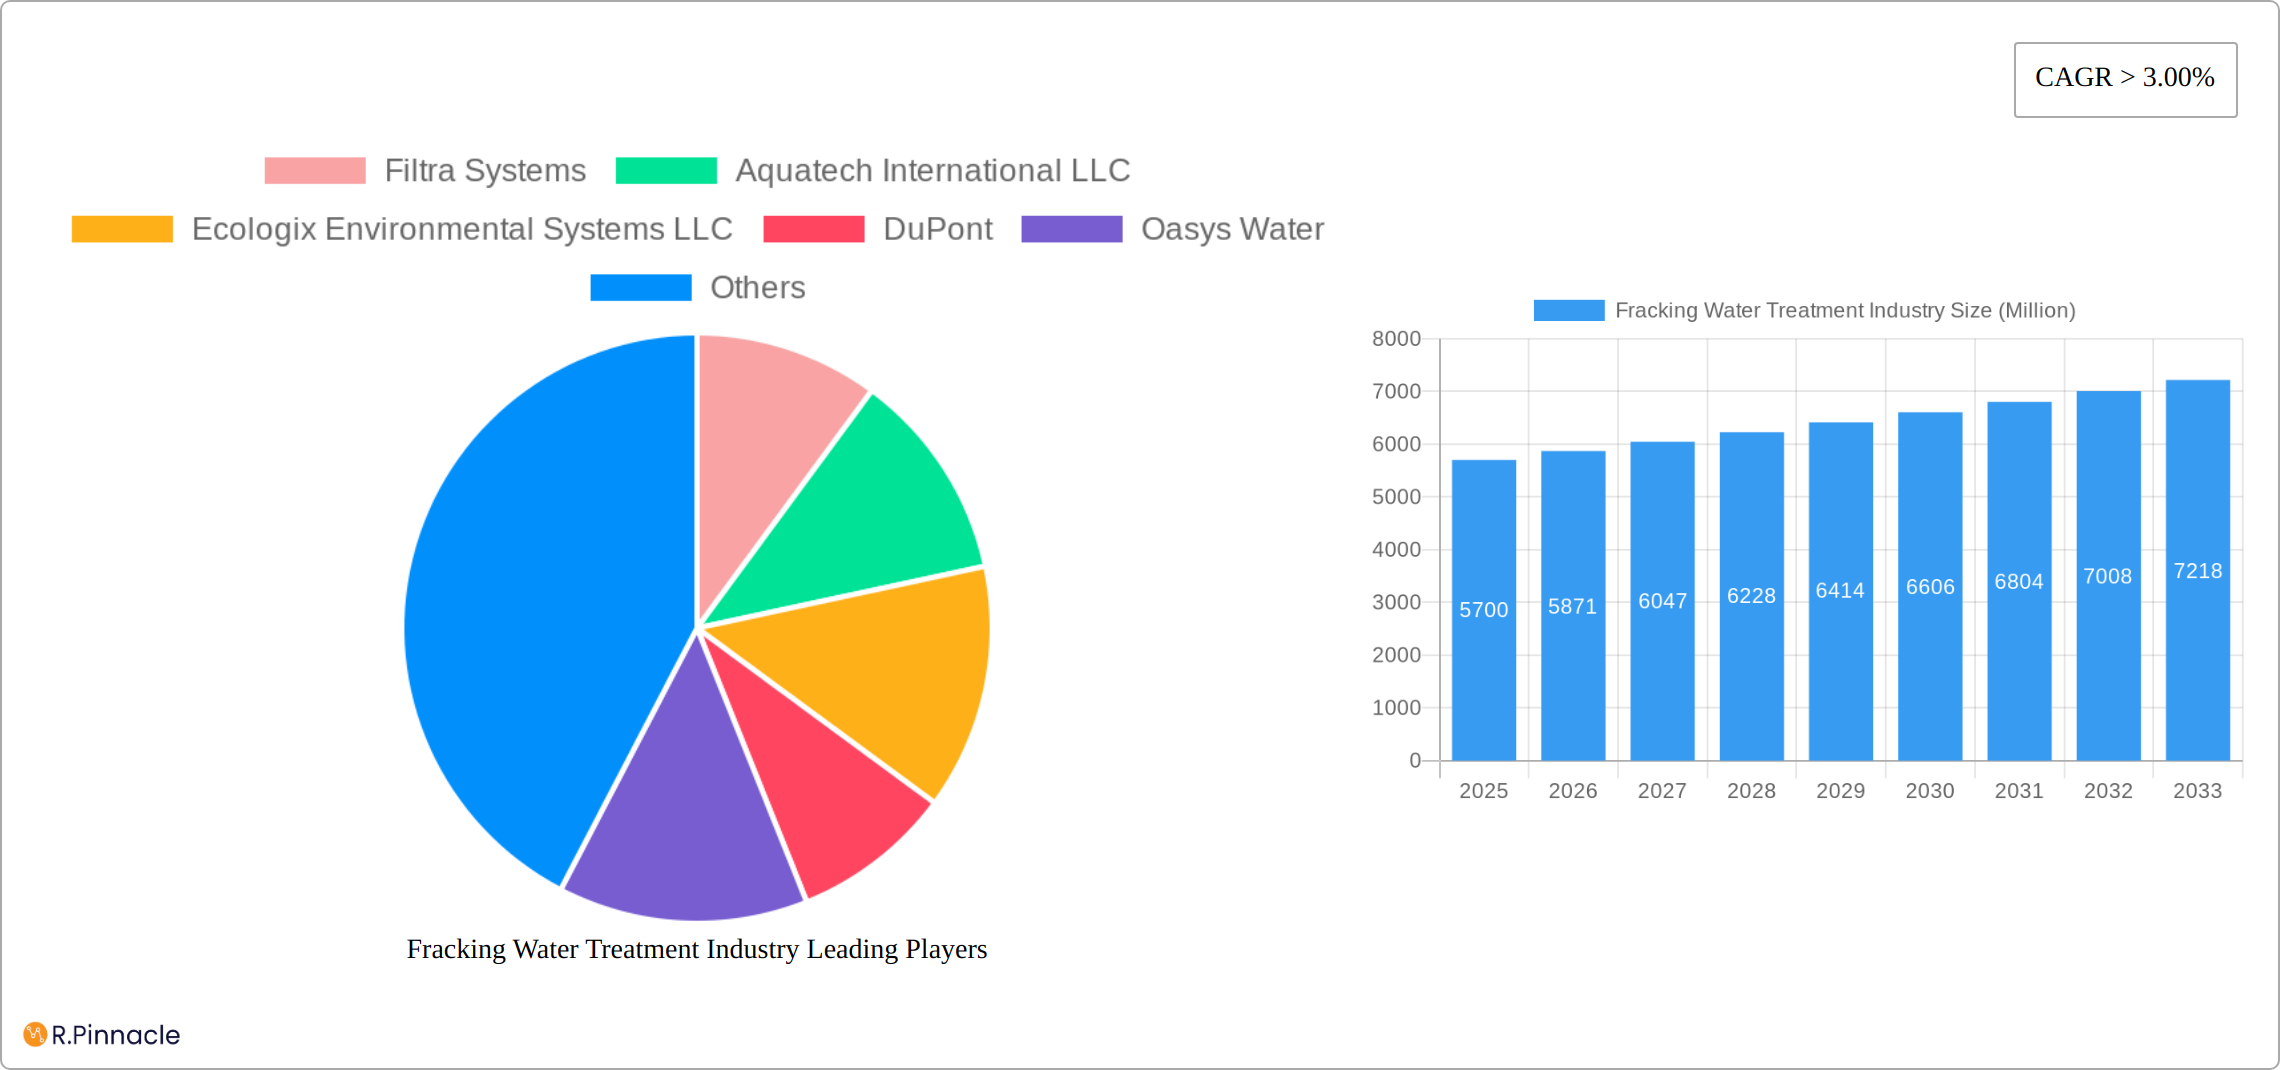
Fracking Water Treatment Industry Market Size (In Billion)
The competitive landscape is characterized by both established players and emerging technology providers. Innovation in water treatment technologies, including the development of more efficient and cost-effective solutions for produced water treatment, is a crucial driver of market growth. The focus is shifting towards sustainable practices, with increasing adoption of water recycling and reuse technologies to reduce reliance on freshwater resources and minimize environmental footprint. While the market faces challenges like fluctuating energy prices and technological complexities, the ongoing expansion of shale gas and oil exploration coupled with stringent environmental regulations ensures sustained market expansion through 2033. Regional variations in regulations and infrastructure development influence market growth trajectories, with regions like Asia-Pacific presenting significant growth opportunities.
Fracking Water Treatment Industry Company Market Share
Fracking Water Treatment Industry Report: 2019-2033
This comprehensive report provides an in-depth analysis of the global Fracking Water Treatment market, offering invaluable insights for industry professionals, investors, and stakeholders. With a study period spanning 2019-2033, a base year of 2025, and a forecast period of 2025-2033, this report leverages extensive data analysis to project future market trends and opportunities within this rapidly evolving sector. The report covers market size, segmentation, key players, technological advancements, and regulatory landscapes, providing a complete picture of the current market dynamics and future outlook. The market is projected to reach XX Million by 2033, showcasing substantial growth potential.
Fracking Water Treatment Industry Market Structure & Innovation Trends
The fracking water treatment market is characterized by a moderately concentrated structure, featuring prominent global players such as Halliburton, Schlumberger Limited, and Veolia Water Technologies, who collectively hold a substantial portion of the market share. Complementing these leaders, a dynamic ecosystem of smaller, specialized companies, including Filtra Systems, Aquatech International LLC, and Ecologix Environmental Systems LLC, fosters a competitive environment. Projections for 2025 indicate Halliburton and Schlumberger Limited maintaining their leading positions, each expected to command approximately 15-20% of the market. Smaller entities typically secure between 2-5% individually, with the remaining share distributed amongst other participants.
Innovation is a paramount driver within this sector, spurred by increasingly stringent environmental regulations and the imperative for cost-effective, sustainable water treatment solutions. Mergers and acquisitions (M&A) are a frequent occurrence, with recent deal values exceeding XX Million, signaling ongoing consolidation and strategic expansion. Notable recent examples include [insert example of M&A activity, if available, with deal value], highlighting a strategic emphasis on bolstering technological capabilities and achieving geographical reach. While alternative solutions like deep well injection are gaining traction due to their perceived lower cost, they face significant scrutiny and potential limitations owing to environmental concerns. The primary end-users of these treatment services are oil and gas exploration and production companies. It is important to note that regulatory frameworks exhibit considerable regional variation, significantly influencing the adoption rates of different water treatment technologies.
Fracking Water Treatment Industry Market Dynamics & Trends
The global fracking water treatment market is currently experiencing robust and sustained growth. This expansion is primarily attributed to the escalating global demand for oil and gas, compounded by increasingly stringent environmental regulations governing the disposal of wastewater generated during fracking operations. The Compound Annual Growth Rate (CAGR) is forecasted to be approximately XX% over the forecast period spanning 2025 to 2033. This upward trajectory is further amplified by significant technological advancements, particularly the widespread adoption of advanced membrane technologies and sophisticated automation systems, which collectively enhance treatment efficiency and lead to substantial reductions in operational costs. Disruptive technological innovations, such as the emergence of advanced oxidation processes and the development of more efficient membrane filtration systems, are actively reshaping the competitive landscape. Concurrently, consumer preferences are progressively shifting towards sustainable and environmentally responsible water treatment solutions, thereby exerting considerable pressure on companies to implement and champion eco-conscious practices. Despite these advancements, the market penetration of cutting-edge treatment technologies remains relatively modest, presenting substantial growth opportunities for forward-thinking and innovative companies within the sector.
Dominant Regions & Segments in Fracking Water Treatment Industry
North America (particularly the United States) currently dominates the fracking water treatment market, driven by extensive shale gas exploration activities and well-established infrastructure. However, regions like the Middle East and Asia-Pacific are exhibiting strong growth potential due to increasing energy demands and investments in oil and gas exploration.
Key Drivers for North American Dominance:
- Robust oil and gas production activities.
- Well-developed infrastructure for water treatment and disposal.
- Significant investments in research and development.
- Stringent environmental regulations promoting technological advancements.
Dominant Segments:
- Treatment & Recycle: This segment holds the largest market share, driven by increasing awareness of water scarcity and rising costs associated with freshwater usage.
- Deep Well Injection: While facing environmental concerns, deep well injection maintains a significant portion of the market due to its relatively lower upfront cost, albeit with limitations on long-term sustainability.
The dominance of North America is expected to continue throughout the forecast period, although other regions will witness increased market share.
Fracking Water Treatment Industry Product Innovations
Recent product innovations focus on enhancing treatment efficiency, reducing costs, and minimizing environmental impact. This includes advanced membrane filtration technologies like reverse osmosis and nanofiltration, as well as the integration of automation and data analytics for optimized process control. New product applications extend to the treatment of produced water from unconventional oil and gas extraction. The competitive advantage lies in offering cost-effective, environmentally sound, and technologically advanced solutions that meet increasingly stringent regulatory requirements.
Report Scope & Segmentation Analysis
This report segments the fracking water treatment market by application: Treatment & Recycle and Deep well Injection. The Treatment & Recycle segment is projected to experience faster growth due to increasing environmental regulations and water scarcity concerns, reaching XX Million by 2033. The Deep well Injection segment, while facing regulatory scrutiny, is expected to maintain a stable market size due to its established presence. Both segments exhibit significant competitive intensity, with established players and new entrants vying for market share.
Key Drivers of Fracking Water Treatment Industry Growth
Growth in the fracking water treatment industry is fueled by several factors: increasing oil and gas production, stringent environmental regulations promoting cleaner water treatment, technological advancements leading to more efficient and cost-effective solutions, and government initiatives fostering research and development in sustainable water management. The rising global energy demand and the increasing adoption of hydraulic fracturing techniques further contribute to this market's expansion.
Challenges in the Fracking Water Treatment Industry Sector
The industry faces challenges including fluctuating oil and gas prices impacting investment, stringent environmental regulations increasing operational costs, and the potential for technological disruptions to established methods. Supply chain disruptions can also affect the availability of crucial components for water treatment systems, resulting in project delays and increased expenses. Furthermore, intense competition necessitates continuous innovation and cost optimization to maintain market share.
Emerging Opportunities in Fracking Water Treatment Industry
The fracking water treatment industry is ripe with emerging opportunities, driven by the escalating demand for sustainable and environmentally sound water treatment technologies. A key area of growth lies in the increasing focus on water reuse and recycling initiatives, aimed at conserving precious water resources. Furthermore, the expansion of oil and gas exploration into new, often remote or environmentally sensitive, regions necessitates specialized and advanced water management solutions. Technological advancements continue to be a significant opportunity generator, with developments in advanced oxidation processes and the creation of more efficient and robust membrane systems offering substantial potential for market players. The strategic adoption of digital technologies, including IoT-enabled sensors, data analytics, and AI-driven process optimization, presents a crucial avenue for enhancing operational efficiency and reducing overall treatment costs, thereby unlocking significant value for market participants.
Leading Players in the Fracking Water Treatment Industry Market
- Filtra Systems
- Aquatech International LLC
- Ecologix Environmental Systems LLC
- DuPont
- Oasys Water
- Halliburton
- Schlumberger Limited
- Agua Dulce Technologies LLC
- Veolia Water Technologies
- Filtra Systems (repeated entry in source data)
Key Developments in Fracking Water Treatment Industry Industry
- 2022 Q3: A strategic partnership was formed between Filtra Systems and Aquatech International LLC with the explicit goal of developing and commercializing a novel membrane filtration technology specifically designed for the efficient treatment of produced water.
- 2023 Q1: Ecologix Environmental Systems LLC received significant government funding amounting to XX Million to support its pioneering research initiatives focused on developing sustainable and innovative water treatment solutions for the energy sector.
- 2024 Q2: Halliburton introduced a state-of-the-art automated water treatment system that has demonstrated a significant improvement in operational efficiency by XX% compared to previous generation technologies.
- 2025 Q1: Schlumberger Limited completed the strategic acquisition of a promising smaller membrane technology company, thereby expanding its comprehensive product portfolio and strengthening its competitive position in advanced water treatment solutions.
Future Outlook for Fracking Water Treatment Industry Market
The future trajectory of the fracking water treatment industry appears exceptionally promising, with anticipated sustained growth fueled by continuous technological innovation, heightened environmental consciousness among stakeholders, and the expanding global energy market. Success in this dynamic sector will be critically dependent on forging strategic partnerships, making substantial investments in research and development (R&D), and consistently developing more sustainable and cost-effective treatment solutions. The market is projected to experience steady and robust growth throughout the forecast period, propelled by the ongoing expansion of the oil and gas sector and the ever-tightening grip of environmental regulations aimed at responsible water management.
Fracking Water Treatment Industry Segmentation
-
1. Application
- 1.1. Treatment & Recycle
- 1.2. Deep well Injection
Fracking Water Treatment Industry Segmentation By Geography
-
1. Asia Pacific
- 1.1. China
- 1.2. India
- 1.3. Japan
- 1.4. South Korea
- 1.5. Rest of Asia Pacific
-
2. North America
- 2.1. United States
- 2.2. Canada
- 2.3. Mexico
-
3. Europe
- 3.1. Germany
- 3.2. United Kingdom
- 3.3. France
- 3.4. Italy
- 3.5. Rest of Europe
-
4. South America
- 4.1. Brazil
- 4.2. Argentina
- 4.3. Rest of South America
-
5. Middle East and Africa
- 5.1. Saudi Arabia
- 5.2. South Africa
- 5.3. Rest of Middle East and Africa
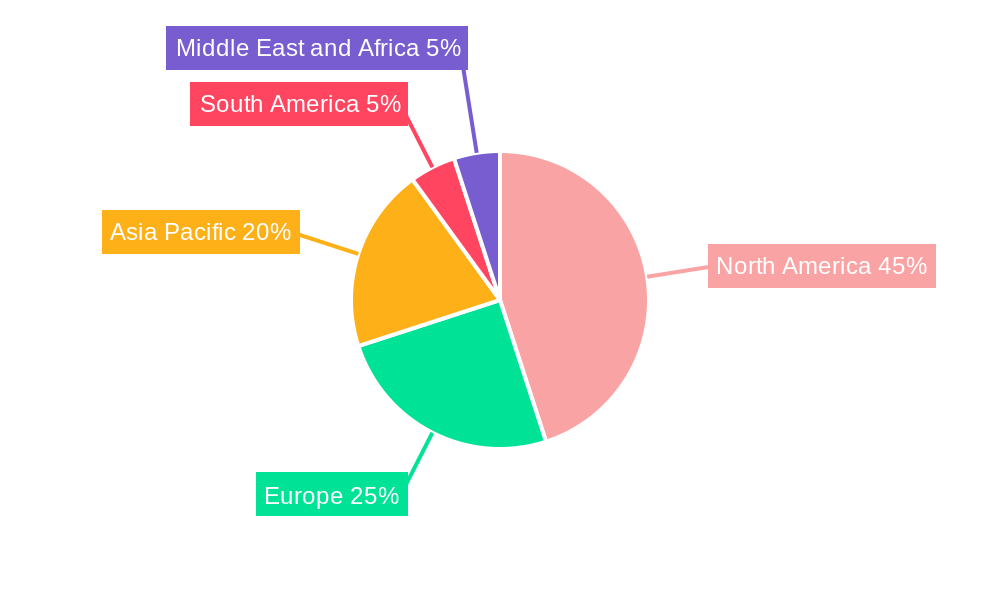
Fracking Water Treatment Industry Regional Market Share
Geographic Coverage of Fracking Water Treatment Industry
Fracking Water Treatment Industry REPORT HIGHLIGHTS
| Aspects | Details |
|---|---|
| Study Period | 2020-2034 |
| Base Year | 2025 |
| Estimated Year | 2026 |
| Forecast Period | 2026-2034 |
| Historical Period | 2020-2025 |
| Growth Rate | CAGR of > 3.00% from 2020-2034 |
| Segmentation |
|
Table of Contents
- 1. Introduction
- 1.1. Research Scope
- 1.2. Market Segmentation
- 1.3. Research Objective
- 1.4. Definitions and Assumptions
- 2. Executive Summary
- 2.1. Market Snapshot
- 3. Market Dynamics
- 3.1. Market Drivers
- 3.2. Market Restrains
- 3.3. Market Trends
- 3.4. Market Opportunities
- 4. Market Factor Analysis
- 4.1. Porters Five Forces
- 4.1.1. Bargaining Power of Suppliers
- 4.1.2. Bargaining Power of Buyers
- 4.1.3. Threat of New Entrants
- 4.1.4. Threat of Substitutes
- 4.1.5. Competitive Rivalry
- 4.2. PESTEL analysis
- 4.3. BCG Analysis
- 4.3.1. Stars (High Growth, High Market Share)
- 4.3.2. Cash Cows (Low Growth, High Market Share)
- 4.3.3. Question Mark (High Growth, Low Market Share)
- 4.3.4. Dogs (Low Growth, Low Market Share)
- 4.4. Ansoff Matrix Analysis
- 4.5. Supply Chain Analysis
- 4.6. Regulatory Landscape
- 4.7. Current Market Potential and Opportunity Assessment (TAM–SAM–SOM Framework)
- 4.8. PRI Analyst Note
- 4.1. Porters Five Forces
- 5. Market Analysis, Insights and Forecast 2021-2033
- 5.1. Market Analysis, Insights and Forecast - by Application
- 5.1.1. Treatment & Recycle
- 5.1.2. Deep well Injection
- 5.2. Market Analysis, Insights and Forecast - by Region
- 5.2.1. Asia Pacific
- 5.2.2. North America
- 5.2.3. Europe
- 5.2.4. South America
- 5.2.5. Middle East and Africa
- 5.1. Market Analysis, Insights and Forecast - by Application
- 6. Global Fracking Water Treatment Industry Analysis, Insights and Forecast, 2021-2033
- 6.1. Market Analysis, Insights and Forecast - by Application
- 6.1.1. Treatment & Recycle
- 6.1.2. Deep well Injection
- 6.1. Market Analysis, Insights and Forecast - by Application
- 7. Asia Pacific Fracking Water Treatment Industry Analysis, Insights and Forecast, 2020-2032
- 7.1. Market Analysis, Insights and Forecast - by Application
- 7.1.1. Treatment & Recycle
- 7.1.2. Deep well Injection
- 7.1. Market Analysis, Insights and Forecast - by Application
- 8. North America Fracking Water Treatment Industry Analysis, Insights and Forecast, 2020-2032
- 8.1. Market Analysis, Insights and Forecast - by Application
- 8.1.1. Treatment & Recycle
- 8.1.2. Deep well Injection
- 8.1. Market Analysis, Insights and Forecast - by Application
- 9. Europe Fracking Water Treatment Industry Analysis, Insights and Forecast, 2020-2032
- 9.1. Market Analysis, Insights and Forecast - by Application
- 9.1.1. Treatment & Recycle
- 9.1.2. Deep well Injection
- 9.1. Market Analysis, Insights and Forecast - by Application
- 10. South America Fracking Water Treatment Industry Analysis, Insights and Forecast, 2020-2032
- 10.1. Market Analysis, Insights and Forecast - by Application
- 10.1.1. Treatment & Recycle
- 10.1.2. Deep well Injection
- 10.1. Market Analysis, Insights and Forecast - by Application
- 11. Middle East and Africa Fracking Water Treatment Industry Analysis, Insights and Forecast, 2020-2032
- 11.1. Market Analysis, Insights and Forecast - by Application
- 11.1.1. Treatment & Recycle
- 11.1.2. Deep well Injection
- 11.1. Market Analysis, Insights and Forecast - by Application
- 12. Competitive Analysis
- 12.1. Company Profiles
- 12.1.1 Filtra Systems
- 12.1.1.1. Company Overview
- 12.1.1.2. Products
- 12.1.1.3. Company Financials
- 12.1.1.4. SWOT Analysis
- 12.1.2 Aquatech International LLC
- 12.1.2.1. Company Overview
- 12.1.2.2. Products
- 12.1.2.3. Company Financials
- 12.1.2.4. SWOT Analysis
- 12.1.3 Ecologix Environmental Systems LLC
- 12.1.3.1. Company Overview
- 12.1.3.2. Products
- 12.1.3.3. Company Financials
- 12.1.3.4. SWOT Analysis
- 12.1.4 DuPont
- 12.1.4.1. Company Overview
- 12.1.4.2. Products
- 12.1.4.3. Company Financials
- 12.1.4.4. SWOT Analysis
- 12.1.5 Oasys Water
- 12.1.5.1. Company Overview
- 12.1.5.2. Products
- 12.1.5.3. Company Financials
- 12.1.5.4. SWOT Analysis
- 12.1.6 Halliburton
- 12.1.6.1. Company Overview
- 12.1.6.2. Products
- 12.1.6.3. Company Financials
- 12.1.6.4. SWOT Analysis
- 12.1.7 Schlumberger Limited
- 12.1.7.1. Company Overview
- 12.1.7.2. Products
- 12.1.7.3. Company Financials
- 12.1.7.4. SWOT Analysis
- 12.1.8 Agua Dulce Technologies LLC
- 12.1.8.1. Company Overview
- 12.1.8.2. Products
- 12.1.8.3. Company Financials
- 12.1.8.4. SWOT Analysis
- 12.1.9 Veolia Water Technologies*List Not Exhaustive
- 12.1.9.1. Company Overview
- 12.1.9.2. Products
- 12.1.9.3. Company Financials
- 12.1.9.4. SWOT Analysis
- 12.1.10 Filtra Systems
- 12.1.10.1. Company Overview
- 12.1.10.2. Products
- 12.1.10.3. Company Financials
- 12.1.10.4. SWOT Analysis
- 12.1.1 Filtra Systems
- 12.2. Market Entropy
- 12.2.1 Company's Key Areas Served
- 12.2.2 Recent Developments
- 12.3. Company Market Share Analysis 2025
- 12.3.1 Top 5 Companies Market Share Analysis
- 12.3.2 Top 3 Companies Market Share Analysis
- 12.4. List of Potential Customers
- 13. Research Methodology
List of Figures
- Figure 1: Global Fracking Water Treatment Industry Revenue Breakdown (Million, %) by Region 2025 & 2033
- Figure 2: Global Fracking Water Treatment Industry Volume Breakdown (liter , %) by Region 2025 & 2033
- Figure 3: Asia Pacific Fracking Water Treatment Industry Revenue (Million), by Application 2025 & 2033
- Figure 4: Asia Pacific Fracking Water Treatment Industry Volume (liter ), by Application 2025 & 2033
- Figure 5: Asia Pacific Fracking Water Treatment Industry Revenue Share (%), by Application 2025 & 2033
- Figure 6: Asia Pacific Fracking Water Treatment Industry Volume Share (%), by Application 2025 & 2033
- Figure 7: Asia Pacific Fracking Water Treatment Industry Revenue (Million), by Country 2025 & 2033
- Figure 8: Asia Pacific Fracking Water Treatment Industry Volume (liter ), by Country 2025 & 2033
- Figure 9: Asia Pacific Fracking Water Treatment Industry Revenue Share (%), by Country 2025 & 2033
- Figure 10: Asia Pacific Fracking Water Treatment Industry Volume Share (%), by Country 2025 & 2033
- Figure 11: North America Fracking Water Treatment Industry Revenue (Million), by Application 2025 & 2033
- Figure 12: North America Fracking Water Treatment Industry Volume (liter ), by Application 2025 & 2033
- Figure 13: North America Fracking Water Treatment Industry Revenue Share (%), by Application 2025 & 2033
- Figure 14: North America Fracking Water Treatment Industry Volume Share (%), by Application 2025 & 2033
- Figure 15: North America Fracking Water Treatment Industry Revenue (Million), by Country 2025 & 2033
- Figure 16: North America Fracking Water Treatment Industry Volume (liter ), by Country 2025 & 2033
- Figure 17: North America Fracking Water Treatment Industry Revenue Share (%), by Country 2025 & 2033
- Figure 18: North America Fracking Water Treatment Industry Volume Share (%), by Country 2025 & 2033
- Figure 19: Europe Fracking Water Treatment Industry Revenue (Million), by Application 2025 & 2033
- Figure 20: Europe Fracking Water Treatment Industry Volume (liter ), by Application 2025 & 2033
- Figure 21: Europe Fracking Water Treatment Industry Revenue Share (%), by Application 2025 & 2033
- Figure 22: Europe Fracking Water Treatment Industry Volume Share (%), by Application 2025 & 2033
- Figure 23: Europe Fracking Water Treatment Industry Revenue (Million), by Country 2025 & 2033
- Figure 24: Europe Fracking Water Treatment Industry Volume (liter ), by Country 2025 & 2033
- Figure 25: Europe Fracking Water Treatment Industry Revenue Share (%), by Country 2025 & 2033
- Figure 26: Europe Fracking Water Treatment Industry Volume Share (%), by Country 2025 & 2033
- Figure 27: South America Fracking Water Treatment Industry Revenue (Million), by Application 2025 & 2033
- Figure 28: South America Fracking Water Treatment Industry Volume (liter ), by Application 2025 & 2033
- Figure 29: South America Fracking Water Treatment Industry Revenue Share (%), by Application 2025 & 2033
- Figure 30: South America Fracking Water Treatment Industry Volume Share (%), by Application 2025 & 2033
- Figure 31: South America Fracking Water Treatment Industry Revenue (Million), by Country 2025 & 2033
- Figure 32: South America Fracking Water Treatment Industry Volume (liter ), by Country 2025 & 2033
- Figure 33: South America Fracking Water Treatment Industry Revenue Share (%), by Country 2025 & 2033
- Figure 34: South America Fracking Water Treatment Industry Volume Share (%), by Country 2025 & 2033
- Figure 35: Middle East and Africa Fracking Water Treatment Industry Revenue (Million), by Application 2025 & 2033
- Figure 36: Middle East and Africa Fracking Water Treatment Industry Volume (liter ), by Application 2025 & 2033
- Figure 37: Middle East and Africa Fracking Water Treatment Industry Revenue Share (%), by Application 2025 & 2033
- Figure 38: Middle East and Africa Fracking Water Treatment Industry Volume Share (%), by Application 2025 & 2033
- Figure 39: Middle East and Africa Fracking Water Treatment Industry Revenue (Million), by Country 2025 & 2033
- Figure 40: Middle East and Africa Fracking Water Treatment Industry Volume (liter ), by Country 2025 & 2033
- Figure 41: Middle East and Africa Fracking Water Treatment Industry Revenue Share (%), by Country 2025 & 2033
- Figure 42: Middle East and Africa Fracking Water Treatment Industry Volume Share (%), by Country 2025 & 2033
List of Tables
- Table 1: Global Fracking Water Treatment Industry Revenue Million Forecast, by Application 2020 & 2033
- Table 2: Global Fracking Water Treatment Industry Volume liter Forecast, by Application 2020 & 2033
- Table 3: Global Fracking Water Treatment Industry Revenue Million Forecast, by Region 2020 & 2033
- Table 4: Global Fracking Water Treatment Industry Volume liter Forecast, by Region 2020 & 2033
- Table 5: Global Fracking Water Treatment Industry Revenue Million Forecast, by Application 2020 & 2033
- Table 6: Global Fracking Water Treatment Industry Volume liter Forecast, by Application 2020 & 2033
- Table 7: Global Fracking Water Treatment Industry Revenue Million Forecast, by Country 2020 & 2033
- Table 8: Global Fracking Water Treatment Industry Volume liter Forecast, by Country 2020 & 2033
- Table 9: China Fracking Water Treatment Industry Revenue (Million) Forecast, by Application 2020 & 2033
- Table 10: China Fracking Water Treatment Industry Volume (liter ) Forecast, by Application 2020 & 2033
- Table 11: India Fracking Water Treatment Industry Revenue (Million) Forecast, by Application 2020 & 2033
- Table 12: India Fracking Water Treatment Industry Volume (liter ) Forecast, by Application 2020 & 2033
- Table 13: Japan Fracking Water Treatment Industry Revenue (Million) Forecast, by Application 2020 & 2033
- Table 14: Japan Fracking Water Treatment Industry Volume (liter ) Forecast, by Application 2020 & 2033
- Table 15: South Korea Fracking Water Treatment Industry Revenue (Million) Forecast, by Application 2020 & 2033
- Table 16: South Korea Fracking Water Treatment Industry Volume (liter ) Forecast, by Application 2020 & 2033
- Table 17: Rest of Asia Pacific Fracking Water Treatment Industry Revenue (Million) Forecast, by Application 2020 & 2033
- Table 18: Rest of Asia Pacific Fracking Water Treatment Industry Volume (liter ) Forecast, by Application 2020 & 2033
- Table 19: Global Fracking Water Treatment Industry Revenue Million Forecast, by Application 2020 & 2033
- Table 20: Global Fracking Water Treatment Industry Volume liter Forecast, by Application 2020 & 2033
- Table 21: Global Fracking Water Treatment Industry Revenue Million Forecast, by Country 2020 & 2033
- Table 22: Global Fracking Water Treatment Industry Volume liter Forecast, by Country 2020 & 2033
- Table 23: United States Fracking Water Treatment Industry Revenue (Million) Forecast, by Application 2020 & 2033
- Table 24: United States Fracking Water Treatment Industry Volume (liter ) Forecast, by Application 2020 & 2033
- Table 25: Canada Fracking Water Treatment Industry Revenue (Million) Forecast, by Application 2020 & 2033
- Table 26: Canada Fracking Water Treatment Industry Volume (liter ) Forecast, by Application 2020 & 2033
- Table 27: Mexico Fracking Water Treatment Industry Revenue (Million) Forecast, by Application 2020 & 2033
- Table 28: Mexico Fracking Water Treatment Industry Volume (liter ) Forecast, by Application 2020 & 2033
- Table 29: Global Fracking Water Treatment Industry Revenue Million Forecast, by Application 2020 & 2033
- Table 30: Global Fracking Water Treatment Industry Volume liter Forecast, by Application 2020 & 2033
- Table 31: Global Fracking Water Treatment Industry Revenue Million Forecast, by Country 2020 & 2033
- Table 32: Global Fracking Water Treatment Industry Volume liter Forecast, by Country 2020 & 2033
- Table 33: Germany Fracking Water Treatment Industry Revenue (Million) Forecast, by Application 2020 & 2033
- Table 34: Germany Fracking Water Treatment Industry Volume (liter ) Forecast, by Application 2020 & 2033
- Table 35: United Kingdom Fracking Water Treatment Industry Revenue (Million) Forecast, by Application 2020 & 2033
- Table 36: United Kingdom Fracking Water Treatment Industry Volume (liter ) Forecast, by Application 2020 & 2033
- Table 37: France Fracking Water Treatment Industry Revenue (Million) Forecast, by Application 2020 & 2033
- Table 38: France Fracking Water Treatment Industry Volume (liter ) Forecast, by Application 2020 & 2033
- Table 39: Italy Fracking Water Treatment Industry Revenue (Million) Forecast, by Application 2020 & 2033
- Table 40: Italy Fracking Water Treatment Industry Volume (liter ) Forecast, by Application 2020 & 2033
- Table 41: Rest of Europe Fracking Water Treatment Industry Revenue (Million) Forecast, by Application 2020 & 2033
- Table 42: Rest of Europe Fracking Water Treatment Industry Volume (liter ) Forecast, by Application 2020 & 2033
- Table 43: Global Fracking Water Treatment Industry Revenue Million Forecast, by Application 2020 & 2033
- Table 44: Global Fracking Water Treatment Industry Volume liter Forecast, by Application 2020 & 2033
- Table 45: Global Fracking Water Treatment Industry Revenue Million Forecast, by Country 2020 & 2033
- Table 46: Global Fracking Water Treatment Industry Volume liter Forecast, by Country 2020 & 2033
- Table 47: Brazil Fracking Water Treatment Industry Revenue (Million) Forecast, by Application 2020 & 2033
- Table 48: Brazil Fracking Water Treatment Industry Volume (liter ) Forecast, by Application 2020 & 2033
- Table 49: Argentina Fracking Water Treatment Industry Revenue (Million) Forecast, by Application 2020 & 2033
- Table 50: Argentina Fracking Water Treatment Industry Volume (liter ) Forecast, by Application 2020 & 2033
- Table 51: Rest of South America Fracking Water Treatment Industry Revenue (Million) Forecast, by Application 2020 & 2033
- Table 52: Rest of South America Fracking Water Treatment Industry Volume (liter ) Forecast, by Application 2020 & 2033
- Table 53: Global Fracking Water Treatment Industry Revenue Million Forecast, by Application 2020 & 2033
- Table 54: Global Fracking Water Treatment Industry Volume liter Forecast, by Application 2020 & 2033
- Table 55: Global Fracking Water Treatment Industry Revenue Million Forecast, by Country 2020 & 2033
- Table 56: Global Fracking Water Treatment Industry Volume liter Forecast, by Country 2020 & 2033
- Table 57: Saudi Arabia Fracking Water Treatment Industry Revenue (Million) Forecast, by Application 2020 & 2033
- Table 58: Saudi Arabia Fracking Water Treatment Industry Volume (liter ) Forecast, by Application 2020 & 2033
- Table 59: South Africa Fracking Water Treatment Industry Revenue (Million) Forecast, by Application 2020 & 2033
- Table 60: South Africa Fracking Water Treatment Industry Volume (liter ) Forecast, by Application 2020 & 2033
- Table 61: Rest of Middle East and Africa Fracking Water Treatment Industry Revenue (Million) Forecast, by Application 2020 & 2033
- Table 62: Rest of Middle East and Africa Fracking Water Treatment Industry Volume (liter ) Forecast, by Application 2020 & 2033
Frequently Asked Questions
1. What is the projected Compound Annual Growth Rate (CAGR) of the Fracking Water Treatment Industry?
The projected CAGR is approximately > 3.00%.
2. Which companies are prominent players in the Fracking Water Treatment Industry?
Key companies in the market include Filtra Systems, Aquatech International LLC, Ecologix Environmental Systems LLC, DuPont, Oasys Water, Halliburton, Schlumberger Limited, Agua Dulce Technologies LLC, Veolia Water Technologies*List Not Exhaustive, Filtra Systems.
3. What are the main segments of the Fracking Water Treatment Industry?
The market segments include Application.
4. Can you provide details about the market size?
The market size is estimated to be USD 5700 Million as of 2022.
5. What are some drivers contributing to market growth?
; High Demand from Treatment & Recycle Segment; Stringent Government Regulations.
6. What are the notable trends driving market growth?
High Demand from Treatment & Recycle Segment.
7. Are there any restraints impacting market growth?
; Outbreak of COVID-19; Other Restraints.
8. Can you provide examples of recent developments in the market?
Partnerships between industry players to develop innovative technologies
9. What pricing options are available for accessing the report?
Pricing options include single-user, multi-user, and enterprise licenses priced at USD 4750, USD 5250, and USD 8750 respectively.
10. Is the market size provided in terms of value or volume?
The market size is provided in terms of value, measured in Million and volume, measured in liter .
11. Are there any specific market keywords associated with the report?
Yes, the market keyword associated with the report is "Fracking Water Treatment Industry," which aids in identifying and referencing the specific market segment covered.
12. How do I determine which pricing option suits my needs best?
The pricing options vary based on user requirements and access needs. Individual users may opt for single-user licenses, while businesses requiring broader access may choose multi-user or enterprise licenses for cost-effective access to the report.
13. Are there any additional resources or data provided in the Fracking Water Treatment Industry report?
While the report offers comprehensive insights, it's advisable to review the specific contents or supplementary materials provided to ascertain if additional resources or data are available.
14. How can I stay updated on further developments or reports in the Fracking Water Treatment Industry?
To stay informed about further developments, trends, and reports in the Fracking Water Treatment Industry, consider subscribing to industry newsletters, following relevant companies and organizations, or regularly checking reputable industry news sources and publications.
Methodology
Step 1 - Identification of Relevant Samples Size from Population Database


Step 2 - Approaches for Defining Global Market Size (Value, Volume* & Price*)

Note*: In applicable scenarios
Step 3 - Data Sources
Primary Research
- Web Analytics
- Survey Reports
- Research Institute
- Latest Research Reports
- Opinion Leaders
Secondary Research
- Annual Reports
- White Paper
- Latest Press Release
- Industry Association
- Paid Database
- Investor Presentations

Step 4 - Data Triangulation
Involves using different sources of information in order to increase the validity of a study
These sources are likely to be stakeholders in a program - participants, other researchers, program staff, other community members, and so on.
Then we put all data in single framework & apply various statistical tools to find out the dynamic on the market.
During the analysis stage, feedback from the stakeholder groups would be compared to determine areas of agreement as well as areas of divergence