

Key Insights
The GCC/MENA water and gas valves market is poised for significant expansion, propelled by robust investments in water infrastructure and the burgeoning energy sector across the region. The market, valued at $11.69 billion in 2025, is projected to achieve a Compound Annual Growth Rate (CAGR) of 5.12% through 2033. Key growth drivers include increasing urbanization, industrialization, and the critical need to upgrade aging water and gas distribution networks. Government initiatives focused on water conservation and energy efficiency further stimulate demand for advanced valve solutions. Substantial investments in large-scale water desalination and gas pipeline projects across the GCC and MENA regions present considerable opportunities for valve manufacturers. Additionally, stringent environmental regulations are fostering the adoption of energy-efficient and sustainable valve technologies.
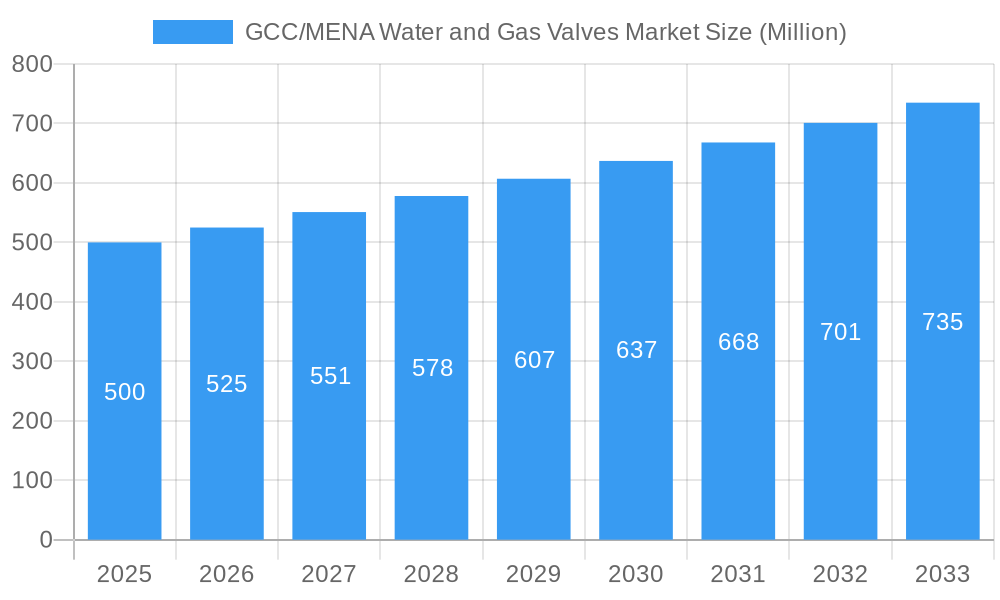
GCC/MENA Water and Gas Valves Market Market Size (In Billion)
The market is segmented by valve type, including butterfly, ball, globe, gate, plug, and others, and by application into industrial and municipal sectors, with industrial applications currently holding the dominant market share. Leading companies such as Honeywell, Danfoss, and Baker Hughes are actively competing, prioritizing technological innovation and strategic partnerships.
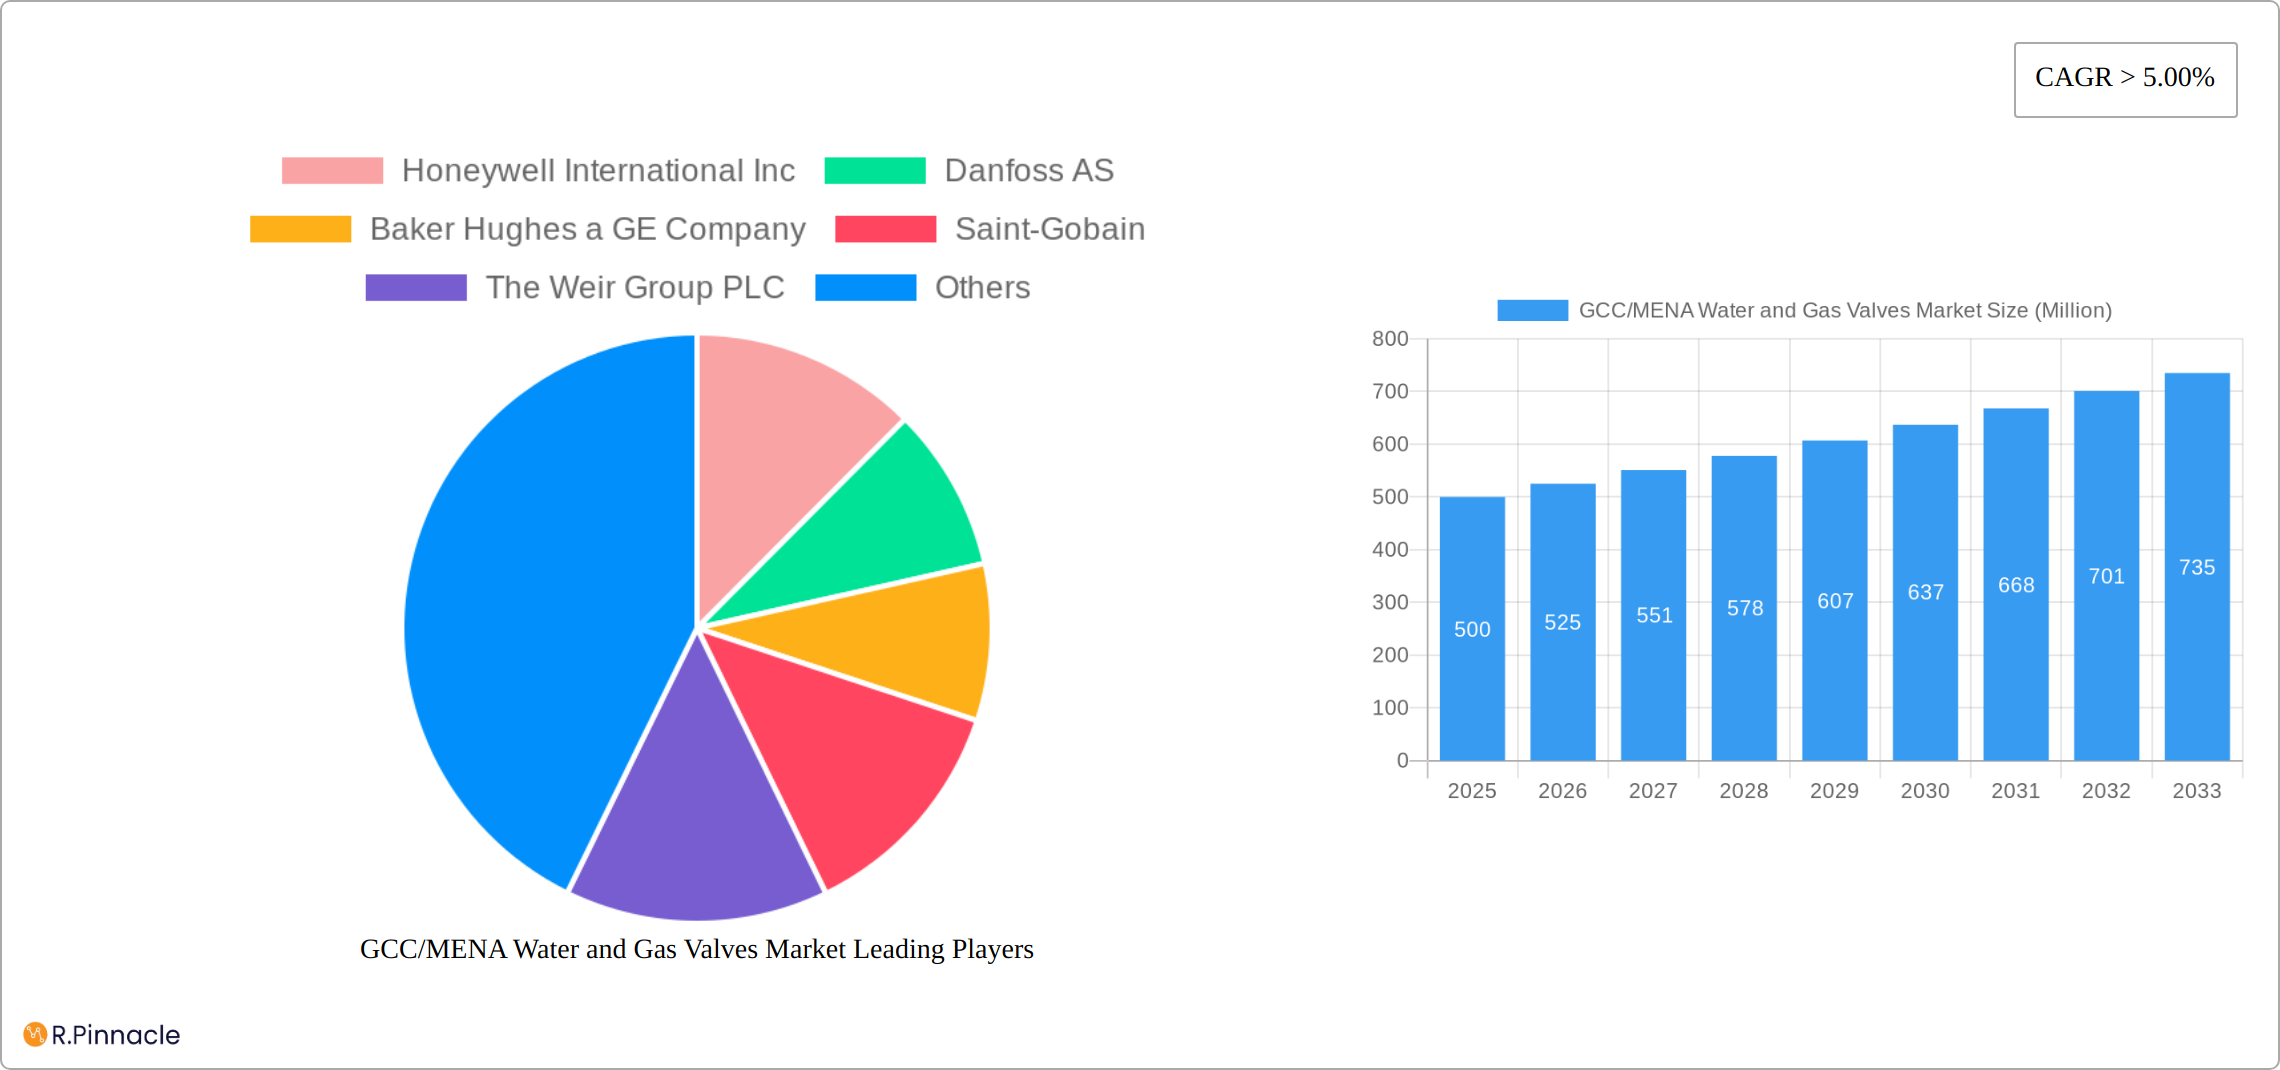
GCC/MENA Water and Gas Valves Market Company Market Share
The competitive landscape features both established international entities and regional manufacturers. The adoption of smart valves, integrated with advanced monitoring and control systems, is increasing, enhancing operational efficiency and reducing maintenance expenditures. Potential challenges, including fluctuating oil prices and geopolitical instability, may influence market growth in the long term. Nevertheless, the outlook for the GCC/MENA water and gas valves market remains optimistic, underscored by the region's commitment to infrastructure development and its pivotal role in global energy markets. The sustained focus on water security and energy diversification will continue to drive demand for reliable and efficient water and gas valve systems throughout the forecast period.
GCC/MENA Water and Gas Valves Market Analysis: 2019-2033
This comprehensive report offers an in-depth analysis of the GCC/MENA Water and Gas Valves market, delivering critical insights for industry professionals, investors, and strategic decision-makers. Covering the period 2019-2033, with a base year of 2025 and a forecast period of 2025-2033, the report meticulously examines market dynamics, segmentation, key players, and future growth prospects, providing actionable intelligence for navigating this dynamic sector.
GCC/MENA Water and Gas Valves Market Market Structure & Innovation Trends
The GCC/MENA Water and Gas Valves market exhibits a moderately concentrated structure, with a few major players holding significant market share. Honeywell International Inc, Danfoss AS, and Baker Hughes a GE Company are among the leading players, collectively accounting for an estimated xx% of the market in 2025. Innovation is driven by increasing demand for energy-efficient and sustainable solutions, stringent regulatory frameworks promoting water conservation, and the adoption of smart technologies. Product substitution is largely driven by the increasing adoption of advanced materials and designs offering improved durability and performance. The market has witnessed a number of M&A activities in recent years, with deal values exceeding xx Million in the period 2019-2024. End-user demographics are largely influenced by the region's rapid urbanization and industrialization, creating a robust demand for advanced water and gas valve solutions.
- Market Concentration: Moderately concentrated, with top 3 players holding xx% market share in 2025.
- Innovation Drivers: Energy efficiency, sustainability, smart technologies, and stringent regulations.
- M&A Activity: Deal values exceeding xx Million (2019-2024).
- End-User Demographics: Driven by urbanization and industrialization.
GCC/MENA Water and Gas Valves Market Market Dynamics & Trends
The GCC/MENA Water and Gas Valves market is projected to experience significant growth during the forecast period (2025-2033), with a CAGR of xx%. This growth is primarily fueled by substantial investments in infrastructure development across the region, particularly in water and gas distribution networks. Technological advancements, such as the integration of smart sensors and remote monitoring capabilities, are enhancing the efficiency and reliability of valve systems, further driving market expansion. Consumer preferences are shifting towards sustainable and eco-friendly solutions, prompting manufacturers to focus on developing energy-efficient products. Competitive dynamics are characterized by intense competition among established players and the emergence of new entrants offering innovative solutions. Market penetration of smart valves is currently at xx% and is expected to reach xx% by 2033.
Dominant Regions & Segments in GCC/MENA Water and Gas Valves Market
The United Arab Emirates (UAE) and Saudi Arabia are the leading markets within the GCC/MENA region for water and gas valves. This dominance stems from significant investments in large-scale infrastructure projects and the robust expansion of their industrial sectors. Ball valves and butterfly valves currently command the largest market share due to their versatility and suitability across a wide range of applications. While the industrial sector currently holds the largest share (xx%), the municipal sector is projected to experience substantial growth in the coming years, driven by rapid urbanization and considerable investments in upgrading water infrastructure. This growth is further fueled by increasing government initiatives focused on enhancing water security and resource management.
- Key Drivers in UAE & Saudi Arabia: Massive infrastructure development programs, including smart city initiatives, burgeoning industrial growth across diverse sectors (petrochemicals, manufacturing, etc.), and substantial government funding allocated to water and gas infrastructure projects.
- Dominant Product Types: Ball valves and butterfly valves maintain their leading position due to their wide applicability, cost-effectiveness, and proven reliability in diverse operating conditions.
- Dominant Application: The industrial sector continues to be the primary consumer of water and gas valves due to its extensive requirements for high-volume flow control and process regulation. However, the rising importance of municipal water networks is driving significant demand from this sector.
- Municipal Segment Growth: This sector is experiencing exponential growth driven by factors including population increase, improving living standards, increasing demand for reliable water supplies, and proactive government investments in modernizing aging water networks.
GCC/MENA Water and Gas Valves Market Product Innovations
Recent innovations within the GCC/MENA water and gas valves market are significantly enhancing operational efficiency and reliability. Smart valves equipped with integrated sensors allow for real-time remote monitoring and control, optimizing performance and reducing manual intervention. The development of advanced materials, offering superior durability and corrosion resistance, extends the lifespan of valves and minimizes maintenance needs. Furthermore, the design of energy-efficient valves is contributing to reduced operational costs and a smaller environmental footprint. A clear trend is the market shift towards digitally enabled solutions and predictive maintenance strategies, allowing for proactive maintenance scheduling and the prevention of costly downtime.
Report Scope & Segmentation Analysis
This report segments the GCC/MENA water and gas valves market based on type (Butterfly Valve, Ball Valve, Globe Valve, Gate Valve, Plug Valve, Other Types) and application (Industrial, Municipal). Each segment is analyzed in terms of market size, growth rate, and competitive dynamics. The Butterfly Valve segment is projected to show significant growth due to its versatility and cost-effectiveness. The Industrial application segment currently holds a dominant position, however, the Municipal segment is expected to see accelerated growth driven by rising urbanization and infrastructural spending.
- By Type: Butterfly Valve, Ball Valve, Globe Valve, Gate Valve, Plug Valve, Other Types.
- By Application: Industrial, Municipal.
Key Drivers of GCC/MENA Water and Gas Valves Market Growth
The GCC/MENA water and gas valves market is driven by several key factors, including significant government investments in water and gas infrastructure projects, rapid industrialization and urbanization leading to increased demand, stringent environmental regulations promoting water conservation and efficient resource management, and the adoption of smart technologies enhancing efficiency and monitoring capabilities. The rising energy demand and the related expansion of gas pipelines further stimulate market growth.
Challenges in the GCC/MENA Water and Gas Valves Market Sector
The GCC/MENA water and gas valves market faces several challenges. Fluctuations in global oil prices directly impact project budgets and investment decisions within the region. Furthermore, the reliance on imports for certain raw materials creates vulnerabilities within the supply chain, potentially leading to delays and price volatility. The market is characterized by intense competition amongst both established players and emerging market entrants. Strict regulatory compliance standards and safety regulations also pose challenges to manufacturers, requiring substantial investment in compliance and quality control.
Emerging Opportunities in GCC/MENA Water and Gas Valves Market
Despite the challenges, substantial opportunities exist for growth and innovation. The increasing adoption of smart valves and advanced remote monitoring technologies is creating new market segments and driving demand. The growth of the renewable energy sector, particularly solar and wind power, is generating considerable demand for advanced valve solutions optimized for these applications. Government initiatives promoting water conservation, efficient resource management, and sustainable development create significant opportunities for manufacturers offering innovative and environmentally conscious valve technologies.
Leading Players in the GCC/MENA Water and Gas Valves Market Market
- Honeywell International Inc
- Danfoss AS
- Baker Hughes a GE Company
- Saint-Gobain
- The Weir Group PLC
- Flowserve Corporation
- Georg Fischer Ltd
- Emerson Electric Co
- IMI Critical Engineering
- Crane Co
- AVK Gulf And Watecom International Water Network LLC
- Schlumberger Limited
- TechnipFMC PLC
- Alfa Laval AB
- Circor International Inc
Key Developments in GCC/MENA Water and Gas Valves Market Industry
- January 2023: Honeywell International Inc. launches a new line of smart water valves with integrated IoT capabilities.
- June 2022: Danfoss AS announces a strategic partnership with a local distributor to expand its presence in the Saudi Arabian market.
- October 2021: Baker Hughes a GE Company secures a major contract for the supply of valves for a large-scale water treatment plant in the UAE. (Further key developments to be added)
Future Outlook for GCC/MENA Water and Gas Valves Market Market
The GCC/MENA water and gas valves market is forecast to experience sustained and robust growth driven by consistent infrastructure development across the region, ongoing technological advancements, and the increasing commitment to water conservation and resource efficiency. The integration of smart technologies and the focus on sustainable solutions will continue to reshape the market landscape. Companies offering innovative, efficient, and reliable valve solutions are well-positioned to capitalize on these significant opportunities. The long-term outlook hinges on the region's continuing economic growth and its ongoing commitment to upgrading its water and gas infrastructure to meet the needs of a rapidly growing population and diversifying economy.
GCC/MENA Water and Gas Valves Market Segmentation
-
1. Type
- 1.1. Butterfly Valve
- 1.2. Ball Valve
- 1.3. Globe Valve
- 1.4. Gate Valve
- 1.5. Plug Valve
- 1.6. Other Types
-
2. Application
- 2.1. Industrial
- 2.2. Municipal
-
3. Geography
- 3.1. Saudi Arabia
- 3.2. United Arab Emirates
- 3.3. Qatar
- 3.4. Algeria
- 3.5. Egypt
- 3.6. Iran
- 3.7. Iraq
- 3.8. Rest of GCC and North Africa
GCC/MENA Water and Gas Valves Market Segmentation By Geography
- 1. Saudi Arabia
- 2. United Arab Emirates
- 3. Qatar
- 4. Algeria
- 5. Egypt
- 6. Iran
- 7. Iraq
- 8. Rest of GCC and North Africa
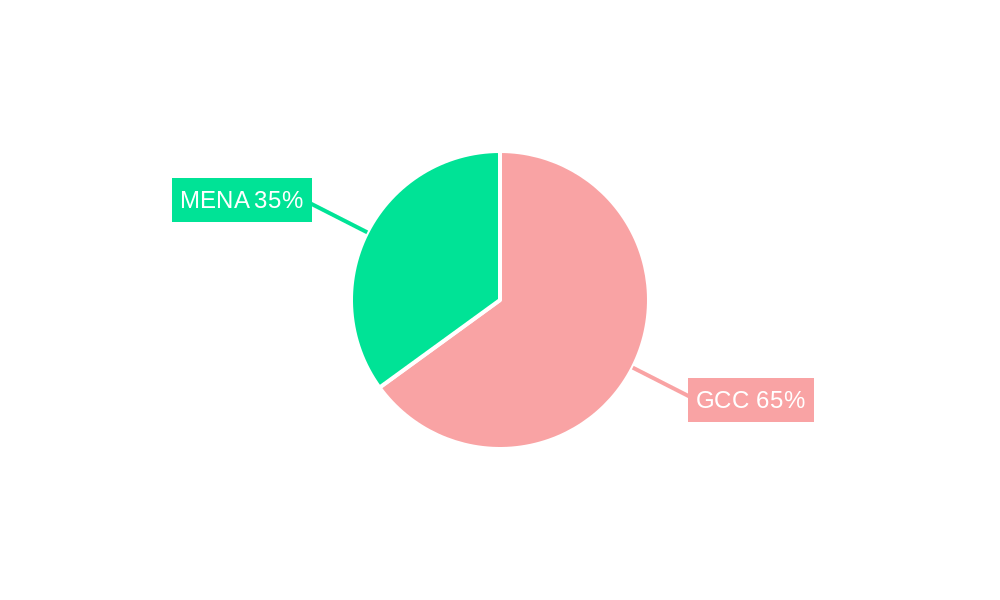
GCC/MENA Water and Gas Valves Market Regional Market Share
Geographic Coverage of GCC/MENA Water and Gas Valves Market
GCC/MENA Water and Gas Valves Market REPORT HIGHLIGHTS
| Aspects | Details |
|---|---|
| Study Period | 2020-2034 |
| Base Year | 2025 |
| Estimated Year | 2026 |
| Forecast Period | 2026-2034 |
| Historical Period | 2020-2025 |
| Growth Rate | CAGR of 5.12% from 2020-2034 |
| Segmentation |
|
Table of Contents
- 1. Introduction
- 1.1. Research Scope
- 1.2. Market Segmentation
- 1.3. Research Objective
- 1.4. Definitions and Assumptions
- 2. Executive Summary
- 2.1. Market Snapshot
- 3. Market Dynamics
- 3.1. Market Drivers
- 3.2. Market Restrains
- 3.3. Market Trends
- 3.4. Market Opportunities
- 4. Market Factor Analysis
- 4.1. Porters Five Forces
- 4.1.1. Bargaining Power of Suppliers
- 4.1.2. Bargaining Power of Buyers
- 4.1.3. Threat of New Entrants
- 4.1.4. Threat of Substitutes
- 4.1.5. Competitive Rivalry
- 4.2. PESTEL analysis
- 4.3. BCG Analysis
- 4.3.1. Stars (High Growth, High Market Share)
- 4.3.2. Cash Cows (Low Growth, High Market Share)
- 4.3.3. Question Mark (High Growth, Low Market Share)
- 4.3.4. Dogs (Low Growth, Low Market Share)
- 4.4. Ansoff Matrix Analysis
- 4.5. Supply Chain Analysis
- 4.6. Regulatory Landscape
- 4.7. Current Market Potential and Opportunity Assessment (TAM–SAM–SOM Framework)
- 4.8. PRI Analyst Note
- 4.1. Porters Five Forces
- 5. Market Analysis, Insights and Forecast 2021-2033
- 5.1. Market Analysis, Insights and Forecast - by Type
- 5.1.1. Butterfly Valve
- 5.1.2. Ball Valve
- 5.1.3. Globe Valve
- 5.1.4. Gate Valve
- 5.1.5. Plug Valve
- 5.1.6. Other Types
- 5.2. Market Analysis, Insights and Forecast - by Application
- 5.2.1. Industrial
- 5.2.2. Municipal
- 5.3. Market Analysis, Insights and Forecast - by Geography
- 5.3.1. Saudi Arabia
- 5.3.2. United Arab Emirates
- 5.3.3. Qatar
- 5.3.4. Algeria
- 5.3.5. Egypt
- 5.3.6. Iran
- 5.3.7. Iraq
- 5.3.8. Rest of GCC and North Africa
- 5.4. Market Analysis, Insights and Forecast - by Region
- 5.4.1. Saudi Arabia
- 5.4.2. United Arab Emirates
- 5.4.3. Qatar
- 5.4.4. Algeria
- 5.4.5. Egypt
- 5.4.6. Iran
- 5.4.7. Iraq
- 5.4.8. Rest of GCC and North Africa
- 5.1. Market Analysis, Insights and Forecast - by Type
- 6. Global GCC/MENA Water and Gas Valves Market Analysis, Insights and Forecast, 2021-2033
- 6.1. Market Analysis, Insights and Forecast - by Type
- 6.1.1. Butterfly Valve
- 6.1.2. Ball Valve
- 6.1.3. Globe Valve
- 6.1.4. Gate Valve
- 6.1.5. Plug Valve
- 6.1.6. Other Types
- 6.2. Market Analysis, Insights and Forecast - by Application
- 6.2.1. Industrial
- 6.2.2. Municipal
- 6.3. Market Analysis, Insights and Forecast - by Geography
- 6.3.1. Saudi Arabia
- 6.3.2. United Arab Emirates
- 6.3.3. Qatar
- 6.3.4. Algeria
- 6.3.5. Egypt
- 6.3.6. Iran
- 6.3.7. Iraq
- 6.3.8. Rest of GCC and North Africa
- 6.1. Market Analysis, Insights and Forecast - by Type
- 7. Saudi Arabia GCC/MENA Water and Gas Valves Market Analysis, Insights and Forecast, 2020-2032
- 7.1. Market Analysis, Insights and Forecast - by Type
- 7.1.1. Butterfly Valve
- 7.1.2. Ball Valve
- 7.1.3. Globe Valve
- 7.1.4. Gate Valve
- 7.1.5. Plug Valve
- 7.1.6. Other Types
- 7.2. Market Analysis, Insights and Forecast - by Application
- 7.2.1. Industrial
- 7.2.2. Municipal
- 7.3. Market Analysis, Insights and Forecast - by Geography
- 7.3.1. Saudi Arabia
- 7.3.2. United Arab Emirates
- 7.3.3. Qatar
- 7.3.4. Algeria
- 7.3.5. Egypt
- 7.3.6. Iran
- 7.3.7. Iraq
- 7.3.8. Rest of GCC and North Africa
- 7.1. Market Analysis, Insights and Forecast - by Type
- 8. United Arab Emirates GCC/MENA Water and Gas Valves Market Analysis, Insights and Forecast, 2020-2032
- 8.1. Market Analysis, Insights and Forecast - by Type
- 8.1.1. Butterfly Valve
- 8.1.2. Ball Valve
- 8.1.3. Globe Valve
- 8.1.4. Gate Valve
- 8.1.5. Plug Valve
- 8.1.6. Other Types
- 8.2. Market Analysis, Insights and Forecast - by Application
- 8.2.1. Industrial
- 8.2.2. Municipal
- 8.3. Market Analysis, Insights and Forecast - by Geography
- 8.3.1. Saudi Arabia
- 8.3.2. United Arab Emirates
- 8.3.3. Qatar
- 8.3.4. Algeria
- 8.3.5. Egypt
- 8.3.6. Iran
- 8.3.7. Iraq
- 8.3.8. Rest of GCC and North Africa
- 8.1. Market Analysis, Insights and Forecast - by Type
- 9. Qatar GCC/MENA Water and Gas Valves Market Analysis, Insights and Forecast, 2020-2032
- 9.1. Market Analysis, Insights and Forecast - by Type
- 9.1.1. Butterfly Valve
- 9.1.2. Ball Valve
- 9.1.3. Globe Valve
- 9.1.4. Gate Valve
- 9.1.5. Plug Valve
- 9.1.6. Other Types
- 9.2. Market Analysis, Insights and Forecast - by Application
- 9.2.1. Industrial
- 9.2.2. Municipal
- 9.3. Market Analysis, Insights and Forecast - by Geography
- 9.3.1. Saudi Arabia
- 9.3.2. United Arab Emirates
- 9.3.3. Qatar
- 9.3.4. Algeria
- 9.3.5. Egypt
- 9.3.6. Iran
- 9.3.7. Iraq
- 9.3.8. Rest of GCC and North Africa
- 9.1. Market Analysis, Insights and Forecast - by Type
- 10. Algeria GCC/MENA Water and Gas Valves Market Analysis, Insights and Forecast, 2020-2032
- 10.1. Market Analysis, Insights and Forecast - by Type
- 10.1.1. Butterfly Valve
- 10.1.2. Ball Valve
- 10.1.3. Globe Valve
- 10.1.4. Gate Valve
- 10.1.5. Plug Valve
- 10.1.6. Other Types
- 10.2. Market Analysis, Insights and Forecast - by Application
- 10.2.1. Industrial
- 10.2.2. Municipal
- 10.3. Market Analysis, Insights and Forecast - by Geography
- 10.3.1. Saudi Arabia
- 10.3.2. United Arab Emirates
- 10.3.3. Qatar
- 10.3.4. Algeria
- 10.3.5. Egypt
- 10.3.6. Iran
- 10.3.7. Iraq
- 10.3.8. Rest of GCC and North Africa
- 10.1. Market Analysis, Insights and Forecast - by Type
- 11. Egypt GCC/MENA Water and Gas Valves Market Analysis, Insights and Forecast, 2020-2032
- 11.1. Market Analysis, Insights and Forecast - by Type
- 11.1.1. Butterfly Valve
- 11.1.2. Ball Valve
- 11.1.3. Globe Valve
- 11.1.4. Gate Valve
- 11.1.5. Plug Valve
- 11.1.6. Other Types
- 11.2. Market Analysis, Insights and Forecast - by Application
- 11.2.1. Industrial
- 11.2.2. Municipal
- 11.3. Market Analysis, Insights and Forecast - by Geography
- 11.3.1. Saudi Arabia
- 11.3.2. United Arab Emirates
- 11.3.3. Qatar
- 11.3.4. Algeria
- 11.3.5. Egypt
- 11.3.6. Iran
- 11.3.7. Iraq
- 11.3.8. Rest of GCC and North Africa
- 11.1. Market Analysis, Insights and Forecast - by Type
- 12. Iran GCC/MENA Water and Gas Valves Market Analysis, Insights and Forecast, 2020-2032
- 12.1. Market Analysis, Insights and Forecast - by Type
- 12.1.1. Butterfly Valve
- 12.1.2. Ball Valve
- 12.1.3. Globe Valve
- 12.1.4. Gate Valve
- 12.1.5. Plug Valve
- 12.1.6. Other Types
- 12.2. Market Analysis, Insights and Forecast - by Application
- 12.2.1. Industrial
- 12.2.2. Municipal
- 12.3. Market Analysis, Insights and Forecast - by Geography
- 12.3.1. Saudi Arabia
- 12.3.2. United Arab Emirates
- 12.3.3. Qatar
- 12.3.4. Algeria
- 12.3.5. Egypt
- 12.3.6. Iran
- 12.3.7. Iraq
- 12.3.8. Rest of GCC and North Africa
- 12.1. Market Analysis, Insights and Forecast - by Type
- 13. Iraq GCC/MENA Water and Gas Valves Market Analysis, Insights and Forecast, 2020-2032
- 13.1. Market Analysis, Insights and Forecast - by Type
- 13.1.1. Butterfly Valve
- 13.1.2. Ball Valve
- 13.1.3. Globe Valve
- 13.1.4. Gate Valve
- 13.1.5. Plug Valve
- 13.1.6. Other Types
- 13.2. Market Analysis, Insights and Forecast - by Application
- 13.2.1. Industrial
- 13.2.2. Municipal
- 13.3. Market Analysis, Insights and Forecast - by Geography
- 13.3.1. Saudi Arabia
- 13.3.2. United Arab Emirates
- 13.3.3. Qatar
- 13.3.4. Algeria
- 13.3.5. Egypt
- 13.3.6. Iran
- 13.3.7. Iraq
- 13.3.8. Rest of GCC and North Africa
- 13.1. Market Analysis, Insights and Forecast - by Type
- 14. Rest of GCC and North Africa GCC/MENA Water and Gas Valves Market Analysis, Insights and Forecast, 2020-2032
- 14.1. Market Analysis, Insights and Forecast - by Type
- 14.1.1. Butterfly Valve
- 14.1.2. Ball Valve
- 14.1.3. Globe Valve
- 14.1.4. Gate Valve
- 14.1.5. Plug Valve
- 14.1.6. Other Types
- 14.2. Market Analysis, Insights and Forecast - by Application
- 14.2.1. Industrial
- 14.2.2. Municipal
- 14.3. Market Analysis, Insights and Forecast - by Geography
- 14.3.1. Saudi Arabia
- 14.3.2. United Arab Emirates
- 14.3.3. Qatar
- 14.3.4. Algeria
- 14.3.5. Egypt
- 14.3.6. Iran
- 14.3.7. Iraq
- 14.3.8. Rest of GCC and North Africa
- 14.1. Market Analysis, Insights and Forecast - by Type
- 15. Competitive Analysis
- 15.1. Company Profiles
- 15.1.1 Honeywell International Inc
- 15.1.1.1. Company Overview
- 15.1.1.2. Products
- 15.1.1.3. Company Financials
- 15.1.1.4. SWOT Analysis
- 15.1.2 Danfoss AS
- 15.1.2.1. Company Overview
- 15.1.2.2. Products
- 15.1.2.3. Company Financials
- 15.1.2.4. SWOT Analysis
- 15.1.3 Baker Hughes a GE Company
- 15.1.3.1. Company Overview
- 15.1.3.2. Products
- 15.1.3.3. Company Financials
- 15.1.3.4. SWOT Analysis
- 15.1.4 Saint-Gobain
- 15.1.4.1. Company Overview
- 15.1.4.2. Products
- 15.1.4.3. Company Financials
- 15.1.4.4. SWOT Analysis
- 15.1.5 The Weir Group PLC
- 15.1.5.1. Company Overview
- 15.1.5.2. Products
- 15.1.5.3. Company Financials
- 15.1.5.4. SWOT Analysis
- 15.1.6 Flowserve Corporation
- 15.1.6.1. Company Overview
- 15.1.6.2. Products
- 15.1.6.3. Company Financials
- 15.1.6.4. SWOT Analysis
- 15.1.7 Georg Fischer Ltd
- 15.1.7.1. Company Overview
- 15.1.7.2. Products
- 15.1.7.3. Company Financials
- 15.1.7.4. SWOT Analysis
- 15.1.8 Emerson Electric Co
- 15.1.8.1. Company Overview
- 15.1.8.2. Products
- 15.1.8.3. Company Financials
- 15.1.8.4. SWOT Analysis
- 15.1.9 IMI Critical Engineering
- 15.1.9.1. Company Overview
- 15.1.9.2. Products
- 15.1.9.3. Company Financials
- 15.1.9.4. SWOT Analysis
- 15.1.10 Crane Co
- 15.1.10.1. Company Overview
- 15.1.10.2. Products
- 15.1.10.3. Company Financials
- 15.1.10.4. SWOT Analysis
- 15.1.11 AVK Gulf And Watecom International Water Network LLC
- 15.1.11.1. Company Overview
- 15.1.11.2. Products
- 15.1.11.3. Company Financials
- 15.1.11.4. SWOT Analysis
- 15.1.12 Schlumberger Limited
- 15.1.12.1. Company Overview
- 15.1.12.2. Products
- 15.1.12.3. Company Financials
- 15.1.12.4. SWOT Analysis
- 15.1.13 TechnipFMC PLC
- 15.1.13.1. Company Overview
- 15.1.13.2. Products
- 15.1.13.3. Company Financials
- 15.1.13.4. SWOT Analysis
- 15.1.14 Alfa Laval AB
- 15.1.14.1. Company Overview
- 15.1.14.2. Products
- 15.1.14.3. Company Financials
- 15.1.14.4. SWOT Analysis
- 15.1.15 Circor International Inc
- 15.1.15.1. Company Overview
- 15.1.15.2. Products
- 15.1.15.3. Company Financials
- 15.1.15.4. SWOT Analysis
- 15.1.1 Honeywell International Inc
- 15.2. Market Entropy
- 15.2.1 Company's Key Areas Served
- 15.2.2 Recent Developments
- 15.3. Company Market Share Analysis 2025
- 15.3.1 Top 5 Companies Market Share Analysis
- 15.3.2 Top 3 Companies Market Share Analysis
- 15.4. List of Potential Customers
- 16. Research Methodology
List of Figures
- Figure 1: Global GCC/MENA Water and Gas Valves Market Revenue Breakdown (billion, %) by Region 2025 & 2033
- Figure 2: Global GCC/MENA Water and Gas Valves Market Volume Breakdown (K Units, %) by Region 2025 & 2033
- Figure 3: Saudi Arabia GCC/MENA Water and Gas Valves Market Revenue (billion), by Type 2025 & 2033
- Figure 4: Saudi Arabia GCC/MENA Water and Gas Valves Market Volume (K Units), by Type 2025 & 2033
- Figure 5: Saudi Arabia GCC/MENA Water and Gas Valves Market Revenue Share (%), by Type 2025 & 2033
- Figure 6: Saudi Arabia GCC/MENA Water and Gas Valves Market Volume Share (%), by Type 2025 & 2033
- Figure 7: Saudi Arabia GCC/MENA Water and Gas Valves Market Revenue (billion), by Application 2025 & 2033
- Figure 8: Saudi Arabia GCC/MENA Water and Gas Valves Market Volume (K Units), by Application 2025 & 2033
- Figure 9: Saudi Arabia GCC/MENA Water and Gas Valves Market Revenue Share (%), by Application 2025 & 2033
- Figure 10: Saudi Arabia GCC/MENA Water and Gas Valves Market Volume Share (%), by Application 2025 & 2033
- Figure 11: Saudi Arabia GCC/MENA Water and Gas Valves Market Revenue (billion), by Geography 2025 & 2033
- Figure 12: Saudi Arabia GCC/MENA Water and Gas Valves Market Volume (K Units), by Geography 2025 & 2033
- Figure 13: Saudi Arabia GCC/MENA Water and Gas Valves Market Revenue Share (%), by Geography 2025 & 2033
- Figure 14: Saudi Arabia GCC/MENA Water and Gas Valves Market Volume Share (%), by Geography 2025 & 2033
- Figure 15: Saudi Arabia GCC/MENA Water and Gas Valves Market Revenue (billion), by Country 2025 & 2033
- Figure 16: Saudi Arabia GCC/MENA Water and Gas Valves Market Volume (K Units), by Country 2025 & 2033
- Figure 17: Saudi Arabia GCC/MENA Water and Gas Valves Market Revenue Share (%), by Country 2025 & 2033
- Figure 18: Saudi Arabia GCC/MENA Water and Gas Valves Market Volume Share (%), by Country 2025 & 2033
- Figure 19: United Arab Emirates GCC/MENA Water and Gas Valves Market Revenue (billion), by Type 2025 & 2033
- Figure 20: United Arab Emirates GCC/MENA Water and Gas Valves Market Volume (K Units), by Type 2025 & 2033
- Figure 21: United Arab Emirates GCC/MENA Water and Gas Valves Market Revenue Share (%), by Type 2025 & 2033
- Figure 22: United Arab Emirates GCC/MENA Water and Gas Valves Market Volume Share (%), by Type 2025 & 2033
- Figure 23: United Arab Emirates GCC/MENA Water and Gas Valves Market Revenue (billion), by Application 2025 & 2033
- Figure 24: United Arab Emirates GCC/MENA Water and Gas Valves Market Volume (K Units), by Application 2025 & 2033
- Figure 25: United Arab Emirates GCC/MENA Water and Gas Valves Market Revenue Share (%), by Application 2025 & 2033
- Figure 26: United Arab Emirates GCC/MENA Water and Gas Valves Market Volume Share (%), by Application 2025 & 2033
- Figure 27: United Arab Emirates GCC/MENA Water and Gas Valves Market Revenue (billion), by Geography 2025 & 2033
- Figure 28: United Arab Emirates GCC/MENA Water and Gas Valves Market Volume (K Units), by Geography 2025 & 2033
- Figure 29: United Arab Emirates GCC/MENA Water and Gas Valves Market Revenue Share (%), by Geography 2025 & 2033
- Figure 30: United Arab Emirates GCC/MENA Water and Gas Valves Market Volume Share (%), by Geography 2025 & 2033
- Figure 31: United Arab Emirates GCC/MENA Water and Gas Valves Market Revenue (billion), by Country 2025 & 2033
- Figure 32: United Arab Emirates GCC/MENA Water and Gas Valves Market Volume (K Units), by Country 2025 & 2033
- Figure 33: United Arab Emirates GCC/MENA Water and Gas Valves Market Revenue Share (%), by Country 2025 & 2033
- Figure 34: United Arab Emirates GCC/MENA Water and Gas Valves Market Volume Share (%), by Country 2025 & 2033
- Figure 35: Qatar GCC/MENA Water and Gas Valves Market Revenue (billion), by Type 2025 & 2033
- Figure 36: Qatar GCC/MENA Water and Gas Valves Market Volume (K Units), by Type 2025 & 2033
- Figure 37: Qatar GCC/MENA Water and Gas Valves Market Revenue Share (%), by Type 2025 & 2033
- Figure 38: Qatar GCC/MENA Water and Gas Valves Market Volume Share (%), by Type 2025 & 2033
- Figure 39: Qatar GCC/MENA Water and Gas Valves Market Revenue (billion), by Application 2025 & 2033
- Figure 40: Qatar GCC/MENA Water and Gas Valves Market Volume (K Units), by Application 2025 & 2033
- Figure 41: Qatar GCC/MENA Water and Gas Valves Market Revenue Share (%), by Application 2025 & 2033
- Figure 42: Qatar GCC/MENA Water and Gas Valves Market Volume Share (%), by Application 2025 & 2033
- Figure 43: Qatar GCC/MENA Water and Gas Valves Market Revenue (billion), by Geography 2025 & 2033
- Figure 44: Qatar GCC/MENA Water and Gas Valves Market Volume (K Units), by Geography 2025 & 2033
- Figure 45: Qatar GCC/MENA Water and Gas Valves Market Revenue Share (%), by Geography 2025 & 2033
- Figure 46: Qatar GCC/MENA Water and Gas Valves Market Volume Share (%), by Geography 2025 & 2033
- Figure 47: Qatar GCC/MENA Water and Gas Valves Market Revenue (billion), by Country 2025 & 2033
- Figure 48: Qatar GCC/MENA Water and Gas Valves Market Volume (K Units), by Country 2025 & 2033
- Figure 49: Qatar GCC/MENA Water and Gas Valves Market Revenue Share (%), by Country 2025 & 2033
- Figure 50: Qatar GCC/MENA Water and Gas Valves Market Volume Share (%), by Country 2025 & 2033
- Figure 51: Algeria GCC/MENA Water and Gas Valves Market Revenue (billion), by Type 2025 & 2033
- Figure 52: Algeria GCC/MENA Water and Gas Valves Market Volume (K Units), by Type 2025 & 2033
- Figure 53: Algeria GCC/MENA Water and Gas Valves Market Revenue Share (%), by Type 2025 & 2033
- Figure 54: Algeria GCC/MENA Water and Gas Valves Market Volume Share (%), by Type 2025 & 2033
- Figure 55: Algeria GCC/MENA Water and Gas Valves Market Revenue (billion), by Application 2025 & 2033
- Figure 56: Algeria GCC/MENA Water and Gas Valves Market Volume (K Units), by Application 2025 & 2033
- Figure 57: Algeria GCC/MENA Water and Gas Valves Market Revenue Share (%), by Application 2025 & 2033
- Figure 58: Algeria GCC/MENA Water and Gas Valves Market Volume Share (%), by Application 2025 & 2033
- Figure 59: Algeria GCC/MENA Water and Gas Valves Market Revenue (billion), by Geography 2025 & 2033
- Figure 60: Algeria GCC/MENA Water and Gas Valves Market Volume (K Units), by Geography 2025 & 2033
- Figure 61: Algeria GCC/MENA Water and Gas Valves Market Revenue Share (%), by Geography 2025 & 2033
- Figure 62: Algeria GCC/MENA Water and Gas Valves Market Volume Share (%), by Geography 2025 & 2033
- Figure 63: Algeria GCC/MENA Water and Gas Valves Market Revenue (billion), by Country 2025 & 2033
- Figure 64: Algeria GCC/MENA Water and Gas Valves Market Volume (K Units), by Country 2025 & 2033
- Figure 65: Algeria GCC/MENA Water and Gas Valves Market Revenue Share (%), by Country 2025 & 2033
- Figure 66: Algeria GCC/MENA Water and Gas Valves Market Volume Share (%), by Country 2025 & 2033
- Figure 67: Egypt GCC/MENA Water and Gas Valves Market Revenue (billion), by Type 2025 & 2033
- Figure 68: Egypt GCC/MENA Water and Gas Valves Market Volume (K Units), by Type 2025 & 2033
- Figure 69: Egypt GCC/MENA Water and Gas Valves Market Revenue Share (%), by Type 2025 & 2033
- Figure 70: Egypt GCC/MENA Water and Gas Valves Market Volume Share (%), by Type 2025 & 2033
- Figure 71: Egypt GCC/MENA Water and Gas Valves Market Revenue (billion), by Application 2025 & 2033
- Figure 72: Egypt GCC/MENA Water and Gas Valves Market Volume (K Units), by Application 2025 & 2033
- Figure 73: Egypt GCC/MENA Water and Gas Valves Market Revenue Share (%), by Application 2025 & 2033
- Figure 74: Egypt GCC/MENA Water and Gas Valves Market Volume Share (%), by Application 2025 & 2033
- Figure 75: Egypt GCC/MENA Water and Gas Valves Market Revenue (billion), by Geography 2025 & 2033
- Figure 76: Egypt GCC/MENA Water and Gas Valves Market Volume (K Units), by Geography 2025 & 2033
- Figure 77: Egypt GCC/MENA Water and Gas Valves Market Revenue Share (%), by Geography 2025 & 2033
- Figure 78: Egypt GCC/MENA Water and Gas Valves Market Volume Share (%), by Geography 2025 & 2033
- Figure 79: Egypt GCC/MENA Water and Gas Valves Market Revenue (billion), by Country 2025 & 2033
- Figure 80: Egypt GCC/MENA Water and Gas Valves Market Volume (K Units), by Country 2025 & 2033
- Figure 81: Egypt GCC/MENA Water and Gas Valves Market Revenue Share (%), by Country 2025 & 2033
- Figure 82: Egypt GCC/MENA Water and Gas Valves Market Volume Share (%), by Country 2025 & 2033
- Figure 83: Iran GCC/MENA Water and Gas Valves Market Revenue (billion), by Type 2025 & 2033
- Figure 84: Iran GCC/MENA Water and Gas Valves Market Volume (K Units), by Type 2025 & 2033
- Figure 85: Iran GCC/MENA Water and Gas Valves Market Revenue Share (%), by Type 2025 & 2033
- Figure 86: Iran GCC/MENA Water and Gas Valves Market Volume Share (%), by Type 2025 & 2033
- Figure 87: Iran GCC/MENA Water and Gas Valves Market Revenue (billion), by Application 2025 & 2033
- Figure 88: Iran GCC/MENA Water and Gas Valves Market Volume (K Units), by Application 2025 & 2033
- Figure 89: Iran GCC/MENA Water and Gas Valves Market Revenue Share (%), by Application 2025 & 2033
- Figure 90: Iran GCC/MENA Water and Gas Valves Market Volume Share (%), by Application 2025 & 2033
- Figure 91: Iran GCC/MENA Water and Gas Valves Market Revenue (billion), by Geography 2025 & 2033
- Figure 92: Iran GCC/MENA Water and Gas Valves Market Volume (K Units), by Geography 2025 & 2033
- Figure 93: Iran GCC/MENA Water and Gas Valves Market Revenue Share (%), by Geography 2025 & 2033
- Figure 94: Iran GCC/MENA Water and Gas Valves Market Volume Share (%), by Geography 2025 & 2033
- Figure 95: Iran GCC/MENA Water and Gas Valves Market Revenue (billion), by Country 2025 & 2033
- Figure 96: Iran GCC/MENA Water and Gas Valves Market Volume (K Units), by Country 2025 & 2033
- Figure 97: Iran GCC/MENA Water and Gas Valves Market Revenue Share (%), by Country 2025 & 2033
- Figure 98: Iran GCC/MENA Water and Gas Valves Market Volume Share (%), by Country 2025 & 2033
- Figure 99: Iraq GCC/MENA Water and Gas Valves Market Revenue (billion), by Type 2025 & 2033
- Figure 100: Iraq GCC/MENA Water and Gas Valves Market Volume (K Units), by Type 2025 & 2033
- Figure 101: Iraq GCC/MENA Water and Gas Valves Market Revenue Share (%), by Type 2025 & 2033
- Figure 102: Iraq GCC/MENA Water and Gas Valves Market Volume Share (%), by Type 2025 & 2033
- Figure 103: Iraq GCC/MENA Water and Gas Valves Market Revenue (billion), by Application 2025 & 2033
- Figure 104: Iraq GCC/MENA Water and Gas Valves Market Volume (K Units), by Application 2025 & 2033
- Figure 105: Iraq GCC/MENA Water and Gas Valves Market Revenue Share (%), by Application 2025 & 2033
- Figure 106: Iraq GCC/MENA Water and Gas Valves Market Volume Share (%), by Application 2025 & 2033
- Figure 107: Iraq GCC/MENA Water and Gas Valves Market Revenue (billion), by Geography 2025 & 2033
- Figure 108: Iraq GCC/MENA Water and Gas Valves Market Volume (K Units), by Geography 2025 & 2033
- Figure 109: Iraq GCC/MENA Water and Gas Valves Market Revenue Share (%), by Geography 2025 & 2033
- Figure 110: Iraq GCC/MENA Water and Gas Valves Market Volume Share (%), by Geography 2025 & 2033
- Figure 111: Iraq GCC/MENA Water and Gas Valves Market Revenue (billion), by Country 2025 & 2033
- Figure 112: Iraq GCC/MENA Water and Gas Valves Market Volume (K Units), by Country 2025 & 2033
- Figure 113: Iraq GCC/MENA Water and Gas Valves Market Revenue Share (%), by Country 2025 & 2033
- Figure 114: Iraq GCC/MENA Water and Gas Valves Market Volume Share (%), by Country 2025 & 2033
- Figure 115: Rest of GCC and North Africa GCC/MENA Water and Gas Valves Market Revenue (billion), by Type 2025 & 2033
- Figure 116: Rest of GCC and North Africa GCC/MENA Water and Gas Valves Market Volume (K Units), by Type 2025 & 2033
- Figure 117: Rest of GCC and North Africa GCC/MENA Water and Gas Valves Market Revenue Share (%), by Type 2025 & 2033
- Figure 118: Rest of GCC and North Africa GCC/MENA Water and Gas Valves Market Volume Share (%), by Type 2025 & 2033
- Figure 119: Rest of GCC and North Africa GCC/MENA Water and Gas Valves Market Revenue (billion), by Application 2025 & 2033
- Figure 120: Rest of GCC and North Africa GCC/MENA Water and Gas Valves Market Volume (K Units), by Application 2025 & 2033
- Figure 121: Rest of GCC and North Africa GCC/MENA Water and Gas Valves Market Revenue Share (%), by Application 2025 & 2033
- Figure 122: Rest of GCC and North Africa GCC/MENA Water and Gas Valves Market Volume Share (%), by Application 2025 & 2033
- Figure 123: Rest of GCC and North Africa GCC/MENA Water and Gas Valves Market Revenue (billion), by Geography 2025 & 2033
- Figure 124: Rest of GCC and North Africa GCC/MENA Water and Gas Valves Market Volume (K Units), by Geography 2025 & 2033
- Figure 125: Rest of GCC and North Africa GCC/MENA Water and Gas Valves Market Revenue Share (%), by Geography 2025 & 2033
- Figure 126: Rest of GCC and North Africa GCC/MENA Water and Gas Valves Market Volume Share (%), by Geography 2025 & 2033
- Figure 127: Rest of GCC and North Africa GCC/MENA Water and Gas Valves Market Revenue (billion), by Country 2025 & 2033
- Figure 128: Rest of GCC and North Africa GCC/MENA Water and Gas Valves Market Volume (K Units), by Country 2025 & 2033
- Figure 129: Rest of GCC and North Africa GCC/MENA Water and Gas Valves Market Revenue Share (%), by Country 2025 & 2033
- Figure 130: Rest of GCC and North Africa GCC/MENA Water and Gas Valves Market Volume Share (%), by Country 2025 & 2033
List of Tables
- Table 1: Global GCC/MENA Water and Gas Valves Market Revenue billion Forecast, by Type 2020 & 2033
- Table 2: Global GCC/MENA Water and Gas Valves Market Volume K Units Forecast, by Type 2020 & 2033
- Table 3: Global GCC/MENA Water and Gas Valves Market Revenue billion Forecast, by Application 2020 & 2033
- Table 4: Global GCC/MENA Water and Gas Valves Market Volume K Units Forecast, by Application 2020 & 2033
- Table 5: Global GCC/MENA Water and Gas Valves Market Revenue billion Forecast, by Geography 2020 & 2033
- Table 6: Global GCC/MENA Water and Gas Valves Market Volume K Units Forecast, by Geography 2020 & 2033
- Table 7: Global GCC/MENA Water and Gas Valves Market Revenue billion Forecast, by Region 2020 & 2033
- Table 8: Global GCC/MENA Water and Gas Valves Market Volume K Units Forecast, by Region 2020 & 2033
- Table 9: Global GCC/MENA Water and Gas Valves Market Revenue billion Forecast, by Type 2020 & 2033
- Table 10: Global GCC/MENA Water and Gas Valves Market Volume K Units Forecast, by Type 2020 & 2033
- Table 11: Global GCC/MENA Water and Gas Valves Market Revenue billion Forecast, by Application 2020 & 2033
- Table 12: Global GCC/MENA Water and Gas Valves Market Volume K Units Forecast, by Application 2020 & 2033
- Table 13: Global GCC/MENA Water and Gas Valves Market Revenue billion Forecast, by Geography 2020 & 2033
- Table 14: Global GCC/MENA Water and Gas Valves Market Volume K Units Forecast, by Geography 2020 & 2033
- Table 15: Global GCC/MENA Water and Gas Valves Market Revenue billion Forecast, by Country 2020 & 2033
- Table 16: Global GCC/MENA Water and Gas Valves Market Volume K Units Forecast, by Country 2020 & 2033
- Table 17: Global GCC/MENA Water and Gas Valves Market Revenue billion Forecast, by Type 2020 & 2033
- Table 18: Global GCC/MENA Water and Gas Valves Market Volume K Units Forecast, by Type 2020 & 2033
- Table 19: Global GCC/MENA Water and Gas Valves Market Revenue billion Forecast, by Application 2020 & 2033
- Table 20: Global GCC/MENA Water and Gas Valves Market Volume K Units Forecast, by Application 2020 & 2033
- Table 21: Global GCC/MENA Water and Gas Valves Market Revenue billion Forecast, by Geography 2020 & 2033
- Table 22: Global GCC/MENA Water and Gas Valves Market Volume K Units Forecast, by Geography 2020 & 2033
- Table 23: Global GCC/MENA Water and Gas Valves Market Revenue billion Forecast, by Country 2020 & 2033
- Table 24: Global GCC/MENA Water and Gas Valves Market Volume K Units Forecast, by Country 2020 & 2033
- Table 25: Global GCC/MENA Water and Gas Valves Market Revenue billion Forecast, by Type 2020 & 2033
- Table 26: Global GCC/MENA Water and Gas Valves Market Volume K Units Forecast, by Type 2020 & 2033
- Table 27: Global GCC/MENA Water and Gas Valves Market Revenue billion Forecast, by Application 2020 & 2033
- Table 28: Global GCC/MENA Water and Gas Valves Market Volume K Units Forecast, by Application 2020 & 2033
- Table 29: Global GCC/MENA Water and Gas Valves Market Revenue billion Forecast, by Geography 2020 & 2033
- Table 30: Global GCC/MENA Water and Gas Valves Market Volume K Units Forecast, by Geography 2020 & 2033
- Table 31: Global GCC/MENA Water and Gas Valves Market Revenue billion Forecast, by Country 2020 & 2033
- Table 32: Global GCC/MENA Water and Gas Valves Market Volume K Units Forecast, by Country 2020 & 2033
- Table 33: Global GCC/MENA Water and Gas Valves Market Revenue billion Forecast, by Type 2020 & 2033
- Table 34: Global GCC/MENA Water and Gas Valves Market Volume K Units Forecast, by Type 2020 & 2033
- Table 35: Global GCC/MENA Water and Gas Valves Market Revenue billion Forecast, by Application 2020 & 2033
- Table 36: Global GCC/MENA Water and Gas Valves Market Volume K Units Forecast, by Application 2020 & 2033
- Table 37: Global GCC/MENA Water and Gas Valves Market Revenue billion Forecast, by Geography 2020 & 2033
- Table 38: Global GCC/MENA Water and Gas Valves Market Volume K Units Forecast, by Geography 2020 & 2033
- Table 39: Global GCC/MENA Water and Gas Valves Market Revenue billion Forecast, by Country 2020 & 2033
- Table 40: Global GCC/MENA Water and Gas Valves Market Volume K Units Forecast, by Country 2020 & 2033
- Table 41: Global GCC/MENA Water and Gas Valves Market Revenue billion Forecast, by Type 2020 & 2033
- Table 42: Global GCC/MENA Water and Gas Valves Market Volume K Units Forecast, by Type 2020 & 2033
- Table 43: Global GCC/MENA Water and Gas Valves Market Revenue billion Forecast, by Application 2020 & 2033
- Table 44: Global GCC/MENA Water and Gas Valves Market Volume K Units Forecast, by Application 2020 & 2033
- Table 45: Global GCC/MENA Water and Gas Valves Market Revenue billion Forecast, by Geography 2020 & 2033
- Table 46: Global GCC/MENA Water and Gas Valves Market Volume K Units Forecast, by Geography 2020 & 2033
- Table 47: Global GCC/MENA Water and Gas Valves Market Revenue billion Forecast, by Country 2020 & 2033
- Table 48: Global GCC/MENA Water and Gas Valves Market Volume K Units Forecast, by Country 2020 & 2033
- Table 49: Global GCC/MENA Water and Gas Valves Market Revenue billion Forecast, by Type 2020 & 2033
- Table 50: Global GCC/MENA Water and Gas Valves Market Volume K Units Forecast, by Type 2020 & 2033
- Table 51: Global GCC/MENA Water and Gas Valves Market Revenue billion Forecast, by Application 2020 & 2033
- Table 52: Global GCC/MENA Water and Gas Valves Market Volume K Units Forecast, by Application 2020 & 2033
- Table 53: Global GCC/MENA Water and Gas Valves Market Revenue billion Forecast, by Geography 2020 & 2033
- Table 54: Global GCC/MENA Water and Gas Valves Market Volume K Units Forecast, by Geography 2020 & 2033
- Table 55: Global GCC/MENA Water and Gas Valves Market Revenue billion Forecast, by Country 2020 & 2033
- Table 56: Global GCC/MENA Water and Gas Valves Market Volume K Units Forecast, by Country 2020 & 2033
- Table 57: Global GCC/MENA Water and Gas Valves Market Revenue billion Forecast, by Type 2020 & 2033
- Table 58: Global GCC/MENA Water and Gas Valves Market Volume K Units Forecast, by Type 2020 & 2033
- Table 59: Global GCC/MENA Water and Gas Valves Market Revenue billion Forecast, by Application 2020 & 2033
- Table 60: Global GCC/MENA Water and Gas Valves Market Volume K Units Forecast, by Application 2020 & 2033
- Table 61: Global GCC/MENA Water and Gas Valves Market Revenue billion Forecast, by Geography 2020 & 2033
- Table 62: Global GCC/MENA Water and Gas Valves Market Volume K Units Forecast, by Geography 2020 & 2033
- Table 63: Global GCC/MENA Water and Gas Valves Market Revenue billion Forecast, by Country 2020 & 2033
- Table 64: Global GCC/MENA Water and Gas Valves Market Volume K Units Forecast, by Country 2020 & 2033
- Table 65: Global GCC/MENA Water and Gas Valves Market Revenue billion Forecast, by Type 2020 & 2033
- Table 66: Global GCC/MENA Water and Gas Valves Market Volume K Units Forecast, by Type 2020 & 2033
- Table 67: Global GCC/MENA Water and Gas Valves Market Revenue billion Forecast, by Application 2020 & 2033
- Table 68: Global GCC/MENA Water and Gas Valves Market Volume K Units Forecast, by Application 2020 & 2033
- Table 69: Global GCC/MENA Water and Gas Valves Market Revenue billion Forecast, by Geography 2020 & 2033
- Table 70: Global GCC/MENA Water and Gas Valves Market Volume K Units Forecast, by Geography 2020 & 2033
- Table 71: Global GCC/MENA Water and Gas Valves Market Revenue billion Forecast, by Country 2020 & 2033
- Table 72: Global GCC/MENA Water and Gas Valves Market Volume K Units Forecast, by Country 2020 & 2033
Frequently Asked Questions
1. What is the projected Compound Annual Growth Rate (CAGR) of the GCC/MENA Water and Gas Valves Market?
The projected CAGR is approximately 5.12%.
2. Which companies are prominent players in the GCC/MENA Water and Gas Valves Market?
Key companies in the market include Honeywell International Inc, Danfoss AS, Baker Hughes a GE Company, Saint-Gobain, The Weir Group PLC, Flowserve Corporation, Georg Fischer Ltd, Emerson Electric Co, IMI Critical Engineering, Crane Co, AVK Gulf And Watecom International Water Network LLC, Schlumberger Limited, TechnipFMC PLC, Alfa Laval AB, Circor International Inc.
3. What are the main segments of the GCC/MENA Water and Gas Valves Market?
The market segments include Type, Application, Geography.
4. Can you provide details about the market size?
The market size is estimated to be USD 11.69 billion as of 2022.
5. What are some drivers contributing to market growth?
Expanding Power Generation Sector in GCC Countries; Surge in Oil Refining in the MEA Region.
6. What are the notable trends driving market growth?
Increasing Demand from Industrial Applications.
7. Are there any restraints impacting market growth?
Health Concerns and Stringent Environmental Regulations; Impact of COVID-19 on the Market Studied.
8. Can you provide examples of recent developments in the market?
N/A
9. What pricing options are available for accessing the report?
Pricing options include single-user, multi-user, and enterprise licenses priced at USD 4750, USD 5250, and USD 8750 respectively.
10. Is the market size provided in terms of value or volume?
The market size is provided in terms of value, measured in billion and volume, measured in K Units.
11. Are there any specific market keywords associated with the report?
Yes, the market keyword associated with the report is "GCC/MENA Water and Gas Valves Market," which aids in identifying and referencing the specific market segment covered.
12. How do I determine which pricing option suits my needs best?
The pricing options vary based on user requirements and access needs. Individual users may opt for single-user licenses, while businesses requiring broader access may choose multi-user or enterprise licenses for cost-effective access to the report.
13. Are there any additional resources or data provided in the GCC/MENA Water and Gas Valves Market report?
While the report offers comprehensive insights, it's advisable to review the specific contents or supplementary materials provided to ascertain if additional resources or data are available.
14. How can I stay updated on further developments or reports in the GCC/MENA Water and Gas Valves Market?
To stay informed about further developments, trends, and reports in the GCC/MENA Water and Gas Valves Market, consider subscribing to industry newsletters, following relevant companies and organizations, or regularly checking reputable industry news sources and publications.
Methodology
Step 1 - Identification of Relevant Samples Size from Population Database


Step 2 - Approaches for Defining Global Market Size (Value, Volume* & Price*)

Note*: In applicable scenarios
Step 3 - Data Sources
Primary Research
- Web Analytics
- Survey Reports
- Research Institute
- Latest Research Reports
- Opinion Leaders
Secondary Research
- Annual Reports
- White Paper
- Latest Press Release
- Industry Association
- Paid Database
- Investor Presentations

Step 4 - Data Triangulation
Involves using different sources of information in order to increase the validity of a study
These sources are likely to be stakeholders in a program - participants, other researchers, program staff, other community members, and so on.
Then we put all data in single framework & apply various statistical tools to find out the dynamic on the market.
During the analysis stage, feedback from the stakeholder groups would be compared to determine areas of agreement as well as areas of divergence