
Key Insights
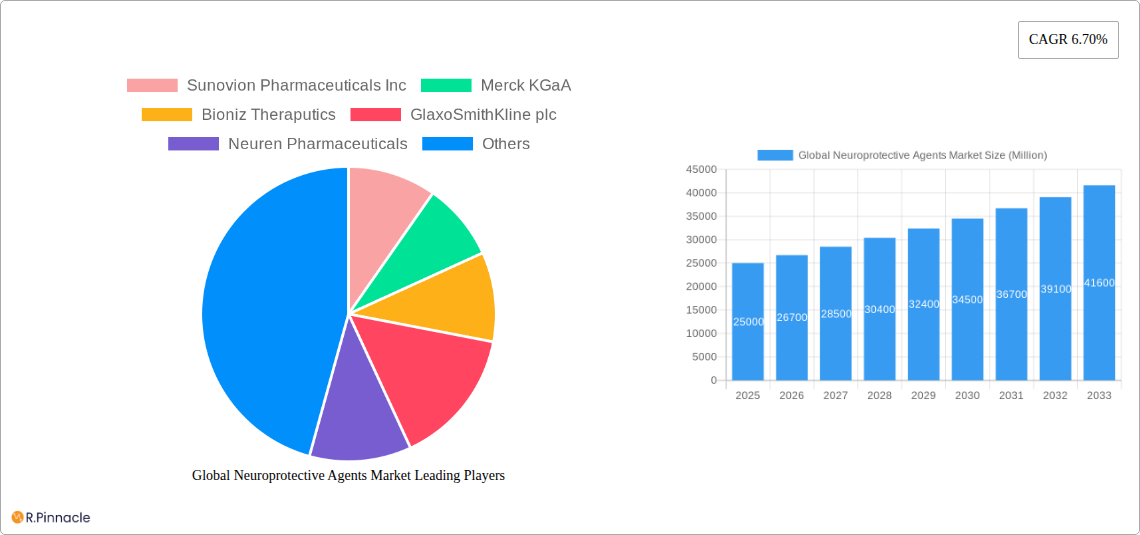
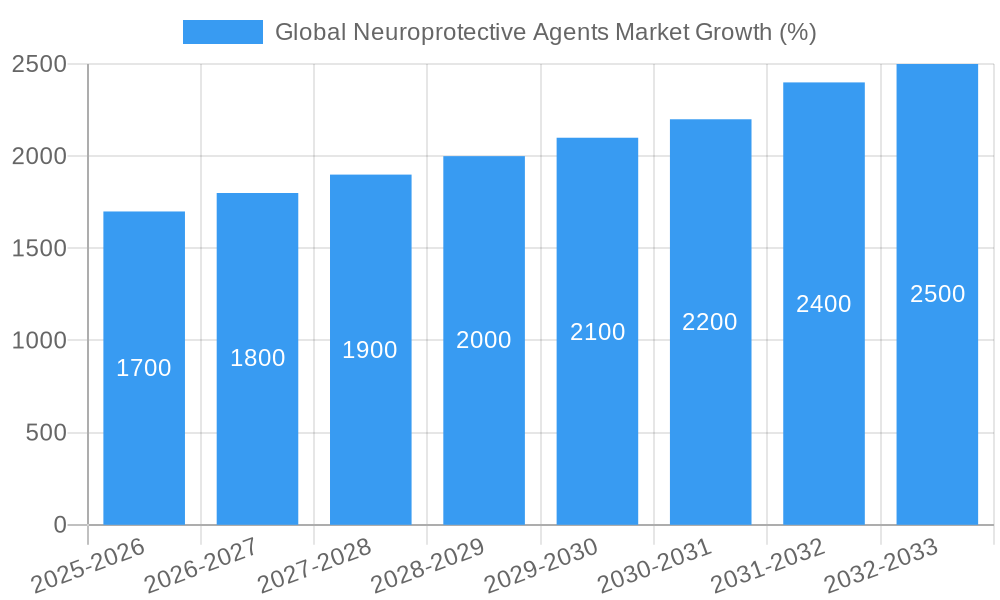
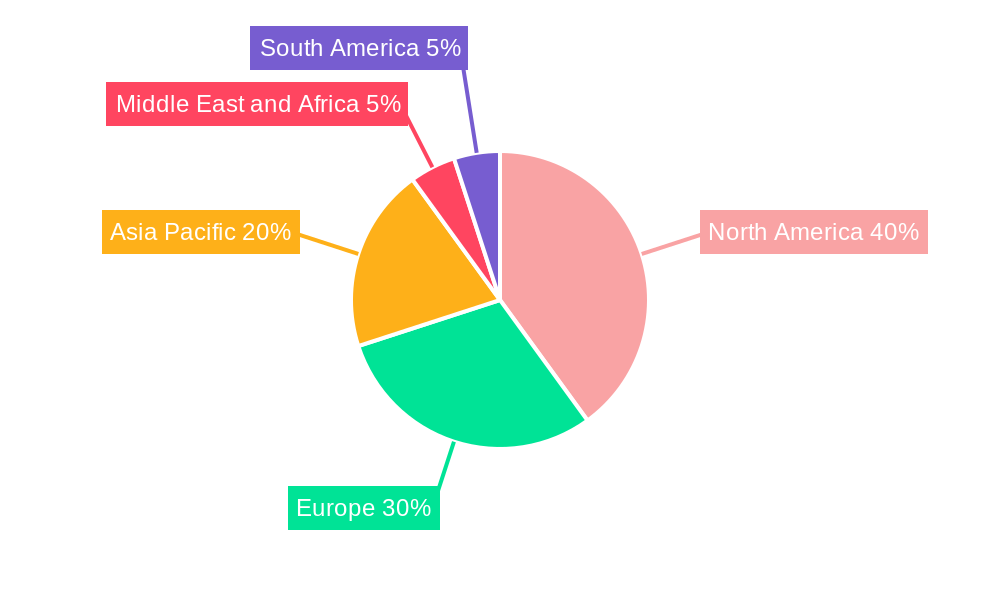
The global neuroprotective agents market is experiencing robust growth, projected to reach a substantial size by 2033, driven by a rising prevalence of neurodegenerative diseases like Alzheimer's and Parkinson's, along with increasing geriatric populations worldwide. A compound annual growth rate (CAGR) of 6.70% from 2019-2033 indicates consistent market expansion. Key market drivers include the ongoing research and development of novel neuroprotective therapies, coupled with improved diagnostic capabilities leading to earlier interventions. The market is segmented by distribution channel (hospital pharmacies, retail pharmacies, online pharmacies), drug class (anesthetics, antagonists, antidepressants, cytokines), application (Alzheimer's, dementia, epilepsy, multiple sclerosis), and route of administration (oral, topical, intravenous). Competition among established pharmaceutical companies like Pfizer, Novartis, and Merck KGaA, alongside emerging biotech firms, is intensifying, fostering innovation and broadening treatment options. However, market restraints include the high cost of developing and manufacturing new neuroprotective agents, along with stringent regulatory hurdles and potential side effects associated with some therapies. The North American market currently holds a significant share, attributed to high healthcare expenditure and advanced healthcare infrastructure. However, rapidly growing economies in Asia-Pacific and increased awareness in other regions are expected to drive significant market expansion in those areas over the forecast period.
The market's future trajectory hinges on several factors. Continued breakthroughs in understanding neurodegenerative disease mechanisms are crucial for developing more effective therapies. Furthermore, successful clinical trials leading to regulatory approvals of new drugs will play a significant role. Increased government funding for research and development initiatives alongside greater public awareness and patient advocacy efforts will also contribute to overall market growth. Finally, the accessibility and affordability of neuroprotective agents will be vital in ensuring widespread availability and treatment for those in need, particularly in low- and middle-income countries. Strategic partnerships between pharmaceutical companies and research institutions are likely to enhance innovation and accelerate the development of next-generation neuroprotective therapies.
Global Neuroprotective Agents Market Report: 2019-2033
This comprehensive report provides a detailed analysis of the global neuroprotective agents market, offering invaluable insights for industry professionals, investors, and researchers. With a study period spanning 2019-2033, a base year of 2025, and a forecast period of 2025-2033, this report offers a robust understanding of market trends, opportunities, and challenges. The market size is expected to reach xx Million by 2033, exhibiting a CAGR of xx% during the forecast period.
Global Neuroprotective Agents Market Market Structure & Innovation Trends
The global neuroprotective agents market is moderately concentrated, with key players such as Sunovion Pharmaceuticals Inc, Merck KGaA, Bioniz Therapeutics, GlaxoSmithKline plc, and Pfizer Inc holding significant market share. However, the market also features several smaller, innovative companies contributing to the overall growth. Market share dynamics are influenced by factors such as R&D investments, regulatory approvals, and successful product launches. Mergers and acquisitions (M&A) activity has been moderate, with deal values ranging from xx Million to xx Million in recent years. Innovation is driven by the unmet medical needs in neurological disorders and advancements in drug delivery systems. Stringent regulatory frameworks, primarily driven by the FDA and EMA, influence the market entry of new drugs. Substitutes exist for some neuroprotective agents, but their efficacy and safety profiles often vary considerably. The end-user demographics are predominantly aging populations with neurodegenerative diseases.
- Market Concentration: Moderately concentrated
- Top 5 Players Market Share: xx% (estimated)
- Recent M&A Deal Value Range: xx Million - xx Million
- Innovation Drivers: Unmet medical needs, advancements in drug delivery
- Regulatory Frameworks: Stringent (FDA, EMA)
Global Neuroprotective Agents Market Market Dynamics & Trends
The global neuroprotective agents market is experiencing robust growth, propelled by several factors. The rising prevalence of neurodegenerative diseases such as Alzheimer's and Parkinson's disease, coupled with an aging global population, is a primary driver. Technological advancements in drug discovery and development, leading to improved efficacy and safety profiles, also contribute significantly. Consumer preferences are shifting towards more convenient and effective treatment options, stimulating demand for advanced neuroprotective agents. The competitive landscape is dynamic, with both established pharmaceutical companies and emerging biotech firms vying for market share. This competition drives innovation and fosters the development of novel therapies. The market penetration of new neuroprotective agents varies based on therapeutic area and regulatory approvals.
Dominant Regions & Segments in Global Neuroprotective Agents Market
North America currently holds the dominant position in the global neuroprotective agents market, driven by factors such as high healthcare expenditure, advanced healthcare infrastructure, and a significant prevalence of neurodegenerative diseases. Within North America, the United States is the largest market, while in Europe, Germany and the UK are key contributors. Asia-Pacific is witnessing considerable growth, largely driven by rising healthcare expenditure and increasing awareness of neurological disorders.
Key Drivers by Segment:
By Distribution Channel:
- Hospital Pharmacies: High concentration of patients with severe neurological conditions.
- Retail Pharmacies: Convenience and accessibility for patients with less severe conditions.
- Online Pharmacies: Increasing preference for ease and convenience of online purchasing.
- Drug Stores: Wide reach and accessibility for patients.
By Drug Class:
- Antagonists: Growing demand due to their efficacy in specific neurological disorders.
- Antidepressants: Widely prescribed for associated symptoms of neurodegenerative disorders.
- Anesthetics: Essential for various neurological procedures.
- Others: A large and diverse group, characterized by niche indications and applications.
By Application:
- Alzheimer's Disease: Largest segment driven by high prevalence and unmet need for effective treatments.
- Dementia: Significant market, overlapping with Alzheimer's disease.
- Epilepsy: Established market with several approved medications.
- Multiple Sclerosis: Growing market segment, reflecting increased understanding of the disease.
- Others: A diverse range of neurological conditions and disorders.
By Route of Administration:
- Oral: Most preferred for convenience and patient compliance.
- Intravenous: Essential for immediate and effective treatment.
- Topical: Applicable to certain neurological conditions and localized therapies.
- Epidural: Used for specific procedures and conditions.
Global Neuroprotective Agents Market Product Innovations
Recent product innovations focus on improving drug delivery mechanisms, enhancing efficacy, and reducing side effects. Targeted therapies are gaining prominence, aiming to address specific molecular pathways implicated in neurodegenerative diseases. The development of biomarkers for early disease detection is also influencing the development of novel neuroprotective agents. These innovations are aimed at addressing the substantial unmet medical need for effective treatments for these debilitating conditions and optimizing market fit by meeting the needs of both healthcare professionals and patients.
Report Scope & Segmentation Analysis
This report comprehensively analyzes the global neuroprotective agents market across various segments: distribution channels (hospital pharmacies, retail pharmacies, drug stores, online pharmacies), drug classes (anesthetics, antagonists, antidepressants, cytokines, others), applications (Alzheimer's disease, dementia, epilepsy, multiple sclerosis, others), and routes of administration (oral, topical, epidural, intravenous). Each segment's growth projections, market size (in Million), and competitive dynamics are thoroughly evaluated, providing a granular perspective of the market landscape. Growth rates vary significantly across segments reflecting the complexities of the market.
Key Drivers of Global Neuroprotective Agents Market Growth
The market's growth is driven by several factors, including: the increasing prevalence of neurodegenerative diseases; technological advancements in drug development and delivery; rising healthcare expenditure globally; and favorable regulatory environments encouraging innovation in the pharmaceutical industry. Specifically, the aging global population fuels demand for treatments for Alzheimer's disease and other age-related neurological conditions.
Challenges in the Global Neuroprotective Agents Market Sector
Challenges include the high cost of drug development and regulatory approval processes, the complex pathophysiology of neurodegenerative diseases, and the potential for side effects associated with certain neuroprotective agents. Furthermore, competition from generic medications, and challenges in achieving sustained market share within a competitive landscape, pose significant obstacles to market expansion. These factors collectively influence market growth and profitability.
Emerging Opportunities in Global Neuroprotective Agents Market
Emerging opportunities lie in the development of personalized therapies, the use of advanced diagnostic tools for early disease detection, and the exploration of novel drug targets for neuroprotection. The expansion into emerging markets, particularly in Asia-Pacific, also presents significant potential for growth, reflecting the growing demand for healthcare in these regions.
Leading Players in the Global Neuroprotective Agents Market Market
- Sunovion Pharmaceuticals Inc
- Merck KGaA
- Bioniz Therapeutics
- GlaxoSmithKline plc
- Neuren Pharmaceuticals
- Teva Pharmaceutical Industries Ltd
- Novartis Pharmaceuticals Corporation
- Sun Pharmaceutical Industries Ltd
- Genervon Biopharmaceuticals LLC
- Hikma Pharmaceuticals PLC
- Pfizer Inc
Key Developments in Global Neuroprotective Agents Market Industry
- August 2022: BrainStorm submitted a Biologics License Application (BLA) to the Food and Drug Administration for NurOwn as a potential treatment for ALS.
- August 2022: Incannex Healthcare engaged Curia Global to scale up the manufacture of IHL-216A for the treatment of concussion and traumatic brain injury.
These developments highlight the ongoing efforts to develop novel treatments for neurological disorders and expand treatment options for patients.
Future Outlook for Global Neuroprotective Agents Market Market
The future outlook for the global neuroprotective agents market remains positive, with continued growth anticipated throughout the forecast period. Ongoing R&D efforts focused on novel therapies and improved drug delivery systems will drive market expansion. The increasing prevalence of neurodegenerative diseases in an aging global population will further bolster market demand. Strategic partnerships and collaborations between pharmaceutical companies and research institutions are expected to accelerate innovation and enhance market penetration.
Global Neuroprotective Agents Market Segmentation
-
1. Drug Class
- 1.1. Anesthetics
- 1.2. Antagonists
- 1.3. Antidepressants
- 1.4. Cytokines
-
2. Application
- 2.1. Alzheimer's disease
- 2.2. Dementia
- 2.3. Epilepsy
- 2.4. Multiple sclerosis
-
3. Route of Administration
- 3.1. Oral
- 3.2. Topical
- 3.3. Epidural
- 3.4. Intravenous
-
4. Distribution Cahnnel
- 4.1. Hospital Pharmacies
- 4.2. Retail Pharmacies
- 4.3. Drug Stores
- 4.4. Online Pharmacies
Global Neuroprotective Agents Market Segmentation By Geography
-
1. North America
- 1.1. United States
- 1.2. Canada
- 1.3. Mexico
-
2. Europe
- 2.1. Germany
- 2.2. United Kingdom
- 2.3. France
- 2.4. Italy
- 2.5. Spain
- 2.6. Rest of Europe
-
3. Asia Pacific
- 3.1. China
- 3.2. Japan
- 3.3. India
- 3.4. Australia
- 3.5. South Korea
- 3.6. Rest of Asia Pacific
-
4. Middle East and Africa
- 4.1. GCC
- 4.2. South Africa
- 4.3. Rest of Middle East and Africa
-
5. South America
- 5.1. Brazil
- 5.2. Argentina
- 5.3. Rest of South America
Global Neuroprotective Agents Market REPORT HIGHLIGHTS
| Aspects | Details |
|---|---|
| Study Period | 2019-2033 |
| Base Year | 2024 |
| Estimated Year | 2025 |
| Forecast Period | 2025-2033 |
| Historical Period | 2019-2024 |
| Growth Rate | CAGR of 6.70% from 2019-2033 |
| Segmentation |
|
Table of Contents
- 1. Introduction
- 1.1. Research Scope
- 1.2. Market Segmentation
- 1.3. Research Methodology
- 1.4. Definitions and Assumptions
- 2. Executive Summary
- 2.1. Introduction
- 3. Market Dynamics
- 3.1. Introduction
- 3.2. Market Drivers
- 3.2.1. Increase in Incidence and Prevalence of Neurodegenerative Diseases; Increase in Stroke and Traumatic Central Nervous System Injuries; Rising Awareness for Neuroprotective Agents
- 3.3. Market Restrains
- 3.3.1. Failure of Clinical Trails in Neuroprotective Productline.; Strigent Regulatory Approvals
- 3.4. Market Trends
- 3.4.1. The Alzheimer's disease Segment is Expected to Hold a Major Market Share in the Neuroprotective Agents Market
- 4. Market Factor Analysis
- 4.1. Porters Five Forces
- 4.2. Supply/Value Chain
- 4.3. PESTEL analysis
- 4.4. Market Entropy
- 4.5. Patent/Trademark Analysis
- 5. Global Neuroprotective Agents Market Analysis, Insights and Forecast, 2019-2031
- 5.1. Market Analysis, Insights and Forecast - by Drug Class
- 5.1.1. Anesthetics
- 5.1.2. Antagonists
- 5.1.3. Antidepressants
- 5.1.4. Cytokines
- 5.2. Market Analysis, Insights and Forecast - by Application
- 5.2.1. Alzheimer's disease
- 5.2.2. Dementia
- 5.2.3. Epilepsy
- 5.2.4. Multiple sclerosis
- 5.3. Market Analysis, Insights and Forecast - by Route of Administration
- 5.3.1. Oral
- 5.3.2. Topical
- 5.3.3. Epidural
- 5.3.4. Intravenous
- 5.4. Market Analysis, Insights and Forecast - by Distribution Cahnnel
- 5.4.1. Hospital Pharmacies
- 5.4.2. Retail Pharmacies
- 5.4.3. Drug Stores
- 5.4.4. Online Pharmacies
- 5.5. Market Analysis, Insights and Forecast - by Region
- 5.5.1. North America
- 5.5.2. Europe
- 5.5.3. Asia Pacific
- 5.5.4. Middle East and Africa
- 5.5.5. South America
- 5.1. Market Analysis, Insights and Forecast - by Drug Class
- 6. North America Global Neuroprotective Agents Market Analysis, Insights and Forecast, 2019-2031
- 6.1. Market Analysis, Insights and Forecast - by Drug Class
- 6.1.1. Anesthetics
- 6.1.2. Antagonists
- 6.1.3. Antidepressants
- 6.1.4. Cytokines
- 6.2. Market Analysis, Insights and Forecast - by Application
- 6.2.1. Alzheimer's disease
- 6.2.2. Dementia
- 6.2.3. Epilepsy
- 6.2.4. Multiple sclerosis
- 6.3. Market Analysis, Insights and Forecast - by Route of Administration
- 6.3.1. Oral
- 6.3.2. Topical
- 6.3.3. Epidural
- 6.3.4. Intravenous
- 6.4. Market Analysis, Insights and Forecast - by Distribution Cahnnel
- 6.4.1. Hospital Pharmacies
- 6.4.2. Retail Pharmacies
- 6.4.3. Drug Stores
- 6.4.4. Online Pharmacies
- 6.1. Market Analysis, Insights and Forecast - by Drug Class
- 7. Europe Global Neuroprotective Agents Market Analysis, Insights and Forecast, 2019-2031
- 7.1. Market Analysis, Insights and Forecast - by Drug Class
- 7.1.1. Anesthetics
- 7.1.2. Antagonists
- 7.1.3. Antidepressants
- 7.1.4. Cytokines
- 7.2. Market Analysis, Insights and Forecast - by Application
- 7.2.1. Alzheimer's disease
- 7.2.2. Dementia
- 7.2.3. Epilepsy
- 7.2.4. Multiple sclerosis
- 7.3. Market Analysis, Insights and Forecast - by Route of Administration
- 7.3.1. Oral
- 7.3.2. Topical
- 7.3.3. Epidural
- 7.3.4. Intravenous
- 7.4. Market Analysis, Insights and Forecast - by Distribution Cahnnel
- 7.4.1. Hospital Pharmacies
- 7.4.2. Retail Pharmacies
- 7.4.3. Drug Stores
- 7.4.4. Online Pharmacies
- 7.1. Market Analysis, Insights and Forecast - by Drug Class
- 8. Asia Pacific Global Neuroprotective Agents Market Analysis, Insights and Forecast, 2019-2031
- 8.1. Market Analysis, Insights and Forecast - by Drug Class
- 8.1.1. Anesthetics
- 8.1.2. Antagonists
- 8.1.3. Antidepressants
- 8.1.4. Cytokines
- 8.2. Market Analysis, Insights and Forecast - by Application
- 8.2.1. Alzheimer's disease
- 8.2.2. Dementia
- 8.2.3. Epilepsy
- 8.2.4. Multiple sclerosis
- 8.3. Market Analysis, Insights and Forecast - by Route of Administration
- 8.3.1. Oral
- 8.3.2. Topical
- 8.3.3. Epidural
- 8.3.4. Intravenous
- 8.4. Market Analysis, Insights and Forecast - by Distribution Cahnnel
- 8.4.1. Hospital Pharmacies
- 8.4.2. Retail Pharmacies
- 8.4.3. Drug Stores
- 8.4.4. Online Pharmacies
- 8.1. Market Analysis, Insights and Forecast - by Drug Class
- 9. Middle East and Africa Global Neuroprotective Agents Market Analysis, Insights and Forecast, 2019-2031
- 9.1. Market Analysis, Insights and Forecast - by Drug Class
- 9.1.1. Anesthetics
- 9.1.2. Antagonists
- 9.1.3. Antidepressants
- 9.1.4. Cytokines
- 9.2. Market Analysis, Insights and Forecast - by Application
- 9.2.1. Alzheimer's disease
- 9.2.2. Dementia
- 9.2.3. Epilepsy
- 9.2.4. Multiple sclerosis
- 9.3. Market Analysis, Insights and Forecast - by Route of Administration
- 9.3.1. Oral
- 9.3.2. Topical
- 9.3.3. Epidural
- 9.3.4. Intravenous
- 9.4. Market Analysis, Insights and Forecast - by Distribution Cahnnel
- 9.4.1. Hospital Pharmacies
- 9.4.2. Retail Pharmacies
- 9.4.3. Drug Stores
- 9.4.4. Online Pharmacies
- 9.1. Market Analysis, Insights and Forecast - by Drug Class
- 10. South America Global Neuroprotective Agents Market Analysis, Insights and Forecast, 2019-2031
- 10.1. Market Analysis, Insights and Forecast - by Drug Class
- 10.1.1. Anesthetics
- 10.1.2. Antagonists
- 10.1.3. Antidepressants
- 10.1.4. Cytokines
- 10.2. Market Analysis, Insights and Forecast - by Application
- 10.2.1. Alzheimer's disease
- 10.2.2. Dementia
- 10.2.3. Epilepsy
- 10.2.4. Multiple sclerosis
- 10.3. Market Analysis, Insights and Forecast - by Route of Administration
- 10.3.1. Oral
- 10.3.2. Topical
- 10.3.3. Epidural
- 10.3.4. Intravenous
- 10.4. Market Analysis, Insights and Forecast - by Distribution Cahnnel
- 10.4.1. Hospital Pharmacies
- 10.4.2. Retail Pharmacies
- 10.4.3. Drug Stores
- 10.4.4. Online Pharmacies
- 10.1. Market Analysis, Insights and Forecast - by Drug Class
- 11. North America Global Neuroprotective Agents Market Analysis, Insights and Forecast, 2019-2031
- 11.1. Market Analysis, Insights and Forecast - By Country/Sub-region
- 11.1.1 United States
- 11.1.2 Canada
- 11.1.3 Mexico
- 12. Europe Global Neuroprotective Agents Market Analysis, Insights and Forecast, 2019-2031
- 12.1. Market Analysis, Insights and Forecast - By Country/Sub-region
- 12.1.1 Germany
- 12.1.2 United Kingdom
- 12.1.3 France
- 12.1.4 Italy
- 12.1.5 Spain
- 12.1.6 Rest of Europe
- 13. Asia Pacific Global Neuroprotective Agents Market Analysis, Insights and Forecast, 2019-2031
- 13.1. Market Analysis, Insights and Forecast - By Country/Sub-region
- 13.1.1 China
- 13.1.2 Japan
- 13.1.3 India
- 13.1.4 Australia
- 13.1.5 South Korea
- 13.1.6 Rest of Asia Pacific
- 14. Middle East and Africa Global Neuroprotective Agents Market Analysis, Insights and Forecast, 2019-2031
- 14.1. Market Analysis, Insights and Forecast - By Country/Sub-region
- 14.1.1 GCC
- 14.1.2 South Africa
- 14.1.3 Rest of Middle East and Africa
- 15. South America Global Neuroprotective Agents Market Analysis, Insights and Forecast, 2019-2031
- 15.1. Market Analysis, Insights and Forecast - By Country/Sub-region
- 15.1.1 Brazil
- 15.1.2 Argentina
- 15.1.3 Rest of South America
- 16. Competitive Analysis
- 16.1. Market Share Analysis 2024
- 16.2. Company Profiles
- 16.2.1 Sunovion Pharmaceuticals Inc
- 16.2.1.1. Overview
- 16.2.1.2. Products
- 16.2.1.3. SWOT Analysis
- 16.2.1.4. Recent Developments
- 16.2.1.5. Financials (Based on Availability)
- 16.2.2 Merck KGaA
- 16.2.2.1. Overview
- 16.2.2.2. Products
- 16.2.2.3. SWOT Analysis
- 16.2.2.4. Recent Developments
- 16.2.2.5. Financials (Based on Availability)
- 16.2.3 Bioniz Theraputics
- 16.2.3.1. Overview
- 16.2.3.2. Products
- 16.2.3.3. SWOT Analysis
- 16.2.3.4. Recent Developments
- 16.2.3.5. Financials (Based on Availability)
- 16.2.4 GlaxoSmithKline plc
- 16.2.4.1. Overview
- 16.2.4.2. Products
- 16.2.4.3. SWOT Analysis
- 16.2.4.4. Recent Developments
- 16.2.4.5. Financials (Based on Availability)
- 16.2.5 Neuren Pharmaceuticals
- 16.2.5.1. Overview
- 16.2.5.2. Products
- 16.2.5.3. SWOT Analysis
- 16.2.5.4. Recent Developments
- 16.2.5.5. Financials (Based on Availability)
- 16.2.6 Teva Pharmaceutical Industries Ltd
- 16.2.6.1. Overview
- 16.2.6.2. Products
- 16.2.6.3. SWOT Analysis
- 16.2.6.4. Recent Developments
- 16.2.6.5. Financials (Based on Availability)
- 16.2.7 Novartis Pharmaceuticals Corporation
- 16.2.7.1. Overview
- 16.2.7.2. Products
- 16.2.7.3. SWOT Analysis
- 16.2.7.4. Recent Developments
- 16.2.7.5. Financials (Based on Availability)
- 16.2.8 Sun Pharmaceutical Industries Ltd
- 16.2.8.1. Overview
- 16.2.8.2. Products
- 16.2.8.3. SWOT Analysis
- 16.2.8.4. Recent Developments
- 16.2.8.5. Financials (Based on Availability)
- 16.2.9 Genervon Biopharmaceuticals LLC
- 16.2.9.1. Overview
- 16.2.9.2. Products
- 16.2.9.3. SWOT Analysis
- 16.2.9.4. Recent Developments
- 16.2.9.5. Financials (Based on Availability)
- 16.2.10 Hikma Pharmaceuticals PLC
- 16.2.10.1. Overview
- 16.2.10.2. Products
- 16.2.10.3. SWOT Analysis
- 16.2.10.4. Recent Developments
- 16.2.10.5. Financials (Based on Availability)
- 16.2.11 Pfizer Inc
- 16.2.11.1. Overview
- 16.2.11.2. Products
- 16.2.11.3. SWOT Analysis
- 16.2.11.4. Recent Developments
- 16.2.11.5. Financials (Based on Availability)
- 16.2.1 Sunovion Pharmaceuticals Inc
List of Figures
- Figure 1: Global Global Neuroprotective Agents Market Revenue Breakdown (Million, %) by Region 2024 & 2032
- Figure 2: Global Global Neuroprotective Agents Market Volume Breakdown (K Unit, %) by Region 2024 & 2032
- Figure 3: North America Global Neuroprotective Agents Market Revenue (Million), by Country 2024 & 2032
- Figure 4: North America Global Neuroprotective Agents Market Volume (K Unit), by Country 2024 & 2032
- Figure 5: North America Global Neuroprotective Agents Market Revenue Share (%), by Country 2024 & 2032
- Figure 6: North America Global Neuroprotective Agents Market Volume Share (%), by Country 2024 & 2032
- Figure 7: Europe Global Neuroprotective Agents Market Revenue (Million), by Country 2024 & 2032
- Figure 8: Europe Global Neuroprotective Agents Market Volume (K Unit), by Country 2024 & 2032
- Figure 9: Europe Global Neuroprotective Agents Market Revenue Share (%), by Country 2024 & 2032
- Figure 10: Europe Global Neuroprotective Agents Market Volume Share (%), by Country 2024 & 2032
- Figure 11: Asia Pacific Global Neuroprotective Agents Market Revenue (Million), by Country 2024 & 2032
- Figure 12: Asia Pacific Global Neuroprotective Agents Market Volume (K Unit), by Country 2024 & 2032
- Figure 13: Asia Pacific Global Neuroprotective Agents Market Revenue Share (%), by Country 2024 & 2032
- Figure 14: Asia Pacific Global Neuroprotective Agents Market Volume Share (%), by Country 2024 & 2032
- Figure 15: Middle East and Africa Global Neuroprotective Agents Market Revenue (Million), by Country 2024 & 2032
- Figure 16: Middle East and Africa Global Neuroprotective Agents Market Volume (K Unit), by Country 2024 & 2032
- Figure 17: Middle East and Africa Global Neuroprotective Agents Market Revenue Share (%), by Country 2024 & 2032
- Figure 18: Middle East and Africa Global Neuroprotective Agents Market Volume Share (%), by Country 2024 & 2032
- Figure 19: South America Global Neuroprotective Agents Market Revenue (Million), by Country 2024 & 2032
- Figure 20: South America Global Neuroprotective Agents Market Volume (K Unit), by Country 2024 & 2032
- Figure 21: South America Global Neuroprotective Agents Market Revenue Share (%), by Country 2024 & 2032
- Figure 22: South America Global Neuroprotective Agents Market Volume Share (%), by Country 2024 & 2032
- Figure 23: North America Global Neuroprotective Agents Market Revenue (Million), by Drug Class 2024 & 2032
- Figure 24: North America Global Neuroprotective Agents Market Volume (K Unit), by Drug Class 2024 & 2032
- Figure 25: North America Global Neuroprotective Agents Market Revenue Share (%), by Drug Class 2024 & 2032
- Figure 26: North America Global Neuroprotective Agents Market Volume Share (%), by Drug Class 2024 & 2032
- Figure 27: North America Global Neuroprotective Agents Market Revenue (Million), by Application 2024 & 2032
- Figure 28: North America Global Neuroprotective Agents Market Volume (K Unit), by Application 2024 & 2032
- Figure 29: North America Global Neuroprotective Agents Market Revenue Share (%), by Application 2024 & 2032
- Figure 30: North America Global Neuroprotective Agents Market Volume Share (%), by Application 2024 & 2032
- Figure 31: North America Global Neuroprotective Agents Market Revenue (Million), by Route of Administration 2024 & 2032
- Figure 32: North America Global Neuroprotective Agents Market Volume (K Unit), by Route of Administration 2024 & 2032
- Figure 33: North America Global Neuroprotective Agents Market Revenue Share (%), by Route of Administration 2024 & 2032
- Figure 34: North America Global Neuroprotective Agents Market Volume Share (%), by Route of Administration 2024 & 2032
- Figure 35: North America Global Neuroprotective Agents Market Revenue (Million), by Distribution Cahnnel 2024 & 2032
- Figure 36: North America Global Neuroprotective Agents Market Volume (K Unit), by Distribution Cahnnel 2024 & 2032
- Figure 37: North America Global Neuroprotective Agents Market Revenue Share (%), by Distribution Cahnnel 2024 & 2032
- Figure 38: North America Global Neuroprotective Agents Market Volume Share (%), by Distribution Cahnnel 2024 & 2032
- Figure 39: North America Global Neuroprotective Agents Market Revenue (Million), by Country 2024 & 2032
- Figure 40: North America Global Neuroprotective Agents Market Volume (K Unit), by Country 2024 & 2032
- Figure 41: North America Global Neuroprotective Agents Market Revenue Share (%), by Country 2024 & 2032
- Figure 42: North America Global Neuroprotective Agents Market Volume Share (%), by Country 2024 & 2032
- Figure 43: Europe Global Neuroprotective Agents Market Revenue (Million), by Drug Class 2024 & 2032
- Figure 44: Europe Global Neuroprotective Agents Market Volume (K Unit), by Drug Class 2024 & 2032
- Figure 45: Europe Global Neuroprotective Agents Market Revenue Share (%), by Drug Class 2024 & 2032
- Figure 46: Europe Global Neuroprotective Agents Market Volume Share (%), by Drug Class 2024 & 2032
- Figure 47: Europe Global Neuroprotective Agents Market Revenue (Million), by Application 2024 & 2032
- Figure 48: Europe Global Neuroprotective Agents Market Volume (K Unit), by Application 2024 & 2032
- Figure 49: Europe Global Neuroprotective Agents Market Revenue Share (%), by Application 2024 & 2032
- Figure 50: Europe Global Neuroprotective Agents Market Volume Share (%), by Application 2024 & 2032
- Figure 51: Europe Global Neuroprotective Agents Market Revenue (Million), by Route of Administration 2024 & 2032
- Figure 52: Europe Global Neuroprotective Agents Market Volume (K Unit), by Route of Administration 2024 & 2032
- Figure 53: Europe Global Neuroprotective Agents Market Revenue Share (%), by Route of Administration 2024 & 2032
- Figure 54: Europe Global Neuroprotective Agents Market Volume Share (%), by Route of Administration 2024 & 2032
- Figure 55: Europe Global Neuroprotective Agents Market Revenue (Million), by Distribution Cahnnel 2024 & 2032
- Figure 56: Europe Global Neuroprotective Agents Market Volume (K Unit), by Distribution Cahnnel 2024 & 2032
- Figure 57: Europe Global Neuroprotective Agents Market Revenue Share (%), by Distribution Cahnnel 2024 & 2032
- Figure 58: Europe Global Neuroprotective Agents Market Volume Share (%), by Distribution Cahnnel 2024 & 2032
- Figure 59: Europe Global Neuroprotective Agents Market Revenue (Million), by Country 2024 & 2032
- Figure 60: Europe Global Neuroprotective Agents Market Volume (K Unit), by Country 2024 & 2032
- Figure 61: Europe Global Neuroprotective Agents Market Revenue Share (%), by Country 2024 & 2032
- Figure 62: Europe Global Neuroprotective Agents Market Volume Share (%), by Country 2024 & 2032
- Figure 63: Asia Pacific Global Neuroprotective Agents Market Revenue (Million), by Drug Class 2024 & 2032
- Figure 64: Asia Pacific Global Neuroprotective Agents Market Volume (K Unit), by Drug Class 2024 & 2032
- Figure 65: Asia Pacific Global Neuroprotective Agents Market Revenue Share (%), by Drug Class 2024 & 2032
- Figure 66: Asia Pacific Global Neuroprotective Agents Market Volume Share (%), by Drug Class 2024 & 2032
- Figure 67: Asia Pacific Global Neuroprotective Agents Market Revenue (Million), by Application 2024 & 2032
- Figure 68: Asia Pacific Global Neuroprotective Agents Market Volume (K Unit), by Application 2024 & 2032
- Figure 69: Asia Pacific Global Neuroprotective Agents Market Revenue Share (%), by Application 2024 & 2032
- Figure 70: Asia Pacific Global Neuroprotective Agents Market Volume Share (%), by Application 2024 & 2032
- Figure 71: Asia Pacific Global Neuroprotective Agents Market Revenue (Million), by Route of Administration 2024 & 2032
- Figure 72: Asia Pacific Global Neuroprotective Agents Market Volume (K Unit), by Route of Administration 2024 & 2032
- Figure 73: Asia Pacific Global Neuroprotective Agents Market Revenue Share (%), by Route of Administration 2024 & 2032
- Figure 74: Asia Pacific Global Neuroprotective Agents Market Volume Share (%), by Route of Administration 2024 & 2032
- Figure 75: Asia Pacific Global Neuroprotective Agents Market Revenue (Million), by Distribution Cahnnel 2024 & 2032
- Figure 76: Asia Pacific Global Neuroprotective Agents Market Volume (K Unit), by Distribution Cahnnel 2024 & 2032
- Figure 77: Asia Pacific Global Neuroprotective Agents Market Revenue Share (%), by Distribution Cahnnel 2024 & 2032
- Figure 78: Asia Pacific Global Neuroprotective Agents Market Volume Share (%), by Distribution Cahnnel 2024 & 2032
- Figure 79: Asia Pacific Global Neuroprotective Agents Market Revenue (Million), by Country 2024 & 2032
- Figure 80: Asia Pacific Global Neuroprotective Agents Market Volume (K Unit), by Country 2024 & 2032
- Figure 81: Asia Pacific Global Neuroprotective Agents Market Revenue Share (%), by Country 2024 & 2032
- Figure 82: Asia Pacific Global Neuroprotective Agents Market Volume Share (%), by Country 2024 & 2032
- Figure 83: Middle East and Africa Global Neuroprotective Agents Market Revenue (Million), by Drug Class 2024 & 2032
- Figure 84: Middle East and Africa Global Neuroprotective Agents Market Volume (K Unit), by Drug Class 2024 & 2032
- Figure 85: Middle East and Africa Global Neuroprotective Agents Market Revenue Share (%), by Drug Class 2024 & 2032
- Figure 86: Middle East and Africa Global Neuroprotective Agents Market Volume Share (%), by Drug Class 2024 & 2032
- Figure 87: Middle East and Africa Global Neuroprotective Agents Market Revenue (Million), by Application 2024 & 2032
- Figure 88: Middle East and Africa Global Neuroprotective Agents Market Volume (K Unit), by Application 2024 & 2032
- Figure 89: Middle East and Africa Global Neuroprotective Agents Market Revenue Share (%), by Application 2024 & 2032
- Figure 90: Middle East and Africa Global Neuroprotective Agents Market Volume Share (%), by Application 2024 & 2032
- Figure 91: Middle East and Africa Global Neuroprotective Agents Market Revenue (Million), by Route of Administration 2024 & 2032
- Figure 92: Middle East and Africa Global Neuroprotective Agents Market Volume (K Unit), by Route of Administration 2024 & 2032
- Figure 93: Middle East and Africa Global Neuroprotective Agents Market Revenue Share (%), by Route of Administration 2024 & 2032
- Figure 94: Middle East and Africa Global Neuroprotective Agents Market Volume Share (%), by Route of Administration 2024 & 2032
- Figure 95: Middle East and Africa Global Neuroprotective Agents Market Revenue (Million), by Distribution Cahnnel 2024 & 2032
- Figure 96: Middle East and Africa Global Neuroprotective Agents Market Volume (K Unit), by Distribution Cahnnel 2024 & 2032
- Figure 97: Middle East and Africa Global Neuroprotective Agents Market Revenue Share (%), by Distribution Cahnnel 2024 & 2032
- Figure 98: Middle East and Africa Global Neuroprotective Agents Market Volume Share (%), by Distribution Cahnnel 2024 & 2032
- Figure 99: Middle East and Africa Global Neuroprotective Agents Market Revenue (Million), by Country 2024 & 2032
- Figure 100: Middle East and Africa Global Neuroprotective Agents Market Volume (K Unit), by Country 2024 & 2032
- Figure 101: Middle East and Africa Global Neuroprotective Agents Market Revenue Share (%), by Country 2024 & 2032
- Figure 102: Middle East and Africa Global Neuroprotective Agents Market Volume Share (%), by Country 2024 & 2032
- Figure 103: South America Global Neuroprotective Agents Market Revenue (Million), by Drug Class 2024 & 2032
- Figure 104: South America Global Neuroprotective Agents Market Volume (K Unit), by Drug Class 2024 & 2032
- Figure 105: South America Global Neuroprotective Agents Market Revenue Share (%), by Drug Class 2024 & 2032
- Figure 106: South America Global Neuroprotective Agents Market Volume Share (%), by Drug Class 2024 & 2032
- Figure 107: South America Global Neuroprotective Agents Market Revenue (Million), by Application 2024 & 2032
- Figure 108: South America Global Neuroprotective Agents Market Volume (K Unit), by Application 2024 & 2032
- Figure 109: South America Global Neuroprotective Agents Market Revenue Share (%), by Application 2024 & 2032
- Figure 110: South America Global Neuroprotective Agents Market Volume Share (%), by Application 2024 & 2032
- Figure 111: South America Global Neuroprotective Agents Market Revenue (Million), by Route of Administration 2024 & 2032
- Figure 112: South America Global Neuroprotective Agents Market Volume (K Unit), by Route of Administration 2024 & 2032
- Figure 113: South America Global Neuroprotective Agents Market Revenue Share (%), by Route of Administration 2024 & 2032
- Figure 114: South America Global Neuroprotective Agents Market Volume Share (%), by Route of Administration 2024 & 2032
- Figure 115: South America Global Neuroprotective Agents Market Revenue (Million), by Distribution Cahnnel 2024 & 2032
- Figure 116: South America Global Neuroprotective Agents Market Volume (K Unit), by Distribution Cahnnel 2024 & 2032
- Figure 117: South America Global Neuroprotective Agents Market Revenue Share (%), by Distribution Cahnnel 2024 & 2032
- Figure 118: South America Global Neuroprotective Agents Market Volume Share (%), by Distribution Cahnnel 2024 & 2032
- Figure 119: South America Global Neuroprotective Agents Market Revenue (Million), by Country 2024 & 2032
- Figure 120: South America Global Neuroprotective Agents Market Volume (K Unit), by Country 2024 & 2032
- Figure 121: South America Global Neuroprotective Agents Market Revenue Share (%), by Country 2024 & 2032
- Figure 122: South America Global Neuroprotective Agents Market Volume Share (%), by Country 2024 & 2032
List of Tables
- Table 1: Global Neuroprotective Agents Market Revenue Million Forecast, by Region 2019 & 2032
- Table 2: Global Neuroprotective Agents Market Volume K Unit Forecast, by Region 2019 & 2032
- Table 3: Global Neuroprotective Agents Market Revenue Million Forecast, by Drug Class 2019 & 2032
- Table 4: Global Neuroprotective Agents Market Volume K Unit Forecast, by Drug Class 2019 & 2032
- Table 5: Global Neuroprotective Agents Market Revenue Million Forecast, by Application 2019 & 2032
- Table 6: Global Neuroprotective Agents Market Volume K Unit Forecast, by Application 2019 & 2032
- Table 7: Global Neuroprotective Agents Market Revenue Million Forecast, by Route of Administration 2019 & 2032
- Table 8: Global Neuroprotective Agents Market Volume K Unit Forecast, by Route of Administration 2019 & 2032
- Table 9: Global Neuroprotective Agents Market Revenue Million Forecast, by Distribution Cahnnel 2019 & 2032
- Table 10: Global Neuroprotective Agents Market Volume K Unit Forecast, by Distribution Cahnnel 2019 & 2032
- Table 11: Global Neuroprotective Agents Market Revenue Million Forecast, by Region 2019 & 2032
- Table 12: Global Neuroprotective Agents Market Volume K Unit Forecast, by Region 2019 & 2032
- Table 13: Global Neuroprotective Agents Market Revenue Million Forecast, by Country 2019 & 2032
- Table 14: Global Neuroprotective Agents Market Volume K Unit Forecast, by Country 2019 & 2032
- Table 15: United States Global Neuroprotective Agents Market Revenue (Million) Forecast, by Application 2019 & 2032
- Table 16: United States Global Neuroprotective Agents Market Volume (K Unit) Forecast, by Application 2019 & 2032
- Table 17: Canada Global Neuroprotective Agents Market Revenue (Million) Forecast, by Application 2019 & 2032
- Table 18: Canada Global Neuroprotective Agents Market Volume (K Unit) Forecast, by Application 2019 & 2032
- Table 19: Mexico Global Neuroprotective Agents Market Revenue (Million) Forecast, by Application 2019 & 2032
- Table 20: Mexico Global Neuroprotective Agents Market Volume (K Unit) Forecast, by Application 2019 & 2032
- Table 21: Global Neuroprotective Agents Market Revenue Million Forecast, by Country 2019 & 2032
- Table 22: Global Neuroprotective Agents Market Volume K Unit Forecast, by Country 2019 & 2032
- Table 23: Germany Global Neuroprotective Agents Market Revenue (Million) Forecast, by Application 2019 & 2032
- Table 24: Germany Global Neuroprotective Agents Market Volume (K Unit) Forecast, by Application 2019 & 2032
- Table 25: United Kingdom Global Neuroprotective Agents Market Revenue (Million) Forecast, by Application 2019 & 2032
- Table 26: United Kingdom Global Neuroprotective Agents Market Volume (K Unit) Forecast, by Application 2019 & 2032
- Table 27: France Global Neuroprotective Agents Market Revenue (Million) Forecast, by Application 2019 & 2032
- Table 28: France Global Neuroprotective Agents Market Volume (K Unit) Forecast, by Application 2019 & 2032
- Table 29: Italy Global Neuroprotective Agents Market Revenue (Million) Forecast, by Application 2019 & 2032
- Table 30: Italy Global Neuroprotective Agents Market Volume (K Unit) Forecast, by Application 2019 & 2032
- Table 31: Spain Global Neuroprotective Agents Market Revenue (Million) Forecast, by Application 2019 & 2032
- Table 32: Spain Global Neuroprotective Agents Market Volume (K Unit) Forecast, by Application 2019 & 2032
- Table 33: Rest of Europe Global Neuroprotective Agents Market Revenue (Million) Forecast, by Application 2019 & 2032
- Table 34: Rest of Europe Global Neuroprotective Agents Market Volume (K Unit) Forecast, by Application 2019 & 2032
- Table 35: Global Neuroprotective Agents Market Revenue Million Forecast, by Country 2019 & 2032
- Table 36: Global Neuroprotective Agents Market Volume K Unit Forecast, by Country 2019 & 2032
- Table 37: China Global Neuroprotective Agents Market Revenue (Million) Forecast, by Application 2019 & 2032
- Table 38: China Global Neuroprotective Agents Market Volume (K Unit) Forecast, by Application 2019 & 2032
- Table 39: Japan Global Neuroprotective Agents Market Revenue (Million) Forecast, by Application 2019 & 2032
- Table 40: Japan Global Neuroprotective Agents Market Volume (K Unit) Forecast, by Application 2019 & 2032
- Table 41: India Global Neuroprotective Agents Market Revenue (Million) Forecast, by Application 2019 & 2032
- Table 42: India Global Neuroprotective Agents Market Volume (K Unit) Forecast, by Application 2019 & 2032
- Table 43: Australia Global Neuroprotective Agents Market Revenue (Million) Forecast, by Application 2019 & 2032
- Table 44: Australia Global Neuroprotective Agents Market Volume (K Unit) Forecast, by Application 2019 & 2032
- Table 45: South Korea Global Neuroprotective Agents Market Revenue (Million) Forecast, by Application 2019 & 2032
- Table 46: South Korea Global Neuroprotective Agents Market Volume (K Unit) Forecast, by Application 2019 & 2032
- Table 47: Rest of Asia Pacific Global Neuroprotective Agents Market Revenue (Million) Forecast, by Application 2019 & 2032
- Table 48: Rest of Asia Pacific Global Neuroprotective Agents Market Volume (K Unit) Forecast, by Application 2019 & 2032
- Table 49: Global Neuroprotective Agents Market Revenue Million Forecast, by Country 2019 & 2032
- Table 50: Global Neuroprotective Agents Market Volume K Unit Forecast, by Country 2019 & 2032
- Table 51: GCC Global Neuroprotective Agents Market Revenue (Million) Forecast, by Application 2019 & 2032
- Table 52: GCC Global Neuroprotective Agents Market Volume (K Unit) Forecast, by Application 2019 & 2032
- Table 53: South Africa Global Neuroprotective Agents Market Revenue (Million) Forecast, by Application 2019 & 2032
- Table 54: South Africa Global Neuroprotective Agents Market Volume (K Unit) Forecast, by Application 2019 & 2032
- Table 55: Rest of Middle East and Africa Global Neuroprotective Agents Market Revenue (Million) Forecast, by Application 2019 & 2032
- Table 56: Rest of Middle East and Africa Global Neuroprotective Agents Market Volume (K Unit) Forecast, by Application 2019 & 2032
- Table 57: Global Neuroprotective Agents Market Revenue Million Forecast, by Country 2019 & 2032
- Table 58: Global Neuroprotective Agents Market Volume K Unit Forecast, by Country 2019 & 2032
- Table 59: Brazil Global Neuroprotective Agents Market Revenue (Million) Forecast, by Application 2019 & 2032
- Table 60: Brazil Global Neuroprotective Agents Market Volume (K Unit) Forecast, by Application 2019 & 2032
- Table 61: Argentina Global Neuroprotective Agents Market Revenue (Million) Forecast, by Application 2019 & 2032
- Table 62: Argentina Global Neuroprotective Agents Market Volume (K Unit) Forecast, by Application 2019 & 2032
- Table 63: Rest of South America Global Neuroprotective Agents Market Revenue (Million) Forecast, by Application 2019 & 2032
- Table 64: Rest of South America Global Neuroprotective Agents Market Volume (K Unit) Forecast, by Application 2019 & 2032
- Table 65: Global Neuroprotective Agents Market Revenue Million Forecast, by Drug Class 2019 & 2032
- Table 66: Global Neuroprotective Agents Market Volume K Unit Forecast, by Drug Class 2019 & 2032
- Table 67: Global Neuroprotective Agents Market Revenue Million Forecast, by Application 2019 & 2032
- Table 68: Global Neuroprotective Agents Market Volume K Unit Forecast, by Application 2019 & 2032
- Table 69: Global Neuroprotective Agents Market Revenue Million Forecast, by Route of Administration 2019 & 2032
- Table 70: Global Neuroprotective Agents Market Volume K Unit Forecast, by Route of Administration 2019 & 2032
- Table 71: Global Neuroprotective Agents Market Revenue Million Forecast, by Distribution Cahnnel 2019 & 2032
- Table 72: Global Neuroprotective Agents Market Volume K Unit Forecast, by Distribution Cahnnel 2019 & 2032
- Table 73: Global Neuroprotective Agents Market Revenue Million Forecast, by Country 2019 & 2032
- Table 74: Global Neuroprotective Agents Market Volume K Unit Forecast, by Country 2019 & 2032
- Table 75: United States Global Neuroprotective Agents Market Revenue (Million) Forecast, by Application 2019 & 2032
- Table 76: United States Global Neuroprotective Agents Market Volume (K Unit) Forecast, by Application 2019 & 2032
- Table 77: Canada Global Neuroprotective Agents Market Revenue (Million) Forecast, by Application 2019 & 2032
- Table 78: Canada Global Neuroprotective Agents Market Volume (K Unit) Forecast, by Application 2019 & 2032
- Table 79: Mexico Global Neuroprotective Agents Market Revenue (Million) Forecast, by Application 2019 & 2032
- Table 80: Mexico Global Neuroprotective Agents Market Volume (K Unit) Forecast, by Application 2019 & 2032
- Table 81: Global Neuroprotective Agents Market Revenue Million Forecast, by Drug Class 2019 & 2032
- Table 82: Global Neuroprotective Agents Market Volume K Unit Forecast, by Drug Class 2019 & 2032
- Table 83: Global Neuroprotective Agents Market Revenue Million Forecast, by Application 2019 & 2032
- Table 84: Global Neuroprotective Agents Market Volume K Unit Forecast, by Application 2019 & 2032
- Table 85: Global Neuroprotective Agents Market Revenue Million Forecast, by Route of Administration 2019 & 2032
- Table 86: Global Neuroprotective Agents Market Volume K Unit Forecast, by Route of Administration 2019 & 2032
- Table 87: Global Neuroprotective Agents Market Revenue Million Forecast, by Distribution Cahnnel 2019 & 2032
- Table 88: Global Neuroprotective Agents Market Volume K Unit Forecast, by Distribution Cahnnel 2019 & 2032
- Table 89: Global Neuroprotective Agents Market Revenue Million Forecast, by Country 2019 & 2032
- Table 90: Global Neuroprotective Agents Market Volume K Unit Forecast, by Country 2019 & 2032
- Table 91: Germany Global Neuroprotective Agents Market Revenue (Million) Forecast, by Application 2019 & 2032
- Table 92: Germany Global Neuroprotective Agents Market Volume (K Unit) Forecast, by Application 2019 & 2032
- Table 93: United Kingdom Global Neuroprotective Agents Market Revenue (Million) Forecast, by Application 2019 & 2032
- Table 94: United Kingdom Global Neuroprotective Agents Market Volume (K Unit) Forecast, by Application 2019 & 2032
- Table 95: France Global Neuroprotective Agents Market Revenue (Million) Forecast, by Application 2019 & 2032
- Table 96: France Global Neuroprotective Agents Market Volume (K Unit) Forecast, by Application 2019 & 2032
- Table 97: Italy Global Neuroprotective Agents Market Revenue (Million) Forecast, by Application 2019 & 2032
- Table 98: Italy Global Neuroprotective Agents Market Volume (K Unit) Forecast, by Application 2019 & 2032
- Table 99: Spain Global Neuroprotective Agents Market Revenue (Million) Forecast, by Application 2019 & 2032
- Table 100: Spain Global Neuroprotective Agents Market Volume (K Unit) Forecast, by Application 2019 & 2032
- Table 101: Rest of Europe Global Neuroprotective Agents Market Revenue (Million) Forecast, by Application 2019 & 2032
- Table 102: Rest of Europe Global Neuroprotective Agents Market Volume (K Unit) Forecast, by Application 2019 & 2032
- Table 103: Global Neuroprotective Agents Market Revenue Million Forecast, by Drug Class 2019 & 2032
- Table 104: Global Neuroprotective Agents Market Volume K Unit Forecast, by Drug Class 2019 & 2032
- Table 105: Global Neuroprotective Agents Market Revenue Million Forecast, by Application 2019 & 2032
- Table 106: Global Neuroprotective Agents Market Volume K Unit Forecast, by Application 2019 & 2032
- Table 107: Global Neuroprotective Agents Market Revenue Million Forecast, by Route of Administration 2019 & 2032
- Table 108: Global Neuroprotective Agents Market Volume K Unit Forecast, by Route of Administration 2019 & 2032
- Table 109: Global Neuroprotective Agents Market Revenue Million Forecast, by Distribution Cahnnel 2019 & 2032
- Table 110: Global Neuroprotective Agents Market Volume K Unit Forecast, by Distribution Cahnnel 2019 & 2032
- Table 111: Global Neuroprotective Agents Market Revenue Million Forecast, by Country 2019 & 2032
- Table 112: Global Neuroprotective Agents Market Volume K Unit Forecast, by Country 2019 & 2032
- Table 113: China Global Neuroprotective Agents Market Revenue (Million) Forecast, by Application 2019 & 2032
- Table 114: China Global Neuroprotective Agents Market Volume (K Unit) Forecast, by Application 2019 & 2032
- Table 115: Japan Global Neuroprotective Agents Market Revenue (Million) Forecast, by Application 2019 & 2032
- Table 116: Japan Global Neuroprotective Agents Market Volume (K Unit) Forecast, by Application 2019 & 2032
- Table 117: India Global Neuroprotective Agents Market Revenue (Million) Forecast, by Application 2019 & 2032
- Table 118: India Global Neuroprotective Agents Market Volume (K Unit) Forecast, by Application 2019 & 2032
- Table 119: Australia Global Neuroprotective Agents Market Revenue (Million) Forecast, by Application 2019 & 2032
- Table 120: Australia Global Neuroprotective Agents Market Volume (K Unit) Forecast, by Application 2019 & 2032
- Table 121: South Korea Global Neuroprotective Agents Market Revenue (Million) Forecast, by Application 2019 & 2032
- Table 122: South Korea Global Neuroprotective Agents Market Volume (K Unit) Forecast, by Application 2019 & 2032
- Table 123: Rest of Asia Pacific Global Neuroprotective Agents Market Revenue (Million) Forecast, by Application 2019 & 2032
- Table 124: Rest of Asia Pacific Global Neuroprotective Agents Market Volume (K Unit) Forecast, by Application 2019 & 2032
- Table 125: Global Neuroprotective Agents Market Revenue Million Forecast, by Drug Class 2019 & 2032
- Table 126: Global Neuroprotective Agents Market Volume K Unit Forecast, by Drug Class 2019 & 2032
- Table 127: Global Neuroprotective Agents Market Revenue Million Forecast, by Application 2019 & 2032
- Table 128: Global Neuroprotective Agents Market Volume K Unit Forecast, by Application 2019 & 2032
- Table 129: Global Neuroprotective Agents Market Revenue Million Forecast, by Route of Administration 2019 & 2032
- Table 130: Global Neuroprotective Agents Market Volume K Unit Forecast, by Route of Administration 2019 & 2032
- Table 131: Global Neuroprotective Agents Market Revenue Million Forecast, by Distribution Cahnnel 2019 & 2032
- Table 132: Global Neuroprotective Agents Market Volume K Unit Forecast, by Distribution Cahnnel 2019 & 2032
- Table 133: Global Neuroprotective Agents Market Revenue Million Forecast, by Country 2019 & 2032
- Table 134: Global Neuroprotective Agents Market Volume K Unit Forecast, by Country 2019 & 2032
- Table 135: GCC Global Neuroprotective Agents Market Revenue (Million) Forecast, by Application 2019 & 2032
- Table 136: GCC Global Neuroprotective Agents Market Volume (K Unit) Forecast, by Application 2019 & 2032
- Table 137: South Africa Global Neuroprotective Agents Market Revenue (Million) Forecast, by Application 2019 & 2032
- Table 138: South Africa Global Neuroprotective Agents Market Volume (K Unit) Forecast, by Application 2019 & 2032
- Table 139: Rest of Middle East and Africa Global Neuroprotective Agents Market Revenue (Million) Forecast, by Application 2019 & 2032
- Table 140: Rest of Middle East and Africa Global Neuroprotective Agents Market Volume (K Unit) Forecast, by Application 2019 & 2032
- Table 141: Global Neuroprotective Agents Market Revenue Million Forecast, by Drug Class 2019 & 2032
- Table 142: Global Neuroprotective Agents Market Volume K Unit Forecast, by Drug Class 2019 & 2032
- Table 143: Global Neuroprotective Agents Market Revenue Million Forecast, by Application 2019 & 2032
- Table 144: Global Neuroprotective Agents Market Volume K Unit Forecast, by Application 2019 & 2032
- Table 145: Global Neuroprotective Agents Market Revenue Million Forecast, by Route of Administration 2019 & 2032
- Table 146: Global Neuroprotective Agents Market Volume K Unit Forecast, by Route of Administration 2019 & 2032
- Table 147: Global Neuroprotective Agents Market Revenue Million Forecast, by Distribution Cahnnel 2019 & 2032
- Table 148: Global Neuroprotective Agents Market Volume K Unit Forecast, by Distribution Cahnnel 2019 & 2032
- Table 149: Global Neuroprotective Agents Market Revenue Million Forecast, by Country 2019 & 2032
- Table 150: Global Neuroprotective Agents Market Volume K Unit Forecast, by Country 2019 & 2032
- Table 151: Brazil Global Neuroprotective Agents Market Revenue (Million) Forecast, by Application 2019 & 2032
- Table 152: Brazil Global Neuroprotective Agents Market Volume (K Unit) Forecast, by Application 2019 & 2032
- Table 153: Argentina Global Neuroprotective Agents Market Revenue (Million) Forecast, by Application 2019 & 2032
- Table 154: Argentina Global Neuroprotective Agents Market Volume (K Unit) Forecast, by Application 2019 & 2032
- Table 155: Rest of South America Global Neuroprotective Agents Market Revenue (Million) Forecast, by Application 2019 & 2032
- Table 156: Rest of South America Global Neuroprotective Agents Market Volume (K Unit) Forecast, by Application 2019 & 2032
Frequently Asked Questions
1. What is the projected Compound Annual Growth Rate (CAGR) of the Global Neuroprotective Agents Market?
The projected CAGR is approximately 6.70%.
2. Which companies are prominent players in the Global Neuroprotective Agents Market?
Key companies in the market include Sunovion Pharmaceuticals Inc, Merck KGaA, Bioniz Theraputics, GlaxoSmithKline plc, Neuren Pharmaceuticals, Teva Pharmaceutical Industries Ltd, Novartis Pharmaceuticals Corporation, Sun Pharmaceutical Industries Ltd, Genervon Biopharmaceuticals LLC, Hikma Pharmaceuticals PLC, Pfizer Inc.
3. What are the main segments of the Global Neuroprotective Agents Market?
The market segments include Drug Class, Application, Route of Administration, Distribution Cahnnel.
4. Can you provide details about the market size?
The market size is estimated to be USD XX Million as of 2022.
5. What are some drivers contributing to market growth?
Increase in Incidence and Prevalence of Neurodegenerative Diseases; Increase in Stroke and Traumatic Central Nervous System Injuries; Rising Awareness for Neuroprotective Agents.
6. What are the notable trends driving market growth?
The Alzheimer's disease Segment is Expected to Hold a Major Market Share in the Neuroprotective Agents Market.
7. Are there any restraints impacting market growth?
Failure of Clinical Trails in Neuroprotective Productline.; Strigent Regulatory Approvals.
8. Can you provide examples of recent developments in the market?
In August 2022, BrainStorm submitted a Biologics License Application (BLA) to the Food and Drug Administration for NurOwn as a potential treatment for ALS.
9. What pricing options are available for accessing the report?
Pricing options include single-user, multi-user, and enterprise licenses priced at USD 4750, USD 5250, and USD 8750 respectively.
10. Is the market size provided in terms of value or volume?
The market size is provided in terms of value, measured in Million and volume, measured in K Unit.
11. Are there any specific market keywords associated with the report?
Yes, the market keyword associated with the report is "Global Neuroprotective Agents Market," which aids in identifying and referencing the specific market segment covered.
12. How do I determine which pricing option suits my needs best?
The pricing options vary based on user requirements and access needs. Individual users may opt for single-user licenses, while businesses requiring broader access may choose multi-user or enterprise licenses for cost-effective access to the report.
13. Are there any additional resources or data provided in the Global Neuroprotective Agents Market report?
While the report offers comprehensive insights, it's advisable to review the specific contents or supplementary materials provided to ascertain if additional resources or data are available.
14. How can I stay updated on further developments or reports in the Global Neuroprotective Agents Market?
To stay informed about further developments, trends, and reports in the Global Neuroprotective Agents Market, consider subscribing to industry newsletters, following relevant companies and organizations, or regularly checking reputable industry news sources and publications.
Methodology
Step 1 - Identification of Relevant Samples Size from Population Database


Step 2 - Approaches for Defining Global Market Size (Value, Volume* & Price*)

Note*: In applicable scenarios
Step 3 - Data Sources
Primary Research
- Web Analytics
- Survey Reports
- Research Institute
- Latest Research Reports
- Opinion Leaders
Secondary Research
- Annual Reports
- White Paper
- Latest Press Release
- Industry Association
- Paid Database
- Investor Presentations

Step 4 - Data Triangulation
Involves using different sources of information in order to increase the validity of a study
These sources are likely to be stakeholders in a program - participants, other researchers, program staff, other community members, and so on.
Then we put all data in single framework & apply various statistical tools to find out the dynamic on the market.
During the analysis stage, feedback from the stakeholder groups would be compared to determine areas of agreement as well as areas of divergence


