

Key Insights
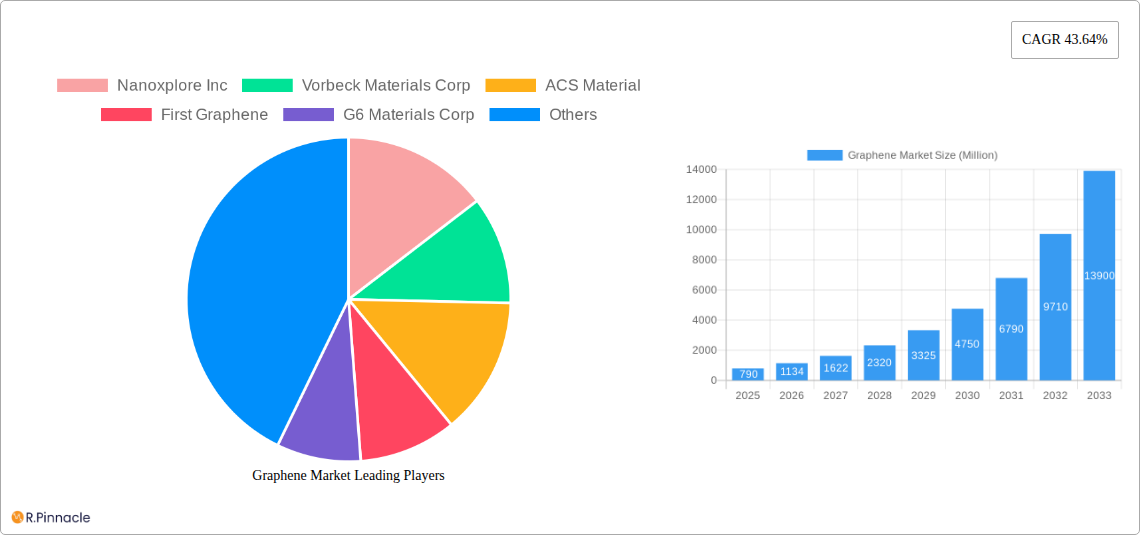
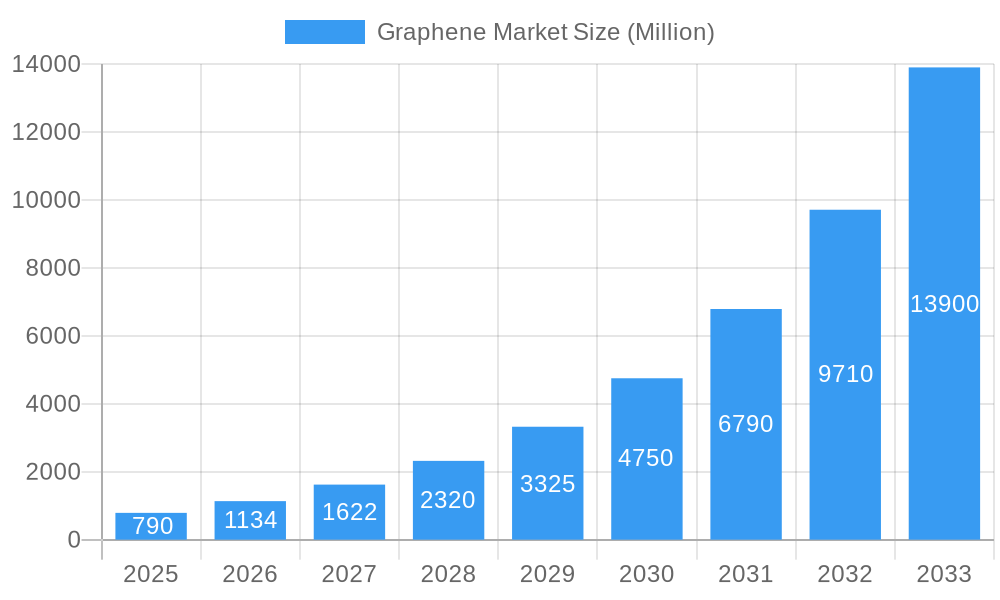
The graphene market, valued at $0.79 billion in 2025, is experiencing explosive growth, projected to expand at a compound annual growth rate (CAGR) of 43.64% from 2025 to 2033. This remarkable expansion is driven by the material's exceptional properties—high strength, conductivity, and flexibility—making it ideal for diverse applications across various sectors. Key drivers include the increasing demand for lightweight and high-performance materials in electronics, particularly in advanced semiconductors and flexible displays. The burgeoning biomedical and healthcare industry is another significant contributor, with graphene's potential in drug delivery systems, biosensors, and regenerative medicine fueling substantial investment. Furthermore, the energy sector is leveraging graphene's superior conductivity for enhanced battery performance and energy storage solutions, further accelerating market growth. Growth is also spurred by advancements in graphene production techniques, leading to lower costs and wider accessibility. However, challenges remain, including the scalability of high-quality graphene production and the need for further research to fully understand its long-term effects in various applications. Despite these hurdles, the inherent advantages of graphene, coupled with continuous technological innovation, strongly suggest a robust and sustained expansion of this market in the coming years.
Graphene Market Market Size (In Million)
The segmentation of the graphene market reveals strong growth potential across various product types and end-user industries. Graphene sheets and films currently dominate the product type segment, benefiting from established applications and relatively mature production techniques. However, nanoribbons and nanoplatelets are emerging as high-growth segments, driven by their unique properties suitable for specialized applications in electronics and energy storage. The electronics and telecommunications industry currently leads in end-user adoption, with significant investments in research and development for integrating graphene into next-generation devices. However, the bio-medical and healthcare sectors are experiencing rapid growth due to graphene's potential in developing innovative diagnostic tools and therapeutic interventions. Geographical distribution shows significant market presence across Asia Pacific, particularly China and India, fueled by strong government support and substantial manufacturing capabilities. North America and Europe also hold significant market shares, driven by robust R&D activities and early adoption of graphene-based technologies. The ongoing expansion into other regions, especially South America and the Middle East and Africa, promises further market expansion.
Graphene Market Company Market Share
Graphene Market Report: A Comprehensive Analysis (2019-2033)
This in-depth report provides a comprehensive analysis of the Graphene Market, offering valuable insights for industry professionals, investors, and researchers. Covering the period from 2019 to 2033, with a focus on 2025, this report delves into market dynamics, segmentation, key players, and future growth potential. The report leverages extensive data analysis and expert insights to offer actionable intelligence. The total market value is projected to reach xx Million by 2033.
Graphene Market Structure & Innovation Trends
This section analyzes the competitive landscape of the graphene market, including market concentration, innovation drivers, regulatory frameworks, product substitutes, end-user demographics, and M&A activities. The market is characterized by a relatively fragmented landscape with numerous players vying for market share. However, several large companies are emerging as significant players.
- Market Concentration: The market exhibits a moderately fragmented structure, with no single dominant player controlling a significant portion of the market share in 2025. The top 5 players collectively hold approximately xx% of the market.
- Innovation Drivers: Key drivers include advancements in production techniques leading to cost reduction, expanding applications across diverse industries, and ongoing research & development efforts focused on enhancing graphene properties.
- Regulatory Frameworks: Government support for graphene research and development, coupled with evolving industry standards, significantly impacts market growth. However, the lack of standardized regulations in some regions poses a challenge.
- Product Substitutes: Existing materials like carbon nanotubes and other advanced materials present competitive challenges. However, the unique properties of graphene provide a strong competitive advantage in specific applications.
- End-User Demographics: The electronics and telecommunication sector currently dominates, followed by the biomedical and healthcare sector. The expanding applications in energy storage and aerospace & defense are driving substantial growth.
- M&A Activities: Recent mergers and acquisitions, such as the March 2023 acquisition of Applied Graphene Materials by Universal Matter, indicate increasing consolidation within the industry. The total value of M&A deals within the past five years is estimated at xx Million.
Graphene Market Dynamics & Trends
The Graphene Market is witnessing robust growth, driven by technological advancements, increasing demand across diverse sectors, and strategic collaborations within the industry. The Compound Annual Growth Rate (CAGR) is projected at xx% during the forecast period (2025-2033). Market penetration in key sectors like electronics and energy is gradually increasing, with a projected penetration rate of xx% by 2033.
Several factors contribute to this growth, including:
- Technological Disruptions: Innovations in graphene production, such as the development of scalable and cost-effective manufacturing processes, are paving the way for wider adoption across numerous applications.
- Consumer Preferences: Growing demand for high-performance materials with superior properties is further fueling market expansion.
- Competitive Dynamics: Increased competition is driving innovation, leading to the development of new products and applications, ultimately benefiting consumers and various industries.
Dominant Regions & Segments in Graphene Market
This section analyzes regional and segmental dominance within the Graphene Market.
Dominant Regions: North America and Asia-Pacific currently hold significant market shares, driven by strong research and development activities, substantial investments, and a well-established manufacturing base. Europe also holds a significant market share.
Dominant Segments:
- Product Type: Graphene sheets and films currently dominate the product type segment due to their wide applicability and established manufacturing processes. Nanoplatelets and Graphene Oxide are also experiencing significant growth.
- End-user Industry: The electronics and telecommunication sector holds the largest share, driven by the increasing demand for advanced materials in consumer electronics, 5G infrastructure, and other high-tech applications. The biomedical and healthcare sector is also experiencing considerable growth due to the unique properties of graphene in drug delivery and biosensing.
Key Drivers (by Region/Segment):
- North America: Strong government support for R&D, a robust technological infrastructure, and high consumer demand.
- Asia-Pacific: Cost-effective manufacturing, increasing production capacity, and substantial investments from both governments and private entities.
- Europe: A strong focus on sustainability and innovation within the material science sector.
Graphene Market Product Innovations
Recent product innovations are revolutionizing the graphene landscape by focusing on tailored enhancements of its inherent properties for increasingly specialized applications. Breakthroughs in sophisticated functionalization techniques are significantly improving graphene's dispersion within diverse matrices, enabling seamless integration and unlocking its full potential. This progress is directly driving the development of next-generation, high-performance composites with unparalleled strength-to-weight ratios, significantly more efficient and longer-lasting advanced battery technologies, and entirely novel electronic devices with enhanced conductivity and flexibility. These advancements are not only broadening the scope of graphene's applicability but are also solidifying the competitive edge of graphene-based products, pushing the boundaries of what's possible across numerous industries.
Report Scope & Segmentation Analysis
This report segments the Graphene Market based on product type and end-user industry.
Product Type: The report provides detailed analysis and growth projections for Graphene Sheets and Films, Nanoribbons, Nanoplatelets, Graphene Oxide, and Other Product Types. Market sizes for each segment are estimated for the historical period, base year, and forecast period.
End-user Industry: The report analyzes the market size and growth projections for Electronics and Telecommunication, Bio-medical and Healthcare, Energy, Aerospace and Defense, and Other End-user Industries. Competitive dynamics within each segment are also discussed.
Key Drivers of Graphene Market Growth
The graphene market's growth is fueled by technological advancements, increasing demand in various sectors, and supportive government policies. The development of cost-effective production methods, coupled with ongoing research into new applications, continues to drive market expansion. Furthermore, government initiatives promoting the use of advanced materials in key sectors provide further impetus to the market's growth trajectory.
Challenges in the Graphene Market Sector
Challenges in the graphene market include the relatively high cost of production, inconsistencies in graphene quality, and the lack of widely adopted industry standards. Supply chain management also poses a challenge, affecting market accessibility. Overcoming these challenges is crucial for realizing graphene's full potential.
Emerging Opportunities in Graphene Market
The graphene market is ripe with emerging opportunities, driven by continuous exploration into novel application frontiers. Key growth areas include the burgeoning field of flexible electronics, where graphene's unique electrical and mechanical properties are paving the way for innovative wearable devices and bendable displays. Furthermore, its exceptional surface area and conductivity make it a promising material for advanced water purification systems, offering highly efficient filtration and contaminant removal. The development of highly sensitive and responsive advanced sensors, from biomedical diagnostics to environmental monitoring, also presents a significant avenue for growth. Beyond these specific applications, the creation of innovative graphene-based composite materials, engineered for specific performance requirements in sectors like aerospace and automotive, and the advancement of next-generation energy storage solutions, including supercapacitors and solid-state batteries, hold immense potential. Strategic expansion into new geographical markets and fostering robust partnerships between leading research institutions and pioneering industries will be pivotal in accelerating this growth trajectory and solidifying graphene's position as a transformative material.
Leading Players in the Graphene Market Market
- Nanoxplore Inc.
- Vorbeck Materials Corp.
- ACS Material
- First Graphene Ltd.
- G6 Materials Corp.
- Changzhou Two-Dimensional Carbon Technology Co. Ltd.
- Morsh (Ningbo Moxi Technology Co. Ltd.)
- The Sixth Element (Changzhou) Materials Technology Co. Ltd.
- Perpetuus Advanced Materials PLC
- Xiamen Knano Graphene Technology Corporation Limited
- NeoGraf Solutions
- Universal Matter Inc.
- Grafoid Inc.
- Graphene Production (often refers to various manufacturers and their output)
- Global Graphene Group
- Graphenano Group
- Thomas Swan & Co. Ltd.
- Haydale Graphene Industries PLC
- Graphenea
- Elcora Advanced Materials Corp.
- Versarien PLC
- Graphene Manufacturing Group Ltd.
Key Developments in Graphene Market Industry
- March 2023: Universal Matter Inc. acquired Applied Graphene Materials, strengthening its market position.
- February 2023: Global Graphene Group's Honeycomb Battery Company partnered with Nubia Brand International Corp. to develop graphene-based battery materials.
Future Outlook for Graphene Market Market
The future of the graphene market appears promising, with strong growth potential driven by continuous technological advancements, expanding applications, and increasing investments in research and development. The market is poised to experience significant growth in the coming years, driven by the increasing adoption of graphene across diverse sectors and the development of innovative graphene-based products.
Graphene Market Segmentation
-
1. Product Type
- 1.1. Graphene Sheets and Films
- 1.2. Nanoribbons
- 1.3. Nanoplatelets
- 1.4. Graphene Oxide
- 1.5. Other Product Types
-
2. End-user Industry
- 2.1. Electronics and Telecommunication
- 2.2. Bio-medical and Healthcare
- 2.3. Energy
- 2.4. Aerospace and Defense
- 2.5. Other End-user Industries
Graphene Market Segmentation By Geography
-
1. Asia Pacific
- 1.1. China
- 1.2. India
- 1.3. Japan
- 1.4. South Korea
- 1.5. Malaysia
- 1.6. Thailand
- 1.7. Indonesia
- 1.8. Vietnam
- 1.9. Rest of Asia Pacific
-
2. North America
- 2.1. United States
- 2.2. Canada
- 2.3. Mexico
-
3. Europe
- 3.1. Germany
- 3.2. United Kingdom
- 3.3. France
- 3.4. Italy
- 3.5. Spain
- 3.6. NORDIC Countries
- 3.7. Turkey
- 3.8. Russia
- 3.9. Rest of Europe
-
4. South America
- 4.1. Brazil
- 4.2. Argentina
- 4.3. Colombia
- 4.4. Rest of South America
-
5. Middle East and Africa
- 5.1. Saudi Arabia
- 5.2. Qatar
- 5.3. United Arab Emirates
- 5.4. Nigeria
- 5.5. Egypt
- 5.6. South Africa
- 5.7. Rest of Middle East and Africa
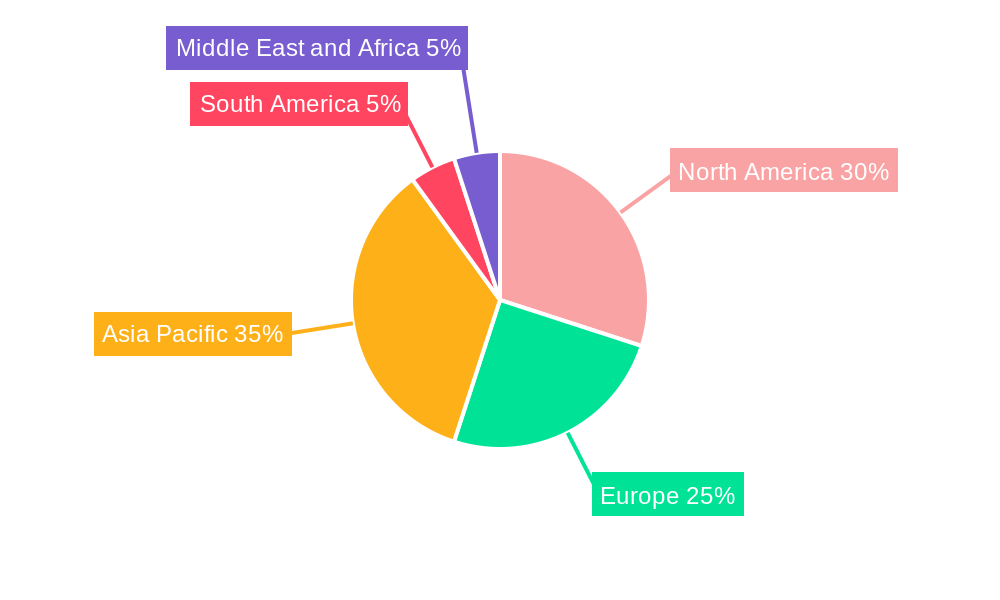
Graphene Market Regional Market Share
Geographic Coverage of Graphene Market
Graphene Market REPORT HIGHLIGHTS
| Aspects | Details |
|---|---|
| Study Period | 2020-2034 |
| Base Year | 2025 |
| Estimated Year | 2026 |
| Forecast Period | 2026-2034 |
| Historical Period | 2020-2025 |
| Growth Rate | CAGR of 43.64% from 2020-2034 |
| Segmentation |
|
Table of Contents
- 1. Introduction
- 1.1. Research Scope
- 1.2. Market Segmentation
- 1.3. Research Objective
- 1.4. Definitions and Assumptions
- 2. Executive Summary
- 2.1. Market Snapshot
- 3. Market Dynamics
- 3.1. Market Drivers
- 3.2. Market Restrains
- 3.3. Market Trends
- 3.4. Market Opportunities
- 4. Market Factor Analysis
- 4.1. Porters Five Forces
- 4.1.1. Bargaining Power of Suppliers
- 4.1.2. Bargaining Power of Buyers
- 4.1.3. Threat of New Entrants
- 4.1.4. Threat of Substitutes
- 4.1.5. Competitive Rivalry
- 4.2. PESTEL analysis
- 4.3. BCG Analysis
- 4.3.1. Stars (High Growth, High Market Share)
- 4.3.2. Cash Cows (Low Growth, High Market Share)
- 4.3.3. Question Mark (High Growth, Low Market Share)
- 4.3.4. Dogs (Low Growth, Low Market Share)
- 4.4. Ansoff Matrix Analysis
- 4.5. Supply Chain Analysis
- 4.6. Regulatory Landscape
- 4.7. Current Market Potential and Opportunity Assessment (TAM–SAM–SOM Framework)
- 4.8. PRI Analyst Note
- 4.1. Porters Five Forces
- 5. Market Analysis, Insights and Forecast 2021-2033
- 5.1. Market Analysis, Insights and Forecast - by Product Type
- 5.1.1. Graphene Sheets and Films
- 5.1.2. Nanoribbons
- 5.1.3. Nanoplatelets
- 5.1.4. Graphene Oxide
- 5.1.5. Other Product Types
- 5.2. Market Analysis, Insights and Forecast - by End-user Industry
- 5.2.1. Electronics and Telecommunication
- 5.2.2. Bio-medical and Healthcare
- 5.2.3. Energy
- 5.2.4. Aerospace and Defense
- 5.2.5. Other End-user Industries
- 5.3. Market Analysis, Insights and Forecast - by Region
- 5.3.1. Asia Pacific
- 5.3.2. North America
- 5.3.3. Europe
- 5.3.4. South America
- 5.3.5. Middle East and Africa
- 5.1. Market Analysis, Insights and Forecast - by Product Type
- 6. Global Graphene Market Analysis, Insights and Forecast, 2021-2033
- 6.1. Market Analysis, Insights and Forecast - by Product Type
- 6.1.1. Graphene Sheets and Films
- 6.1.2. Nanoribbons
- 6.1.3. Nanoplatelets
- 6.1.4. Graphene Oxide
- 6.1.5. Other Product Types
- 6.2. Market Analysis, Insights and Forecast - by End-user Industry
- 6.2.1. Electronics and Telecommunication
- 6.2.2. Bio-medical and Healthcare
- 6.2.3. Energy
- 6.2.4. Aerospace and Defense
- 6.2.5. Other End-user Industries
- 6.1. Market Analysis, Insights and Forecast - by Product Type
- 7. Asia Pacific Graphene Market Analysis, Insights and Forecast, 2020-2032
- 7.1. Market Analysis, Insights and Forecast - by Product Type
- 7.1.1. Graphene Sheets and Films
- 7.1.2. Nanoribbons
- 7.1.3. Nanoplatelets
- 7.1.4. Graphene Oxide
- 7.1.5. Other Product Types
- 7.2. Market Analysis, Insights and Forecast - by End-user Industry
- 7.2.1. Electronics and Telecommunication
- 7.2.2. Bio-medical and Healthcare
- 7.2.3. Energy
- 7.2.4. Aerospace and Defense
- 7.2.5. Other End-user Industries
- 7.1. Market Analysis, Insights and Forecast - by Product Type
- 8. North America Graphene Market Analysis, Insights and Forecast, 2020-2032
- 8.1. Market Analysis, Insights and Forecast - by Product Type
- 8.1.1. Graphene Sheets and Films
- 8.1.2. Nanoribbons
- 8.1.3. Nanoplatelets
- 8.1.4. Graphene Oxide
- 8.1.5. Other Product Types
- 8.2. Market Analysis, Insights and Forecast - by End-user Industry
- 8.2.1. Electronics and Telecommunication
- 8.2.2. Bio-medical and Healthcare
- 8.2.3. Energy
- 8.2.4. Aerospace and Defense
- 8.2.5. Other End-user Industries
- 8.1. Market Analysis, Insights and Forecast - by Product Type
- 9. Europe Graphene Market Analysis, Insights and Forecast, 2020-2032
- 9.1. Market Analysis, Insights and Forecast - by Product Type
- 9.1.1. Graphene Sheets and Films
- 9.1.2. Nanoribbons
- 9.1.3. Nanoplatelets
- 9.1.4. Graphene Oxide
- 9.1.5. Other Product Types
- 9.2. Market Analysis, Insights and Forecast - by End-user Industry
- 9.2.1. Electronics and Telecommunication
- 9.2.2. Bio-medical and Healthcare
- 9.2.3. Energy
- 9.2.4. Aerospace and Defense
- 9.2.5. Other End-user Industries
- 9.1. Market Analysis, Insights and Forecast - by Product Type
- 10. South America Graphene Market Analysis, Insights and Forecast, 2020-2032
- 10.1. Market Analysis, Insights and Forecast - by Product Type
- 10.1.1. Graphene Sheets and Films
- 10.1.2. Nanoribbons
- 10.1.3. Nanoplatelets
- 10.1.4. Graphene Oxide
- 10.1.5. Other Product Types
- 10.2. Market Analysis, Insights and Forecast - by End-user Industry
- 10.2.1. Electronics and Telecommunication
- 10.2.2. Bio-medical and Healthcare
- 10.2.3. Energy
- 10.2.4. Aerospace and Defense
- 10.2.5. Other End-user Industries
- 10.1. Market Analysis, Insights and Forecast - by Product Type
- 11. Middle East and Africa Graphene Market Analysis, Insights and Forecast, 2020-2032
- 11.1. Market Analysis, Insights and Forecast - by Product Type
- 11.1.1. Graphene Sheets and Films
- 11.1.2. Nanoribbons
- 11.1.3. Nanoplatelets
- 11.1.4. Graphene Oxide
- 11.1.5. Other Product Types
- 11.2. Market Analysis, Insights and Forecast - by End-user Industry
- 11.2.1. Electronics and Telecommunication
- 11.2.2. Bio-medical and Healthcare
- 11.2.3. Energy
- 11.2.4. Aerospace and Defense
- 11.2.5. Other End-user Industries
- 11.1. Market Analysis, Insights and Forecast - by Product Type
- 12. Competitive Analysis
- 12.1. Company Profiles
- 12.1.1 Nanoxplore Inc
- 12.1.1.1. Company Overview
- 12.1.1.2. Products
- 12.1.1.3. Company Financials
- 12.1.1.4. SWOT Analysis
- 12.1.2 Vorbeck Materials Corp
- 12.1.2.1. Company Overview
- 12.1.2.2. Products
- 12.1.2.3. Company Financials
- 12.1.2.4. SWOT Analysis
- 12.1.3 ACS Material
- 12.1.3.1. Company Overview
- 12.1.3.2. Products
- 12.1.3.3. Company Financials
- 12.1.3.4. SWOT Analysis
- 12.1.4 First Graphene
- 12.1.4.1. Company Overview
- 12.1.4.2. Products
- 12.1.4.3. Company Financials
- 12.1.4.4. SWOT Analysis
- 12.1.5 G6 Materials Corp
- 12.1.5.1. Company Overview
- 12.1.5.2. Products
- 12.1.5.3. Company Financials
- 12.1.5.4. SWOT Analysis
- 12.1.6 Changzhou Two-Dimensional Carbon Technology Co Ltd
- 12.1.6.1. Company Overview
- 12.1.6.2. Products
- 12.1.6.3. Company Financials
- 12.1.6.4. SWOT Analysis
- 12.1.7 Morsh (Ningbo Moxi Technology Co Ltd)
- 12.1.7.1. Company Overview
- 12.1.7.2. Products
- 12.1.7.3. Company Financials
- 12.1.7.4. SWOT Analysis
- 12.1.8 The Sixth Element (Changzhou) Materials Technology Co Ltd
- 12.1.8.1. Company Overview
- 12.1.8.2. Products
- 12.1.8.3. Company Financials
- 12.1.8.4. SWOT Analysis
- 12.1.9 Perpetuus Advanced Materials PLC
- 12.1.9.1. Company Overview
- 12.1.9.2. Products
- 12.1.9.3. Company Financials
- 12.1.9.4. SWOT Analysis
- 12.1.10 Xiamen Knano Graphene Technology Corporation Limited*List Not Exhaustive
- 12.1.10.1. Company Overview
- 12.1.10.2. Products
- 12.1.10.3. Company Financials
- 12.1.10.4. SWOT Analysis
- 12.1.11 Neograf
- 12.1.11.1. Company Overview
- 12.1.11.2. Products
- 12.1.11.3. Company Financials
- 12.1.11.4. SWOT Analysis
- 12.1.12 Universal Matter
- 12.1.12.1. Company Overview
- 12.1.12.2. Products
- 12.1.12.3. Company Financials
- 12.1.12.4. SWOT Analysis
- 12.1.13 Grafoid Inc
- 12.1.13.1. Company Overview
- 12.1.13.2. Products
- 12.1.13.3. Company Financials
- 12.1.13.4. SWOT Analysis
- 12.1.14 Graphene Production
- 12.1.14.1. Company Overview
- 12.1.14.2. Products
- 12.1.14.3. Company Financials
- 12.1.14.4. SWOT Analysis
- 12.1.15 Global Graphene Group
- 12.1.15.1. Company Overview
- 12.1.15.2. Products
- 12.1.15.3. Company Financials
- 12.1.15.4. SWOT Analysis
- 12.1.16 Graphenano Group
- 12.1.16.1. Company Overview
- 12.1.16.2. Products
- 12.1.16.3. Company Financials
- 12.1.16.4. SWOT Analysis
- 12.1.17 Thomas Swan & Co Ltd
- 12.1.17.1. Company Overview
- 12.1.17.2. Products
- 12.1.17.3. Company Financials
- 12.1.17.4. SWOT Analysis
- 12.1.18 Haydale Graphene Industries PLC
- 12.1.18.1. Company Overview
- 12.1.18.2. Products
- 12.1.18.3. Company Financials
- 12.1.18.4. SWOT Analysis
- 12.1.19 Graphenea
- 12.1.19.1. Company Overview
- 12.1.19.2. Products
- 12.1.19.3. Company Financials
- 12.1.19.4. SWOT Analysis
- 12.1.20 Elcora Advanced Materials Corp
- 12.1.20.1. Company Overview
- 12.1.20.2. Products
- 12.1.20.3. Company Financials
- 12.1.20.4. SWOT Analysis
- 12.1.21 Versarien PLC
- 12.1.21.1. Company Overview
- 12.1.21.2. Products
- 12.1.21.3. Company Financials
- 12.1.21.4. SWOT Analysis
- 12.1.22 Graphene Manufacturing Group Ltd
- 12.1.22.1. Company Overview
- 12.1.22.2. Products
- 12.1.22.3. Company Financials
- 12.1.22.4. SWOT Analysis
- 12.1.1 Nanoxplore Inc
- 12.2. Market Entropy
- 12.2.1 Company's Key Areas Served
- 12.2.2 Recent Developments
- 12.3. Company Market Share Analysis 2025
- 12.3.1 Top 5 Companies Market Share Analysis
- 12.3.2 Top 3 Companies Market Share Analysis
- 12.4. List of Potential Customers
- 13. Research Methodology
List of Figures
- Figure 1: Global Graphene Market Revenue Breakdown (Million, %) by Region 2025 & 2033
- Figure 2: Asia Pacific Graphene Market Revenue (Million), by Product Type 2025 & 2033
- Figure 3: Asia Pacific Graphene Market Revenue Share (%), by Product Type 2025 & 2033
- Figure 4: Asia Pacific Graphene Market Revenue (Million), by End-user Industry 2025 & 2033
- Figure 5: Asia Pacific Graphene Market Revenue Share (%), by End-user Industry 2025 & 2033
- Figure 6: Asia Pacific Graphene Market Revenue (Million), by Country 2025 & 2033
- Figure 7: Asia Pacific Graphene Market Revenue Share (%), by Country 2025 & 2033
- Figure 8: North America Graphene Market Revenue (Million), by Product Type 2025 & 2033
- Figure 9: North America Graphene Market Revenue Share (%), by Product Type 2025 & 2033
- Figure 10: North America Graphene Market Revenue (Million), by End-user Industry 2025 & 2033
- Figure 11: North America Graphene Market Revenue Share (%), by End-user Industry 2025 & 2033
- Figure 12: North America Graphene Market Revenue (Million), by Country 2025 & 2033
- Figure 13: North America Graphene Market Revenue Share (%), by Country 2025 & 2033
- Figure 14: Europe Graphene Market Revenue (Million), by Product Type 2025 & 2033
- Figure 15: Europe Graphene Market Revenue Share (%), by Product Type 2025 & 2033
- Figure 16: Europe Graphene Market Revenue (Million), by End-user Industry 2025 & 2033
- Figure 17: Europe Graphene Market Revenue Share (%), by End-user Industry 2025 & 2033
- Figure 18: Europe Graphene Market Revenue (Million), by Country 2025 & 2033
- Figure 19: Europe Graphene Market Revenue Share (%), by Country 2025 & 2033
- Figure 20: South America Graphene Market Revenue (Million), by Product Type 2025 & 2033
- Figure 21: South America Graphene Market Revenue Share (%), by Product Type 2025 & 2033
- Figure 22: South America Graphene Market Revenue (Million), by End-user Industry 2025 & 2033
- Figure 23: South America Graphene Market Revenue Share (%), by End-user Industry 2025 & 2033
- Figure 24: South America Graphene Market Revenue (Million), by Country 2025 & 2033
- Figure 25: South America Graphene Market Revenue Share (%), by Country 2025 & 2033
- Figure 26: Middle East and Africa Graphene Market Revenue (Million), by Product Type 2025 & 2033
- Figure 27: Middle East and Africa Graphene Market Revenue Share (%), by Product Type 2025 & 2033
- Figure 28: Middle East and Africa Graphene Market Revenue (Million), by End-user Industry 2025 & 2033
- Figure 29: Middle East and Africa Graphene Market Revenue Share (%), by End-user Industry 2025 & 2033
- Figure 30: Middle East and Africa Graphene Market Revenue (Million), by Country 2025 & 2033
- Figure 31: Middle East and Africa Graphene Market Revenue Share (%), by Country 2025 & 2033
List of Tables
- Table 1: Global Graphene Market Revenue Million Forecast, by Product Type 2020 & 2033
- Table 2: Global Graphene Market Revenue Million Forecast, by End-user Industry 2020 & 2033
- Table 3: Global Graphene Market Revenue Million Forecast, by Region 2020 & 2033
- Table 4: Global Graphene Market Revenue Million Forecast, by Product Type 2020 & 2033
- Table 5: Global Graphene Market Revenue Million Forecast, by End-user Industry 2020 & 2033
- Table 6: Global Graphene Market Revenue Million Forecast, by Country 2020 & 2033
- Table 7: China Graphene Market Revenue (Million) Forecast, by Application 2020 & 2033
- Table 8: India Graphene Market Revenue (Million) Forecast, by Application 2020 & 2033
- Table 9: Japan Graphene Market Revenue (Million) Forecast, by Application 2020 & 2033
- Table 10: South Korea Graphene Market Revenue (Million) Forecast, by Application 2020 & 2033
- Table 11: Malaysia Graphene Market Revenue (Million) Forecast, by Application 2020 & 2033
- Table 12: Thailand Graphene Market Revenue (Million) Forecast, by Application 2020 & 2033
- Table 13: Indonesia Graphene Market Revenue (Million) Forecast, by Application 2020 & 2033
- Table 14: Vietnam Graphene Market Revenue (Million) Forecast, by Application 2020 & 2033
- Table 15: Rest of Asia Pacific Graphene Market Revenue (Million) Forecast, by Application 2020 & 2033
- Table 16: Global Graphene Market Revenue Million Forecast, by Product Type 2020 & 2033
- Table 17: Global Graphene Market Revenue Million Forecast, by End-user Industry 2020 & 2033
- Table 18: Global Graphene Market Revenue Million Forecast, by Country 2020 & 2033
- Table 19: United States Graphene Market Revenue (Million) Forecast, by Application 2020 & 2033
- Table 20: Canada Graphene Market Revenue (Million) Forecast, by Application 2020 & 2033
- Table 21: Mexico Graphene Market Revenue (Million) Forecast, by Application 2020 & 2033
- Table 22: Global Graphene Market Revenue Million Forecast, by Product Type 2020 & 2033
- Table 23: Global Graphene Market Revenue Million Forecast, by End-user Industry 2020 & 2033
- Table 24: Global Graphene Market Revenue Million Forecast, by Country 2020 & 2033
- Table 25: Germany Graphene Market Revenue (Million) Forecast, by Application 2020 & 2033
- Table 26: United Kingdom Graphene Market Revenue (Million) Forecast, by Application 2020 & 2033
- Table 27: France Graphene Market Revenue (Million) Forecast, by Application 2020 & 2033
- Table 28: Italy Graphene Market Revenue (Million) Forecast, by Application 2020 & 2033
- Table 29: Spain Graphene Market Revenue (Million) Forecast, by Application 2020 & 2033
- Table 30: NORDIC Countries Graphene Market Revenue (Million) Forecast, by Application 2020 & 2033
- Table 31: Turkey Graphene Market Revenue (Million) Forecast, by Application 2020 & 2033
- Table 32: Russia Graphene Market Revenue (Million) Forecast, by Application 2020 & 2033
- Table 33: Rest of Europe Graphene Market Revenue (Million) Forecast, by Application 2020 & 2033
- Table 34: Global Graphene Market Revenue Million Forecast, by Product Type 2020 & 2033
- Table 35: Global Graphene Market Revenue Million Forecast, by End-user Industry 2020 & 2033
- Table 36: Global Graphene Market Revenue Million Forecast, by Country 2020 & 2033
- Table 37: Brazil Graphene Market Revenue (Million) Forecast, by Application 2020 & 2033
- Table 38: Argentina Graphene Market Revenue (Million) Forecast, by Application 2020 & 2033
- Table 39: Colombia Graphene Market Revenue (Million) Forecast, by Application 2020 & 2033
- Table 40: Rest of South America Graphene Market Revenue (Million) Forecast, by Application 2020 & 2033
- Table 41: Global Graphene Market Revenue Million Forecast, by Product Type 2020 & 2033
- Table 42: Global Graphene Market Revenue Million Forecast, by End-user Industry 2020 & 2033
- Table 43: Global Graphene Market Revenue Million Forecast, by Country 2020 & 2033
- Table 44: Saudi Arabia Graphene Market Revenue (Million) Forecast, by Application 2020 & 2033
- Table 45: Qatar Graphene Market Revenue (Million) Forecast, by Application 2020 & 2033
- Table 46: United Arab Emirates Graphene Market Revenue (Million) Forecast, by Application 2020 & 2033
- Table 47: Nigeria Graphene Market Revenue (Million) Forecast, by Application 2020 & 2033
- Table 48: Egypt Graphene Market Revenue (Million) Forecast, by Application 2020 & 2033
- Table 49: South Africa Graphene Market Revenue (Million) Forecast, by Application 2020 & 2033
- Table 50: Rest of Middle East and Africa Graphene Market Revenue (Million) Forecast, by Application 2020 & 2033
Frequently Asked Questions
1. What is the projected Compound Annual Growth Rate (CAGR) of the Graphene Market?
The projected CAGR is approximately 43.64%.
2. Which companies are prominent players in the Graphene Market?
Key companies in the market include Nanoxplore Inc, Vorbeck Materials Corp, ACS Material, First Graphene, G6 Materials Corp, Changzhou Two-Dimensional Carbon Technology Co Ltd, Morsh (Ningbo Moxi Technology Co Ltd), The Sixth Element (Changzhou) Materials Technology Co Ltd, Perpetuus Advanced Materials PLC, Xiamen Knano Graphene Technology Corporation Limited*List Not Exhaustive, Neograf, Universal Matter, Grafoid Inc, Graphene Production, Global Graphene Group, Graphenano Group, Thomas Swan & Co Ltd, Haydale Graphene Industries PLC, Graphenea, Elcora Advanced Materials Corp, Versarien PLC, Graphene Manufacturing Group Ltd.
3. What are the main segments of the Graphene Market?
The market segments include Product Type, End-user Industry.
4. Can you provide details about the market size?
The market size is estimated to be USD 0.79 Million as of 2022.
5. What are some drivers contributing to market growth?
Graphene Aiding the Aerospace Industry; Rising Demand for Printed Electronics.
6. What are the notable trends driving market growth?
Electronics and Telecommunication Segment to Dominate the Market.
7. Are there any restraints impacting market growth?
Higher Costs of Technology.
8. Can you provide examples of recent developments in the market?
In March 2023, Universal Matter UK Limited, a wholly-owned subsidiary of Universal Matter Inc., announced the acquisition of Applied Graphene Materials UK Limited and Applied Graphene Materials LLC, the principal operating subsidiaries of Applied Graphene Materials PLC. Through the acquisition, the company has strengthened its market presence.
9. What pricing options are available for accessing the report?
Pricing options include single-user, multi-user, and enterprise licenses priced at USD 4750, USD 5250, and USD 8750 respectively.
10. Is the market size provided in terms of value or volume?
The market size is provided in terms of value, measured in Million.
11. Are there any specific market keywords associated with the report?
Yes, the market keyword associated with the report is "Graphene Market," which aids in identifying and referencing the specific market segment covered.
12. How do I determine which pricing option suits my needs best?
The pricing options vary based on user requirements and access needs. Individual users may opt for single-user licenses, while businesses requiring broader access may choose multi-user or enterprise licenses for cost-effective access to the report.
13. Are there any additional resources or data provided in the Graphene Market report?
While the report offers comprehensive insights, it's advisable to review the specific contents or supplementary materials provided to ascertain if additional resources or data are available.
14. How can I stay updated on further developments or reports in the Graphene Market?
To stay informed about further developments, trends, and reports in the Graphene Market, consider subscribing to industry newsletters, following relevant companies and organizations, or regularly checking reputable industry news sources and publications.
Methodology
Step 1 - Identification of Relevant Samples Size from Population Database


Step 2 - Approaches for Defining Global Market Size (Value, Volume* & Price*)

Note*: In applicable scenarios
Step 3 - Data Sources
Primary Research
- Web Analytics
- Survey Reports
- Research Institute
- Latest Research Reports
- Opinion Leaders
Secondary Research
- Annual Reports
- White Paper
- Latest Press Release
- Industry Association
- Paid Database
- Investor Presentations

Step 4 - Data Triangulation
Involves using different sources of information in order to increase the validity of a study
These sources are likely to be stakeholders in a program - participants, other researchers, program staff, other community members, and so on.
Then we put all data in single framework & apply various statistical tools to find out the dynamic on the market.
During the analysis stage, feedback from the stakeholder groups would be compared to determine areas of agreement as well as areas of divergence