

Key Insights
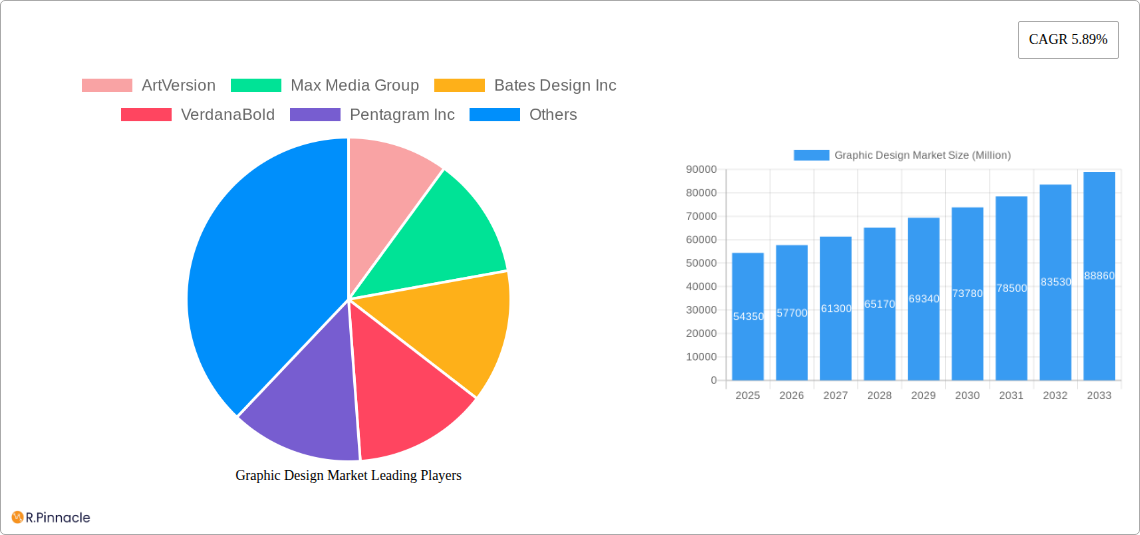
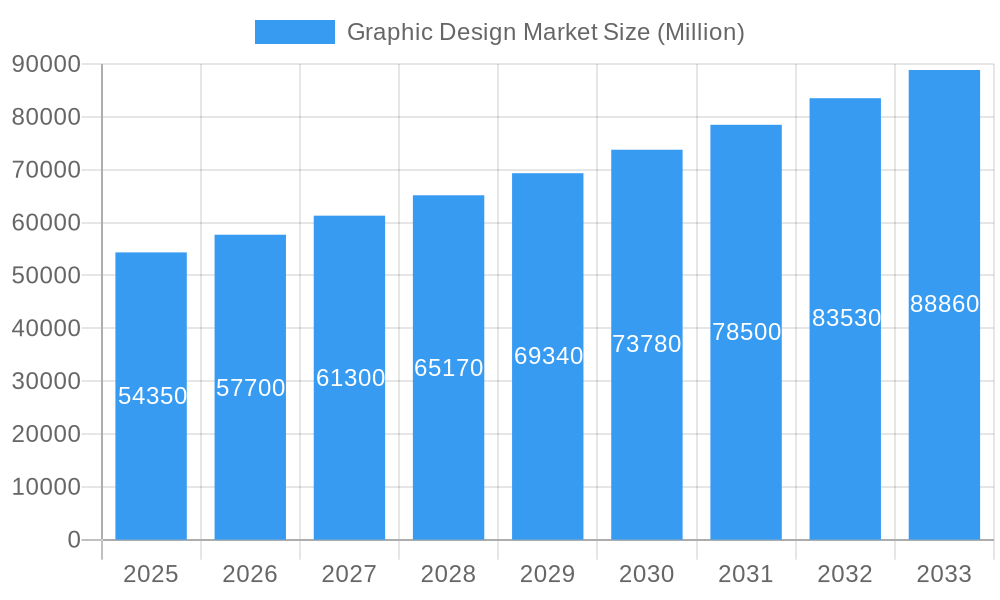
The global graphic design market, valued at $54.35 billion in 2025, is projected to experience robust growth, exhibiting a Compound Annual Growth Rate (CAGR) of 5.89% from 2025 to 2033. This expansion is fueled by several key drivers. The increasing demand for visually appealing content across diverse platforms—from websites and mobile apps to social media and print materials—is a primary factor. Businesses of all sizes, including SMEs and large enterprises, recognize the crucial role of effective visual communication in brand building, marketing, and customer engagement. The rise of digital design tools and platforms, offering accessibility and affordability, further contributes to market growth. Furthermore, evolving consumer preferences towards unique and personalized experiences drive demand for bespoke graphic design solutions. Growth segments include logo & brand identity design, app & digital design, and packaging & label design, all reflecting the evolving needs of a digitally-driven economy. While the market faces some restraints such as price competition and the availability of free or low-cost design resources, the overall positive trend signifies a promising outlook for the sector. The geographic distribution of market share is likely to see North America and Europe maintain a significant lead, while Asia-Pacific is poised for substantial growth, driven by increasing digital adoption and economic expansion in developing economies.
Graphic Design Market Market Size (In Billion)
The market segmentation reveals a dynamic landscape. Online design platforms offer convenience and scalability, catering to a wider range of clients. Offline design services, however, continue to hold relevance for complex projects requiring in-person collaboration. The SME segment represents a significant portion of the market, highlighting the importance of accessible and cost-effective design solutions for small businesses. Large enterprises utilize graphic design for comprehensive branding and marketing strategies, generating higher-value projects. Government and public sector organizations also contribute, driving demand for design services related to public awareness campaigns and official documentation. Key players in the market demonstrate a combination of established agencies and emerging digital platforms, underscoring the competitive and innovative nature of this sector. The continued growth in digital marketing, e-commerce, and brand awareness initiatives across all sectors indicates the ongoing importance and future potential of the graphic design market.
Graphic Design Market Company Market Share
Graphic Design Market: A Comprehensive Report (2019-2033)
This comprehensive report provides a detailed analysis of the Graphic Design Market, projecting a market value exceeding $XX Million by 2033. The study covers the historical period (2019-2024), the base year (2025), and the forecast period (2025-2033), offering actionable insights for industry professionals, investors, and businesses operating within this dynamic sector. The report analyzes market structure, dynamics, key players, and future growth opportunities, incorporating recent industry developments and technological advancements.
Graphic Design Market Market Structure & Innovation Trends
The Graphic Design Market is characterized by a moderately fragmented structure, with several key players vying for market share. ArtVersion, Max Media Group, Bates Design Inc, VerdanaBold, Pentagram Inc, ManyPixels Inc, Huge LLC, Duck Design Inc, DesignCrowd Inc, and Design Pickle Inc are some of the prominent companies, although the market also includes numerous smaller, independent designers and agencies. Market share is estimated at approximately xx% for the top 5 players in 2025, with the remaining share distributed across a large number of smaller firms. The market witnesses significant M&A activity, with deal values averaging $XX Million in recent years. Innovation is driven by advancements in software, hardware, and design methodologies, resulting in new tools, techniques, and design trends. Regulatory frameworks vary by region, influencing pricing, intellectual property protection, and ethical considerations. Substitute products, including AI-powered design tools, are emerging, but the demand for human creativity and nuanced design solutions remains strong. End-user demographics are diversifying, with increased demand from SMEs, large enterprises, and government organizations.
Graphic Design Market Market Dynamics & Trends
The Graphic Design Market is experiencing robust growth, driven by increasing demand for visually appealing content across various industries. The Compound Annual Growth Rate (CAGR) is projected to be xx% during the forecast period (2025-2033). Technological disruptions, such as the rise of AI-powered design tools and virtual and augmented reality applications, are reshaping the market landscape, increasing efficiency and opening new creative avenues. Consumer preferences are shifting towards minimalist designs, brand consistency, and personalized experiences. Competitive dynamics are intense, with companies focusing on differentiation through specialized services, innovative technologies, and strong brand building. Market penetration of online design platforms is steadily increasing, while offline design services continue to hold a significant portion of the market.
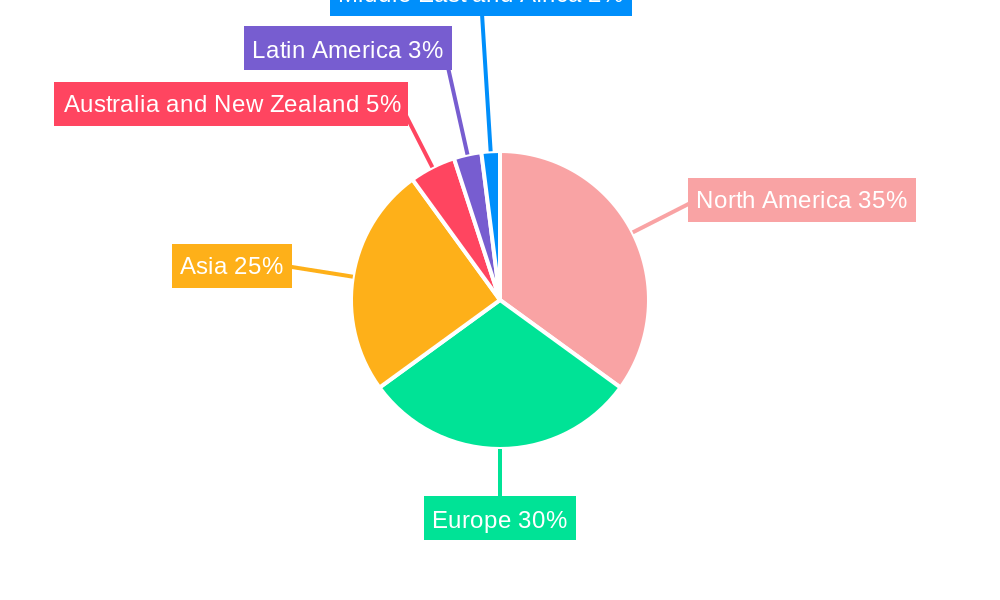
Dominant Regions & Segments in Graphic Design Market
North America and Europe currently hold the largest shares of the global graphic design market. However, Asia-Pacific is expected to witness the fastest growth rate. Key drivers include:
- North America: Strong economic growth, high adoption of new technologies, and a large number of design agencies.
- Europe: Established design industry, significant government spending on creative initiatives, and a sophisticated consumer base.
- Asia-Pacific: Rapid economic development, expanding digital infrastructure, and a large pool of young, skilled designers.
Within market segments, Logo & Brand Identity, App & Digital Design, and Advertising represent the largest segments by revenue. Online design platforms dominate the platform segment. SMEs currently constitute the largest end-user segment, driven by the increasing need for cost-effective and efficient design solutions. Growth is anticipated across all segments, driven by individual factors like increasing brand awareness, the proliferation of mobile apps, and digital marketing strategies.
Graphic Design Market Product Innovations
Recent innovations focus on enhancing design software capabilities, introducing AI-powered design tools, and improving workflow efficiency. New software releases offer advanced features, simplifying complex design tasks and boosting productivity. The integration of AI into design processes is revolutionizing creativity, allowing for automated tasks and personalized design experiences. These technological advancements improve both the speed and affordability of design services, improving market fit.
Report Scope & Segmentation Analysis
This report segments the Graphic Design Market based on Type (Logo & Brand Identity, App & Digital Design, Advertising, Clothing & Merchandise, Packaging & Label, Book & Magazine, Other Types), Platform (Online Design, Offline Design), and End-users (SMEs, Large Enterprises, Government). Each segment offers unique growth opportunities and competitive dynamics. For instance, the Logo & Brand Identity segment is expected to show a strong CAGR of xx%, driven by the increasing need for brand building. The App & Digital Design segment is also growing rapidly due to the increasing popularity of mobile apps and digital platforms. The growth in each segment varies, depending on its sensitivity to technological advancements and economic fluctuations.
Key Drivers of Graphic Design Market Growth
Several factors drive the Graphic Design Market's growth:
- Technological Advancements: AI-powered design tools are increasing efficiency and opening new creative avenues.
- Rising Demand for Visual Content: Businesses across industries rely heavily on visual communication to attract consumers and promote their products and services.
- Growth of Digital Marketing: The increasing adoption of digital marketing strategies is driving demand for graphic design services.
- Increased Brand Awareness: Businesses now recognize the importance of good design in building a strong brand identity.
Challenges in the Graphic Design Market Sector
Challenges include:
- Intense Competition: The market is highly competitive, with numerous players vying for market share, putting pressure on pricing.
- Fluctuations in Economic Conditions: Economic downturns can impact spending on non-essential services like graphic design.
- Maintaining Quality and Innovation: Staying ahead of the curve requires continuous investment in new technologies and design skills.
Emerging Opportunities in Graphic Design Market
Opportunities lie in:
- Expansion into New Markets: Emerging markets offer untapped potential for graphic design services.
- Development of Specialized Services: Offering niche services like UX/UI design or motion graphics can provide a competitive edge.
- Leveraging AI and Automation: Utilizing AI-powered tools to streamline processes and offer more affordable solutions.
Leading Players in the Graphic Design Market Market
- ArtVersion
- Max Media Group
- Bates Design Inc
- VerdanaBold
- Pentagram Inc
- ManyPixels Inc
- Huge LLC
- Duck Design Inc
- DesignCrowd Inc
- Design Pickle Inc
- List Not Exhaustive
Key Developments in Graphic Design Market Industry
- July 2024: Adobe announced breakthrough innovations in Adobe Illustrator and Photoshop, enhancing design workflows and providing creators with more control.
- September 2024: PepsiCo unveiled a new visual design for 7UP, showcasing a modern and refreshing aesthetic. These developments illustrate the dynamic nature of the market, highlighting the importance of technological innovation and brand image refresh.
Future Outlook for Graphic Design Market Market
The Graphic Design Market is poised for continued growth, driven by technological advancements, increasing demand for visual content, and the expansion of digital marketing. Strategic opportunities lie in embracing AI-powered design tools, specializing in niche services, and expanding into new markets. The market is predicted to show significant growth in the coming years, fueled by the aforementioned factors and the persistent requirement for engaging and effective visual communication across all industries.
Graphic Design Market Segmentation
-
1. Type
- 1.1. Logo & Brand Identity
- 1.2. App & Digital Design
- 1.3. Advertising
- 1.4. Clothing & Merchandise
- 1.5. Packaging & Label
- 1.6. Book& Magazine
- 1.7. Other Types
-
2. Platform
- 2.1. Online Design
- 2.2. Offline Design
-
3. End-users
- 3.1. SMEs
- 3.2. Large Enterprises
- 3.3. Government
Graphic Design Market Segmentation By Geography
- 1. North America
- 2. Europe
- 3. Asia
- 4. Australia and New Zealand
- 5. Latin America
- 6. Middle East and Africa
Graphic Design Market Regional Market Share
Geographic Coverage of Graphic Design Market
Graphic Design Market REPORT HIGHLIGHTS
| Aspects | Details |
|---|---|
| Study Period | 2020-2034 |
| Base Year | 2025 |
| Estimated Year | 2026 |
| Forecast Period | 2026-2034 |
| Historical Period | 2020-2025 |
| Growth Rate | CAGR of 5.89% from 2020-2034 |
| Segmentation |
|
Table of Contents
- 1. Introduction
- 1.1. Research Scope
- 1.2. Market Segmentation
- 1.3. Research Objective
- 1.4. Definitions and Assumptions
- 2. Executive Summary
- 2.1. Market Snapshot
- 3. Market Dynamics
- 3.1. Market Drivers
- 3.2. Market Restrains
- 3.3. Market Trends
- 3.4. Market Opportunities
- 4. Market Factor Analysis
- 4.1. Porters Five Forces
- 4.1.1. Bargaining Power of Suppliers
- 4.1.2. Bargaining Power of Buyers
- 4.1.3. Threat of New Entrants
- 4.1.4. Threat of Substitutes
- 4.1.5. Competitive Rivalry
- 4.2. PESTEL analysis
- 4.3. BCG Analysis
- 4.3.1. Stars (High Growth, High Market Share)
- 4.3.2. Cash Cows (Low Growth, High Market Share)
- 4.3.3. Question Mark (High Growth, Low Market Share)
- 4.3.4. Dogs (Low Growth, Low Market Share)
- 4.4. Ansoff Matrix Analysis
- 4.5. Supply Chain Analysis
- 4.6. Regulatory Landscape
- 4.7. Current Market Potential and Opportunity Assessment (TAM–SAM–SOM Framework)
- 4.8. PRI Analyst Note
- 4.1. Porters Five Forces
- 5. Market Analysis, Insights and Forecast 2021-2033
- 5.1. Market Analysis, Insights and Forecast - by Type
- 5.1.1. Logo & Brand Identity
- 5.1.2. App & Digital Design
- 5.1.3. Advertising
- 5.1.4. Clothing & Merchandise
- 5.1.5. Packaging & Label
- 5.1.6. Book& Magazine
- 5.1.7. Other Types
- 5.2. Market Analysis, Insights and Forecast - by Platform
- 5.2.1. Online Design
- 5.2.2. Offline Design
- 5.3. Market Analysis, Insights and Forecast - by End-users
- 5.3.1. SMEs
- 5.3.2. Large Enterprises
- 5.3.3. Government
- 5.4. Market Analysis, Insights and Forecast - by Region
- 5.4.1. North America
- 5.4.2. Europe
- 5.4.3. Asia
- 5.4.4. Australia and New Zealand
- 5.4.5. Latin America
- 5.4.6. Middle East and Africa
- 5.1. Market Analysis, Insights and Forecast - by Type
- 6. Global Graphic Design Market Analysis, Insights and Forecast, 2021-2033
- 6.1. Market Analysis, Insights and Forecast - by Type
- 6.1.1. Logo & Brand Identity
- 6.1.2. App & Digital Design
- 6.1.3. Advertising
- 6.1.4. Clothing & Merchandise
- 6.1.5. Packaging & Label
- 6.1.6. Book& Magazine
- 6.1.7. Other Types
- 6.2. Market Analysis, Insights and Forecast - by Platform
- 6.2.1. Online Design
- 6.2.2. Offline Design
- 6.3. Market Analysis, Insights and Forecast - by End-users
- 6.3.1. SMEs
- 6.3.2. Large Enterprises
- 6.3.3. Government
- 6.1. Market Analysis, Insights and Forecast - by Type
- 7. North America Graphic Design Market Analysis, Insights and Forecast, 2020-2032
- 7.1. Market Analysis, Insights and Forecast - by Type
- 7.1.1. Logo & Brand Identity
- 7.1.2. App & Digital Design
- 7.1.3. Advertising
- 7.1.4. Clothing & Merchandise
- 7.1.5. Packaging & Label
- 7.1.6. Book& Magazine
- 7.1.7. Other Types
- 7.2. Market Analysis, Insights and Forecast - by Platform
- 7.2.1. Online Design
- 7.2.2. Offline Design
- 7.3. Market Analysis, Insights and Forecast - by End-users
- 7.3.1. SMEs
- 7.3.2. Large Enterprises
- 7.3.3. Government
- 7.1. Market Analysis, Insights and Forecast - by Type
- 8. Europe Graphic Design Market Analysis, Insights and Forecast, 2020-2032
- 8.1. Market Analysis, Insights and Forecast - by Type
- 8.1.1. Logo & Brand Identity
- 8.1.2. App & Digital Design
- 8.1.3. Advertising
- 8.1.4. Clothing & Merchandise
- 8.1.5. Packaging & Label
- 8.1.6. Book& Magazine
- 8.1.7. Other Types
- 8.2. Market Analysis, Insights and Forecast - by Platform
- 8.2.1. Online Design
- 8.2.2. Offline Design
- 8.3. Market Analysis, Insights and Forecast - by End-users
- 8.3.1. SMEs
- 8.3.2. Large Enterprises
- 8.3.3. Government
- 8.1. Market Analysis, Insights and Forecast - by Type
- 9. Asia Graphic Design Market Analysis, Insights and Forecast, 2020-2032
- 9.1. Market Analysis, Insights and Forecast - by Type
- 9.1.1. Logo & Brand Identity
- 9.1.2. App & Digital Design
- 9.1.3. Advertising
- 9.1.4. Clothing & Merchandise
- 9.1.5. Packaging & Label
- 9.1.6. Book& Magazine
- 9.1.7. Other Types
- 9.2. Market Analysis, Insights and Forecast - by Platform
- 9.2.1. Online Design
- 9.2.2. Offline Design
- 9.3. Market Analysis, Insights and Forecast - by End-users
- 9.3.1. SMEs
- 9.3.2. Large Enterprises
- 9.3.3. Government
- 9.1. Market Analysis, Insights and Forecast - by Type
- 10. Australia and New Zealand Graphic Design Market Analysis, Insights and Forecast, 2020-2032
- 10.1. Market Analysis, Insights and Forecast - by Type
- 10.1.1. Logo & Brand Identity
- 10.1.2. App & Digital Design
- 10.1.3. Advertising
- 10.1.4. Clothing & Merchandise
- 10.1.5. Packaging & Label
- 10.1.6. Book& Magazine
- 10.1.7. Other Types
- 10.2. Market Analysis, Insights and Forecast - by Platform
- 10.2.1. Online Design
- 10.2.2. Offline Design
- 10.3. Market Analysis, Insights and Forecast - by End-users
- 10.3.1. SMEs
- 10.3.2. Large Enterprises
- 10.3.3. Government
- 10.1. Market Analysis, Insights and Forecast - by Type
- 11. Latin America Graphic Design Market Analysis, Insights and Forecast, 2020-2032
- 11.1. Market Analysis, Insights and Forecast - by Type
- 11.1.1. Logo & Brand Identity
- 11.1.2. App & Digital Design
- 11.1.3. Advertising
- 11.1.4. Clothing & Merchandise
- 11.1.5. Packaging & Label
- 11.1.6. Book& Magazine
- 11.1.7. Other Types
- 11.2. Market Analysis, Insights and Forecast - by Platform
- 11.2.1. Online Design
- 11.2.2. Offline Design
- 11.3. Market Analysis, Insights and Forecast - by End-users
- 11.3.1. SMEs
- 11.3.2. Large Enterprises
- 11.3.3. Government
- 11.1. Market Analysis, Insights and Forecast - by Type
- 12. Middle East and Africa Graphic Design Market Analysis, Insights and Forecast, 2020-2032
- 12.1. Market Analysis, Insights and Forecast - by Type
- 12.1.1. Logo & Brand Identity
- 12.1.2. App & Digital Design
- 12.1.3. Advertising
- 12.1.4. Clothing & Merchandise
- 12.1.5. Packaging & Label
- 12.1.6. Book& Magazine
- 12.1.7. Other Types
- 12.2. Market Analysis, Insights and Forecast - by Platform
- 12.2.1. Online Design
- 12.2.2. Offline Design
- 12.3. Market Analysis, Insights and Forecast - by End-users
- 12.3.1. SMEs
- 12.3.2. Large Enterprises
- 12.3.3. Government
- 12.1. Market Analysis, Insights and Forecast - by Type
- 13. Competitive Analysis
- 13.1. Company Profiles
- 13.1.1 ArtVersion
- 13.1.1.1. Company Overview
- 13.1.1.2. Products
- 13.1.1.3. Company Financials
- 13.1.1.4. SWOT Analysis
- 13.1.2 Max Media Group
- 13.1.2.1. Company Overview
- 13.1.2.2. Products
- 13.1.2.3. Company Financials
- 13.1.2.4. SWOT Analysis
- 13.1.3 Bates Design Inc
- 13.1.3.1. Company Overview
- 13.1.3.2. Products
- 13.1.3.3. Company Financials
- 13.1.3.4. SWOT Analysis
- 13.1.4 VerdanaBold
- 13.1.4.1. Company Overview
- 13.1.4.2. Products
- 13.1.4.3. Company Financials
- 13.1.4.4. SWOT Analysis
- 13.1.5 Pentagram Inc
- 13.1.5.1. Company Overview
- 13.1.5.2. Products
- 13.1.5.3. Company Financials
- 13.1.5.4. SWOT Analysis
- 13.1.6 ManyPixels Inc
- 13.1.6.1. Company Overview
- 13.1.6.2. Products
- 13.1.6.3. Company Financials
- 13.1.6.4. SWOT Analysis
- 13.1.7 Huge LLC
- 13.1.7.1. Company Overview
- 13.1.7.2. Products
- 13.1.7.3. Company Financials
- 13.1.7.4. SWOT Analysis
- 13.1.8 Duck Design Inc
- 13.1.8.1. Company Overview
- 13.1.8.2. Products
- 13.1.8.3. Company Financials
- 13.1.8.4. SWOT Analysis
- 13.1.9 DesignCrowd Inc
- 13.1.9.1. Company Overview
- 13.1.9.2. Products
- 13.1.9.3. Company Financials
- 13.1.9.4. SWOT Analysis
- 13.1.10 Design Pickle Inc *List Not Exhaustive
- 13.1.10.1. Company Overview
- 13.1.10.2. Products
- 13.1.10.3. Company Financials
- 13.1.10.4. SWOT Analysis
- 13.1.1 ArtVersion
- 13.2. Market Entropy
- 13.2.1 Company's Key Areas Served
- 13.2.2 Recent Developments
- 13.3. Company Market Share Analysis 2025
- 13.3.1 Top 5 Companies Market Share Analysis
- 13.3.2 Top 3 Companies Market Share Analysis
- 13.4. List of Potential Customers
- 14. Research Methodology
List of Figures
- Figure 1: Global Graphic Design Market Revenue Breakdown (Million, %) by Region 2025 & 2033
- Figure 2: Global Graphic Design Market Volume Breakdown (Billion, %) by Region 2025 & 2033
- Figure 3: North America Graphic Design Market Revenue (Million), by Type 2025 & 2033
- Figure 4: North America Graphic Design Market Volume (Billion), by Type 2025 & 2033
- Figure 5: North America Graphic Design Market Revenue Share (%), by Type 2025 & 2033
- Figure 6: North America Graphic Design Market Volume Share (%), by Type 2025 & 2033
- Figure 7: North America Graphic Design Market Revenue (Million), by Platform 2025 & 2033
- Figure 8: North America Graphic Design Market Volume (Billion), by Platform 2025 & 2033
- Figure 9: North America Graphic Design Market Revenue Share (%), by Platform 2025 & 2033
- Figure 10: North America Graphic Design Market Volume Share (%), by Platform 2025 & 2033
- Figure 11: North America Graphic Design Market Revenue (Million), by End-users 2025 & 2033
- Figure 12: North America Graphic Design Market Volume (Billion), by End-users 2025 & 2033
- Figure 13: North America Graphic Design Market Revenue Share (%), by End-users 2025 & 2033
- Figure 14: North America Graphic Design Market Volume Share (%), by End-users 2025 & 2033
- Figure 15: North America Graphic Design Market Revenue (Million), by Country 2025 & 2033
- Figure 16: North America Graphic Design Market Volume (Billion), by Country 2025 & 2033
- Figure 17: North America Graphic Design Market Revenue Share (%), by Country 2025 & 2033
- Figure 18: North America Graphic Design Market Volume Share (%), by Country 2025 & 2033
- Figure 19: Europe Graphic Design Market Revenue (Million), by Type 2025 & 2033
- Figure 20: Europe Graphic Design Market Volume (Billion), by Type 2025 & 2033
- Figure 21: Europe Graphic Design Market Revenue Share (%), by Type 2025 & 2033
- Figure 22: Europe Graphic Design Market Volume Share (%), by Type 2025 & 2033
- Figure 23: Europe Graphic Design Market Revenue (Million), by Platform 2025 & 2033
- Figure 24: Europe Graphic Design Market Volume (Billion), by Platform 2025 & 2033
- Figure 25: Europe Graphic Design Market Revenue Share (%), by Platform 2025 & 2033
- Figure 26: Europe Graphic Design Market Volume Share (%), by Platform 2025 & 2033
- Figure 27: Europe Graphic Design Market Revenue (Million), by End-users 2025 & 2033
- Figure 28: Europe Graphic Design Market Volume (Billion), by End-users 2025 & 2033
- Figure 29: Europe Graphic Design Market Revenue Share (%), by End-users 2025 & 2033
- Figure 30: Europe Graphic Design Market Volume Share (%), by End-users 2025 & 2033
- Figure 31: Europe Graphic Design Market Revenue (Million), by Country 2025 & 2033
- Figure 32: Europe Graphic Design Market Volume (Billion), by Country 2025 & 2033
- Figure 33: Europe Graphic Design Market Revenue Share (%), by Country 2025 & 2033
- Figure 34: Europe Graphic Design Market Volume Share (%), by Country 2025 & 2033
- Figure 35: Asia Graphic Design Market Revenue (Million), by Type 2025 & 2033
- Figure 36: Asia Graphic Design Market Volume (Billion), by Type 2025 & 2033
- Figure 37: Asia Graphic Design Market Revenue Share (%), by Type 2025 & 2033
- Figure 38: Asia Graphic Design Market Volume Share (%), by Type 2025 & 2033
- Figure 39: Asia Graphic Design Market Revenue (Million), by Platform 2025 & 2033
- Figure 40: Asia Graphic Design Market Volume (Billion), by Platform 2025 & 2033
- Figure 41: Asia Graphic Design Market Revenue Share (%), by Platform 2025 & 2033
- Figure 42: Asia Graphic Design Market Volume Share (%), by Platform 2025 & 2033
- Figure 43: Asia Graphic Design Market Revenue (Million), by End-users 2025 & 2033
- Figure 44: Asia Graphic Design Market Volume (Billion), by End-users 2025 & 2033
- Figure 45: Asia Graphic Design Market Revenue Share (%), by End-users 2025 & 2033
- Figure 46: Asia Graphic Design Market Volume Share (%), by End-users 2025 & 2033
- Figure 47: Asia Graphic Design Market Revenue (Million), by Country 2025 & 2033
- Figure 48: Asia Graphic Design Market Volume (Billion), by Country 2025 & 2033
- Figure 49: Asia Graphic Design Market Revenue Share (%), by Country 2025 & 2033
- Figure 50: Asia Graphic Design Market Volume Share (%), by Country 2025 & 2033
- Figure 51: Australia and New Zealand Graphic Design Market Revenue (Million), by Type 2025 & 2033
- Figure 52: Australia and New Zealand Graphic Design Market Volume (Billion), by Type 2025 & 2033
- Figure 53: Australia and New Zealand Graphic Design Market Revenue Share (%), by Type 2025 & 2033
- Figure 54: Australia and New Zealand Graphic Design Market Volume Share (%), by Type 2025 & 2033
- Figure 55: Australia and New Zealand Graphic Design Market Revenue (Million), by Platform 2025 & 2033
- Figure 56: Australia and New Zealand Graphic Design Market Volume (Billion), by Platform 2025 & 2033
- Figure 57: Australia and New Zealand Graphic Design Market Revenue Share (%), by Platform 2025 & 2033
- Figure 58: Australia and New Zealand Graphic Design Market Volume Share (%), by Platform 2025 & 2033
- Figure 59: Australia and New Zealand Graphic Design Market Revenue (Million), by End-users 2025 & 2033
- Figure 60: Australia and New Zealand Graphic Design Market Volume (Billion), by End-users 2025 & 2033
- Figure 61: Australia and New Zealand Graphic Design Market Revenue Share (%), by End-users 2025 & 2033
- Figure 62: Australia and New Zealand Graphic Design Market Volume Share (%), by End-users 2025 & 2033
- Figure 63: Australia and New Zealand Graphic Design Market Revenue (Million), by Country 2025 & 2033
- Figure 64: Australia and New Zealand Graphic Design Market Volume (Billion), by Country 2025 & 2033
- Figure 65: Australia and New Zealand Graphic Design Market Revenue Share (%), by Country 2025 & 2033
- Figure 66: Australia and New Zealand Graphic Design Market Volume Share (%), by Country 2025 & 2033
- Figure 67: Latin America Graphic Design Market Revenue (Million), by Type 2025 & 2033
- Figure 68: Latin America Graphic Design Market Volume (Billion), by Type 2025 & 2033
- Figure 69: Latin America Graphic Design Market Revenue Share (%), by Type 2025 & 2033
- Figure 70: Latin America Graphic Design Market Volume Share (%), by Type 2025 & 2033
- Figure 71: Latin America Graphic Design Market Revenue (Million), by Platform 2025 & 2033
- Figure 72: Latin America Graphic Design Market Volume (Billion), by Platform 2025 & 2033
- Figure 73: Latin America Graphic Design Market Revenue Share (%), by Platform 2025 & 2033
- Figure 74: Latin America Graphic Design Market Volume Share (%), by Platform 2025 & 2033
- Figure 75: Latin America Graphic Design Market Revenue (Million), by End-users 2025 & 2033
- Figure 76: Latin America Graphic Design Market Volume (Billion), by End-users 2025 & 2033
- Figure 77: Latin America Graphic Design Market Revenue Share (%), by End-users 2025 & 2033
- Figure 78: Latin America Graphic Design Market Volume Share (%), by End-users 2025 & 2033
- Figure 79: Latin America Graphic Design Market Revenue (Million), by Country 2025 & 2033
- Figure 80: Latin America Graphic Design Market Volume (Billion), by Country 2025 & 2033
- Figure 81: Latin America Graphic Design Market Revenue Share (%), by Country 2025 & 2033
- Figure 82: Latin America Graphic Design Market Volume Share (%), by Country 2025 & 2033
- Figure 83: Middle East and Africa Graphic Design Market Revenue (Million), by Type 2025 & 2033
- Figure 84: Middle East and Africa Graphic Design Market Volume (Billion), by Type 2025 & 2033
- Figure 85: Middle East and Africa Graphic Design Market Revenue Share (%), by Type 2025 & 2033
- Figure 86: Middle East and Africa Graphic Design Market Volume Share (%), by Type 2025 & 2033
- Figure 87: Middle East and Africa Graphic Design Market Revenue (Million), by Platform 2025 & 2033
- Figure 88: Middle East and Africa Graphic Design Market Volume (Billion), by Platform 2025 & 2033
- Figure 89: Middle East and Africa Graphic Design Market Revenue Share (%), by Platform 2025 & 2033
- Figure 90: Middle East and Africa Graphic Design Market Volume Share (%), by Platform 2025 & 2033
- Figure 91: Middle East and Africa Graphic Design Market Revenue (Million), by End-users 2025 & 2033
- Figure 92: Middle East and Africa Graphic Design Market Volume (Billion), by End-users 2025 & 2033
- Figure 93: Middle East and Africa Graphic Design Market Revenue Share (%), by End-users 2025 & 2033
- Figure 94: Middle East and Africa Graphic Design Market Volume Share (%), by End-users 2025 & 2033
- Figure 95: Middle East and Africa Graphic Design Market Revenue (Million), by Country 2025 & 2033
- Figure 96: Middle East and Africa Graphic Design Market Volume (Billion), by Country 2025 & 2033
- Figure 97: Middle East and Africa Graphic Design Market Revenue Share (%), by Country 2025 & 2033
- Figure 98: Middle East and Africa Graphic Design Market Volume Share (%), by Country 2025 & 2033
List of Tables
- Table 1: Global Graphic Design Market Revenue Million Forecast, by Type 2020 & 2033
- Table 2: Global Graphic Design Market Volume Billion Forecast, by Type 2020 & 2033
- Table 3: Global Graphic Design Market Revenue Million Forecast, by Platform 2020 & 2033
- Table 4: Global Graphic Design Market Volume Billion Forecast, by Platform 2020 & 2033
- Table 5: Global Graphic Design Market Revenue Million Forecast, by End-users 2020 & 2033
- Table 6: Global Graphic Design Market Volume Billion Forecast, by End-users 2020 & 2033
- Table 7: Global Graphic Design Market Revenue Million Forecast, by Region 2020 & 2033
- Table 8: Global Graphic Design Market Volume Billion Forecast, by Region 2020 & 2033
- Table 9: Global Graphic Design Market Revenue Million Forecast, by Type 2020 & 2033
- Table 10: Global Graphic Design Market Volume Billion Forecast, by Type 2020 & 2033
- Table 11: Global Graphic Design Market Revenue Million Forecast, by Platform 2020 & 2033
- Table 12: Global Graphic Design Market Volume Billion Forecast, by Platform 2020 & 2033
- Table 13: Global Graphic Design Market Revenue Million Forecast, by End-users 2020 & 2033
- Table 14: Global Graphic Design Market Volume Billion Forecast, by End-users 2020 & 2033
- Table 15: Global Graphic Design Market Revenue Million Forecast, by Country 2020 & 2033
- Table 16: Global Graphic Design Market Volume Billion Forecast, by Country 2020 & 2033
- Table 17: Global Graphic Design Market Revenue Million Forecast, by Type 2020 & 2033
- Table 18: Global Graphic Design Market Volume Billion Forecast, by Type 2020 & 2033
- Table 19: Global Graphic Design Market Revenue Million Forecast, by Platform 2020 & 2033
- Table 20: Global Graphic Design Market Volume Billion Forecast, by Platform 2020 & 2033
- Table 21: Global Graphic Design Market Revenue Million Forecast, by End-users 2020 & 2033
- Table 22: Global Graphic Design Market Volume Billion Forecast, by End-users 2020 & 2033
- Table 23: Global Graphic Design Market Revenue Million Forecast, by Country 2020 & 2033
- Table 24: Global Graphic Design Market Volume Billion Forecast, by Country 2020 & 2033
- Table 25: Global Graphic Design Market Revenue Million Forecast, by Type 2020 & 2033
- Table 26: Global Graphic Design Market Volume Billion Forecast, by Type 2020 & 2033
- Table 27: Global Graphic Design Market Revenue Million Forecast, by Platform 2020 & 2033
- Table 28: Global Graphic Design Market Volume Billion Forecast, by Platform 2020 & 2033
- Table 29: Global Graphic Design Market Revenue Million Forecast, by End-users 2020 & 2033
- Table 30: Global Graphic Design Market Volume Billion Forecast, by End-users 2020 & 2033
- Table 31: Global Graphic Design Market Revenue Million Forecast, by Country 2020 & 2033
- Table 32: Global Graphic Design Market Volume Billion Forecast, by Country 2020 & 2033
- Table 33: Global Graphic Design Market Revenue Million Forecast, by Type 2020 & 2033
- Table 34: Global Graphic Design Market Volume Billion Forecast, by Type 2020 & 2033
- Table 35: Global Graphic Design Market Revenue Million Forecast, by Platform 2020 & 2033
- Table 36: Global Graphic Design Market Volume Billion Forecast, by Platform 2020 & 2033
- Table 37: Global Graphic Design Market Revenue Million Forecast, by End-users 2020 & 2033
- Table 38: Global Graphic Design Market Volume Billion Forecast, by End-users 2020 & 2033
- Table 39: Global Graphic Design Market Revenue Million Forecast, by Country 2020 & 2033
- Table 40: Global Graphic Design Market Volume Billion Forecast, by Country 2020 & 2033
- Table 41: Global Graphic Design Market Revenue Million Forecast, by Type 2020 & 2033
- Table 42: Global Graphic Design Market Volume Billion Forecast, by Type 2020 & 2033
- Table 43: Global Graphic Design Market Revenue Million Forecast, by Platform 2020 & 2033
- Table 44: Global Graphic Design Market Volume Billion Forecast, by Platform 2020 & 2033
- Table 45: Global Graphic Design Market Revenue Million Forecast, by End-users 2020 & 2033
- Table 46: Global Graphic Design Market Volume Billion Forecast, by End-users 2020 & 2033
- Table 47: Global Graphic Design Market Revenue Million Forecast, by Country 2020 & 2033
- Table 48: Global Graphic Design Market Volume Billion Forecast, by Country 2020 & 2033
- Table 49: Global Graphic Design Market Revenue Million Forecast, by Type 2020 & 2033
- Table 50: Global Graphic Design Market Volume Billion Forecast, by Type 2020 & 2033
- Table 51: Global Graphic Design Market Revenue Million Forecast, by Platform 2020 & 2033
- Table 52: Global Graphic Design Market Volume Billion Forecast, by Platform 2020 & 2033
- Table 53: Global Graphic Design Market Revenue Million Forecast, by End-users 2020 & 2033
- Table 54: Global Graphic Design Market Volume Billion Forecast, by End-users 2020 & 2033
- Table 55: Global Graphic Design Market Revenue Million Forecast, by Country 2020 & 2033
- Table 56: Global Graphic Design Market Volume Billion Forecast, by Country 2020 & 2033
Frequently Asked Questions
1. What is the projected Compound Annual Growth Rate (CAGR) of the Graphic Design Market?
The projected CAGR is approximately 5.89%.
2. Which companies are prominent players in the Graphic Design Market?
Key companies in the market include ArtVersion, Max Media Group, Bates Design Inc, VerdanaBold, Pentagram Inc, ManyPixels Inc, Huge LLC, Duck Design Inc, DesignCrowd Inc, Design Pickle Inc *List Not Exhaustive.
3. What are the main segments of the Graphic Design Market?
The market segments include Type, Platform, End-users.
4. Can you provide details about the market size?
The market size is estimated to be USD 54.35 Million as of 2022.
5. What are some drivers contributing to market growth?
Rising Demand for Digital Content; Expansion of Branding and Advertising Initiatives.
6. What are the notable trends driving market growth?
SMEs to Hold Significant Growth.
7. Are there any restraints impacting market growth?
Rising Demand for Digital Content; Expansion of Branding and Advertising Initiatives.
8. Can you provide examples of recent developments in the market?
July 2024: Adobe announced breakthrough innovations in its industry leading professional design apps Adobe Illustrator and Adobe Photoshop that accelerate everyday creative workflows and give creators more control. From ideation to production, the new release of Illustrator unlocks new ways for pro designers and illustrators to more easily and quickly bring their vision to life across brand graphics, logos and icons, product packaging, marketing deliverables, pattern creation and beyond.September 2024: PepsiCo introduced a new visual design for 7UP as part of this global refresh with bright colors and minimalistic aesthetics. The restaged 7UP VIS represents a frame of mind and style that encompasses all that is refreshing, distinctive, and modern.
9. What pricing options are available for accessing the report?
Pricing options include single-user, multi-user, and enterprise licenses priced at USD 4750, USD 5250, and USD 8750 respectively.
10. Is the market size provided in terms of value or volume?
The market size is provided in terms of value, measured in Million and volume, measured in Billion.
11. Are there any specific market keywords associated with the report?
Yes, the market keyword associated with the report is "Graphic Design Market," which aids in identifying and referencing the specific market segment covered.
12. How do I determine which pricing option suits my needs best?
The pricing options vary based on user requirements and access needs. Individual users may opt for single-user licenses, while businesses requiring broader access may choose multi-user or enterprise licenses for cost-effective access to the report.
13. Are there any additional resources or data provided in the Graphic Design Market report?
While the report offers comprehensive insights, it's advisable to review the specific contents or supplementary materials provided to ascertain if additional resources or data are available.
14. How can I stay updated on further developments or reports in the Graphic Design Market?
To stay informed about further developments, trends, and reports in the Graphic Design Market, consider subscribing to industry newsletters, following relevant companies and organizations, or regularly checking reputable industry news sources and publications.
Methodology
Step 1 - Identification of Relevant Samples Size from Population Database


Step 2 - Approaches for Defining Global Market Size (Value, Volume* & Price*)

Note*: In applicable scenarios
Step 3 - Data Sources
Primary Research
- Web Analytics
- Survey Reports
- Research Institute
- Latest Research Reports
- Opinion Leaders
Secondary Research
- Annual Reports
- White Paper
- Latest Press Release
- Industry Association
- Paid Database
- Investor Presentations

Step 4 - Data Triangulation
Involves using different sources of information in order to increase the validity of a study
These sources are likely to be stakeholders in a program - participants, other researchers, program staff, other community members, and so on.
Then we put all data in single framework & apply various statistical tools to find out the dynamic on the market.
During the analysis stage, feedback from the stakeholder groups would be compared to determine areas of agreement as well as areas of divergence