

Key Insights
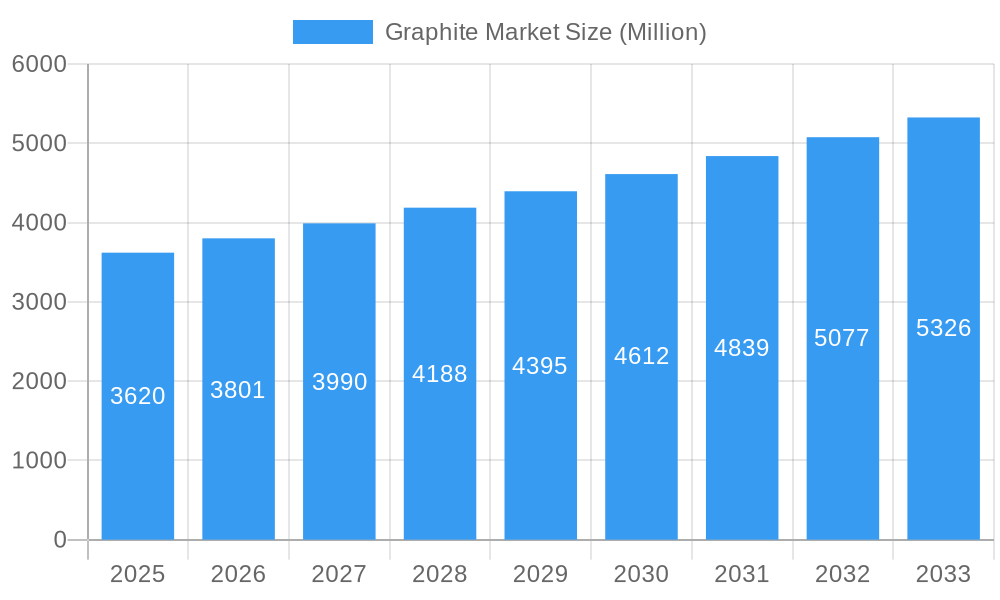
The global graphite market is projected for significant expansion, forecasted to reach $31.59 billion by 2025. This robust growth is primarily driven by the surging demand for lithium-ion batteries essential for electric vehicles (EVs) and energy storage systems (ESS). The market is expected to grow at a Compound Annual Growth Rate (CAGR) of 8.42% from 2025 to 2033, propelled by advancements in battery technology that enhance energy density and lifespan. The increasing adoption of renewable energy and stringent environmental regulations further bolster this upward trend. While natural graphite currently leads due to cost-effectiveness, synthetic graphite is gaining prominence for its superior purity and consistent performance, making it vital for high-performance applications like EV batteries. Key applications include electrodes, refractories, and lubricants, with the electronics and automotive sectors being primary end-users. Asia-Pacific, led by China, dominates the market due to its strong manufacturing capabilities and high EV adoption rates. However, competitive pressures, raw material price volatility, and potential supply chain disruptions present market challenges. The graphite industry is characterized by a dynamic mix of established global corporations and emerging regional players, fostering continuous innovation and competition.
Graphite Market Market Size (In Billion)
The forecast period from 2025 to 2033 will see a sustained shift towards high-performance applications, especially within the EV sector, increasing demand for superior synthetic graphite. Strategic collaborations and mergers & acquisitions are poised to reshape the market, with companies prioritizing raw material security and production capacity expansion. Government initiatives supporting sustainable energy technologies will significantly accelerate market growth. While North America and Europe anticipate steady growth, Asia-Pacific will maintain its market leadership owing to its extensive manufacturing base and burgeoning EV market. The industry is increasingly focusing on sustainable graphite extraction methods and minimizing environmental impact, shaping its future direction. Expect a heightened emphasis on technological innovation, including the development of advanced graphite-based materials with enhanced performance characteristics.
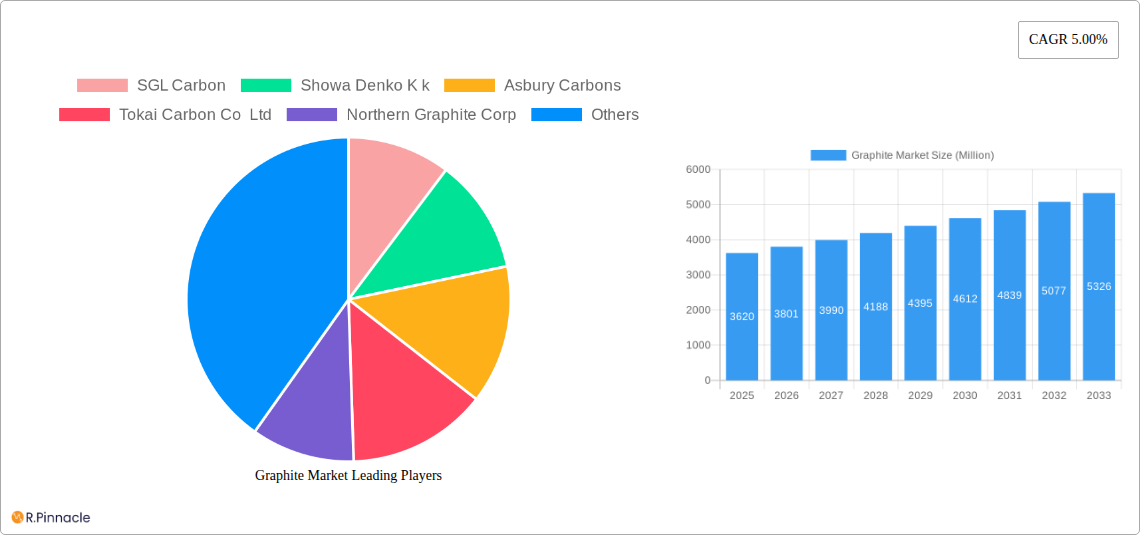
Graphite Market Company Market Share
Graphite Market Report: A Comprehensive Analysis (2019-2033)
This in-depth report provides a comprehensive analysis of the Graphite Market, offering invaluable insights for industry professionals, investors, and strategists. Covering the period from 2019 to 2033, with a focus on 2025, this report dissects market dynamics, competitive landscapes, and future growth potential. The study incorporates detailed segmentations by type (Natural Graphite, Synthetic Graphite), application (Electrodes, Refractories, Casting & Foundries, Batteries, Lubricants, Other Applications), and end-user industry (Electronics, Metallurgy, Automotive (including EV/HEV vehicles), Other End-user Industries). Key players such as SGL Carbon, Showa Denko K.K., and Imerys are profiled, providing crucial competitive intelligence.
Graphite Market Structure & Innovation Trends
The graphite market exhibits a moderately concentrated structure, with a few major players holding significant market share. SGL Carbon, Showa Denko K.K., and Imerys are among the leading companies, commanding a combined xx% market share in 2024 (estimated). Innovation is driven by the increasing demand for high-performance graphite materials in various applications, particularly in the rapidly expanding electric vehicle (EV) battery sector. Regulatory frameworks, particularly those concerning environmental sustainability and resource management, are shaping market dynamics. Product substitutes, such as alternative battery materials, present a competitive challenge. The market has witnessed significant M&A activity in recent years, with deal values totaling approximately xx Million in the period 2019-2024 (estimated). These activities aim to consolidate market share, access new technologies, and expand into emerging markets. End-user demographics are shifting, with the growing demand from the electronics and automotive industries driving market growth.
- Market Concentration: Moderately concentrated, with top 3 players holding xx% market share (estimated).
- Innovation Drivers: Demand for high-performance materials in EVs and electronics.
- Regulatory Framework: Environmental sustainability and resource management regulations.
- Product Substitutes: Alternative battery materials.
- M&A Activity: Total deal value approximately xx Million (2019-2024, estimated).
Graphite Market Dynamics & Trends
The graphite market is experiencing robust growth, driven primarily by the burgeoning demand from the lithium-ion battery industry. The increasing adoption of electric and hybrid vehicles (EV/HEV) is a significant catalyst, fueling demand for high-quality graphite materials for anode production. The compound annual growth rate (CAGR) is projected to be xx% during the forecast period (2025-2033). Technological advancements in graphite production and processing are improving material properties, enabling wider applications. Consumer preference for sustainable and environmentally friendly products is also bolstering demand for graphite-based materials. Competitive dynamics are characterized by intense rivalry among established players and emerging companies striving to gain market share. Market penetration in key applications such as EV batteries is expected to reach xx% by 2033 (estimated).
Dominant Regions & Segments in Graphite Market
China is currently the dominant region in the graphite market, followed by other Asian countries, due to its substantial reserves of natural graphite and a strong manufacturing base. However, the automotive industry, particularly EV manufacturing, is spread geographically. North America and Europe are also experiencing significant growth, driven by the increasing adoption of EVs.
Key Drivers:
- China: Abundant natural graphite reserves, robust manufacturing infrastructure, and government support for the EV industry.
- North America & Europe: High demand from the automotive sector, particularly for EVs, and supportive government policies.
Dominant Segments:
- Type: Synthetic graphite is showing faster growth due to its superior properties, while natural graphite continues to dominate by volume.
- Application: The battery segment is experiencing explosive growth, driven by the increasing demand for EVs and energy storage systems. Electrodes are the largest application segment in terms of value and volume.
- End-User Industry: The automotive (EV/HEV) sector is the fastest-growing end-user industry.
The detailed dominance analysis of each segment highlights the factors driving growth within each region.
Graphite Market Product Innovations
Recent product innovations focus on enhancing the performance and efficiency of graphite materials, particularly for battery applications. This includes the development of high-purity graphite with improved conductivity, enhanced thermal stability, and longer cycle life. New processing techniques are being employed to reduce costs and improve material quality. These innovations offer significant competitive advantages to producers who can offer superior products at competitive prices. The market is witnessing the integration of advanced materials and nanotechnology to create next-generation graphite composites for various high-performance applications.
Report Scope & Segmentation Analysis
The report comprehensively analyzes the graphite market across various segments:
By Type: Natural Graphite and Synthetic Graphite, with growth projections and market size analysis for each. Competitive dynamics within each segment are explored.
By Application: Electrodes, Refractories, Casting and Foundries, Batteries, Lubricants, and Other Applications, with individual market size estimations, growth trends and competitive analysis.
By End-user Industry: Electronics, Metallurgy, Automotive (including EV/HEV vehicles), and Other End-user Industries; each segment is examined in detail, with market size and growth projections. Competitive landscapes within each segment are detailed.
Key Drivers of Graphite Market Growth
The growth of the graphite market is fueled by several key factors. The explosive growth of the electric vehicle (EV) industry is a major driver, significantly increasing the demand for high-quality graphite in lithium-ion batteries. Government incentives and policies supporting EV adoption further stimulate market growth. The rising demand for energy storage solutions in renewable energy applications is another key factor. Technological advancements leading to improved graphite production methods and higher-performance materials also contribute to the market's expansion.
Challenges in the Graphite Market Sector
The graphite market faces several challenges. Fluctuations in raw material prices and supply chain disruptions can impact production costs and profitability. Intense competition among established and emerging players creates pricing pressure. Environmental regulations regarding graphite mining and processing impose operational constraints. The availability of high-quality graphite reserves is another significant concern. These factors pose a quantifiable impact on market growth, especially in terms of price volatility and production capacity.
Emerging Opportunities in Graphite Market
The graphite market presents promising opportunities. The development of next-generation battery technologies (e.g., solid-state batteries) offers potential for increased graphite demand. Expanding applications in emerging technologies (e.g., fuel cells and advanced composites) provide further growth prospects. The increasing focus on sustainable and environmentally friendly materials offers opportunities for graphite producers to showcase the sustainable nature of their sourcing and production. The exploration and development of new graphite reserves in various regions are also creating new opportunities.
Leading Players in the Graphite Market Market
- SGL Carbon
- Showa Denko K.K.
- Asbury Carbons
- Tokai Carbon Co. Ltd.
- Northern Graphite Corp.
- Mason Graphite Inc.
- Triton Minerals
- BTR New Material Group Co. Ltd.
- Jiangxi Zichen Technology Co. Ltd.
- Imerys
- Shanghai Shanshan Technology Co. Ltd.
- Syrah Resources Limited
- Shenzhen Xiangfenghua Technology Co. Ltd.
- Nippon Kokuen Group
Key Developments in Graphite Market Industry
October 2022: Syrah Resources Ltd. announced a supply agreement with LG Energy Solution Ltd. for 2 ktpa of graphite anode material (AAM) from 2025, increasing to at least 10 ktpa subsequently. This significantly boosts Syrah's market position and highlights the growing demand for battery-grade graphite.
October 2022: Imerys Graphite & Carbon launched the EMILI Project, expanding its lithium exploitation capabilities and strengthening its position in the Li-ion battery component market. This underscores the strategic importance of vertical integration within the graphite value chain.
Future Outlook for Graphite Market Market
The future of the graphite market looks promising, driven by continued growth in the EV industry and the rising adoption of renewable energy technologies. Strategic investments in research and development, along with collaborations among industry players, will further drive market growth. The focus on sustainable and efficient graphite production methods will ensure long-term market viability. The exploration of new applications for graphite materials will unlock new market opportunities, leading to overall market expansion.
Graphite Market Segmentation
-
1. Type
- 1.1. Natural Graphite
- 1.2. Synthetic Graphite
-
2. Application
- 2.1. Electrodes
- 2.2. Refractories, Casting, and Foundries
- 2.3. Batteries
- 2.4. Lubricants
- 2.5. Other Applications
-
3. End-user Industry
- 3.1. Electronics
- 3.2. Metallurgy
- 3.3. Automotive (Includes EV/HEV Vehicles)
- 3.4. Other End-user Industries
Graphite Market Segmentation By Geography
-
1. Asia Pacific
- 1.1. China
- 1.2. India
- 1.3. Japan
- 1.4. South Korea
- 1.5. Rest of Asia Pacific
-
2. North America
- 2.1. United States
- 2.2. Canada
- 2.3. Mexico
-
3. Europe
- 3.1. Germany
- 3.2. United Kingdom
- 3.3. Italy
- 3.4. France
- 3.5. Russia
- 3.6. Rest of Europe
-
4. South America
- 4.1. Brazil
- 4.2. Argentina
- 4.3. Rest of South America
-
5. Middle East and Africa
- 5.1. Saudi Arabia
- 5.2. South Africa
- 5.3. Rest of Middle East and Africa
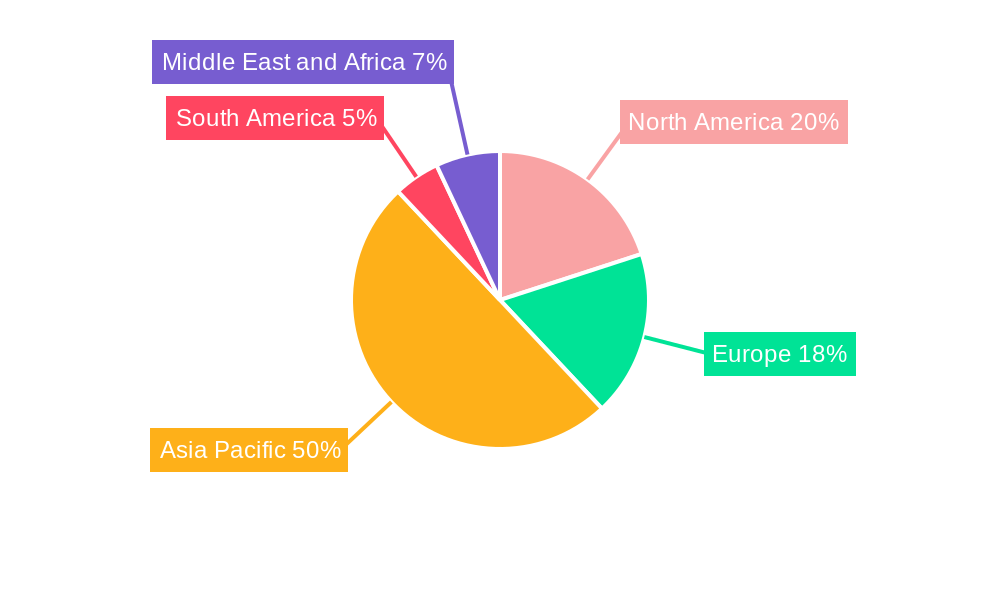
Graphite Market Regional Market Share
Geographic Coverage of Graphite Market
Graphite Market REPORT HIGHLIGHTS
| Aspects | Details |
|---|---|
| Study Period | 2020-2034 |
| Base Year | 2025 |
| Estimated Year | 2026 |
| Forecast Period | 2026-2034 |
| Historical Period | 2020-2025 |
| Growth Rate | CAGR of 8.42% from 2020-2034 |
| Segmentation |
|
Table of Contents
- 1. Introduction
- 1.1. Research Scope
- 1.2. Market Segmentation
- 1.3. Research Objective
- 1.4. Definitions and Assumptions
- 2. Executive Summary
- 2.1. Market Snapshot
- 3. Market Dynamics
- 3.1. Market Drivers
- 3.2. Market Restrains
- 3.3. Market Trends
- 3.4. Market Opportunities
- 4. Market Factor Analysis
- 4.1. Porters Five Forces
- 4.1.1. Bargaining Power of Suppliers
- 4.1.2. Bargaining Power of Buyers
- 4.1.3. Threat of New Entrants
- 4.1.4. Threat of Substitutes
- 4.1.5. Competitive Rivalry
- 4.2. PESTEL analysis
- 4.3. BCG Analysis
- 4.3.1. Stars (High Growth, High Market Share)
- 4.3.2. Cash Cows (Low Growth, High Market Share)
- 4.3.3. Question Mark (High Growth, Low Market Share)
- 4.3.4. Dogs (Low Growth, Low Market Share)
- 4.4. Ansoff Matrix Analysis
- 4.5. Supply Chain Analysis
- 4.6. Regulatory Landscape
- 4.7. Current Market Potential and Opportunity Assessment (TAM–SAM–SOM Framework)
- 4.8. PRI Analyst Note
- 4.1. Porters Five Forces
- 5. Market Analysis, Insights and Forecast 2021-2033
- 5.1. Market Analysis, Insights and Forecast - by Type
- 5.1.1. Natural Graphite
- 5.1.2. Synthetic Graphite
- 5.2. Market Analysis, Insights and Forecast - by Application
- 5.2.1. Electrodes
- 5.2.2. Refractories, Casting, and Foundries
- 5.2.3. Batteries
- 5.2.4. Lubricants
- 5.2.5. Other Applications
- 5.3. Market Analysis, Insights and Forecast - by End-user Industry
- 5.3.1. Electronics
- 5.3.2. Metallurgy
- 5.3.3. Automotive (Includes EV/HEV Vehicles)
- 5.3.4. Other End-user Industries
- 5.4. Market Analysis, Insights and Forecast - by Region
- 5.4.1. Asia Pacific
- 5.4.2. North America
- 5.4.3. Europe
- 5.4.4. South America
- 5.4.5. Middle East and Africa
- 5.1. Market Analysis, Insights and Forecast - by Type
- 6. Global Graphite Market Analysis, Insights and Forecast, 2021-2033
- 6.1. Market Analysis, Insights and Forecast - by Type
- 6.1.1. Natural Graphite
- 6.1.2. Synthetic Graphite
- 6.2. Market Analysis, Insights and Forecast - by Application
- 6.2.1. Electrodes
- 6.2.2. Refractories, Casting, and Foundries
- 6.2.3. Batteries
- 6.2.4. Lubricants
- 6.2.5. Other Applications
- 6.3. Market Analysis, Insights and Forecast - by End-user Industry
- 6.3.1. Electronics
- 6.3.2. Metallurgy
- 6.3.3. Automotive (Includes EV/HEV Vehicles)
- 6.3.4. Other End-user Industries
- 6.1. Market Analysis, Insights and Forecast - by Type
- 7. Asia Pacific Graphite Market Analysis, Insights and Forecast, 2020-2032
- 7.1. Market Analysis, Insights and Forecast - by Type
- 7.1.1. Natural Graphite
- 7.1.2. Synthetic Graphite
- 7.2. Market Analysis, Insights and Forecast - by Application
- 7.2.1. Electrodes
- 7.2.2. Refractories, Casting, and Foundries
- 7.2.3. Batteries
- 7.2.4. Lubricants
- 7.2.5. Other Applications
- 7.3. Market Analysis, Insights and Forecast - by End-user Industry
- 7.3.1. Electronics
- 7.3.2. Metallurgy
- 7.3.3. Automotive (Includes EV/HEV Vehicles)
- 7.3.4. Other End-user Industries
- 7.1. Market Analysis, Insights and Forecast - by Type
- 8. North America Graphite Market Analysis, Insights and Forecast, 2020-2032
- 8.1. Market Analysis, Insights and Forecast - by Type
- 8.1.1. Natural Graphite
- 8.1.2. Synthetic Graphite
- 8.2. Market Analysis, Insights and Forecast - by Application
- 8.2.1. Electrodes
- 8.2.2. Refractories, Casting, and Foundries
- 8.2.3. Batteries
- 8.2.4. Lubricants
- 8.2.5. Other Applications
- 8.3. Market Analysis, Insights and Forecast - by End-user Industry
- 8.3.1. Electronics
- 8.3.2. Metallurgy
- 8.3.3. Automotive (Includes EV/HEV Vehicles)
- 8.3.4. Other End-user Industries
- 8.1. Market Analysis, Insights and Forecast - by Type
- 9. Europe Graphite Market Analysis, Insights and Forecast, 2020-2032
- 9.1. Market Analysis, Insights and Forecast - by Type
- 9.1.1. Natural Graphite
- 9.1.2. Synthetic Graphite
- 9.2. Market Analysis, Insights and Forecast - by Application
- 9.2.1. Electrodes
- 9.2.2. Refractories, Casting, and Foundries
- 9.2.3. Batteries
- 9.2.4. Lubricants
- 9.2.5. Other Applications
- 9.3. Market Analysis, Insights and Forecast - by End-user Industry
- 9.3.1. Electronics
- 9.3.2. Metallurgy
- 9.3.3. Automotive (Includes EV/HEV Vehicles)
- 9.3.4. Other End-user Industries
- 9.1. Market Analysis, Insights and Forecast - by Type
- 10. South America Graphite Market Analysis, Insights and Forecast, 2020-2032
- 10.1. Market Analysis, Insights and Forecast - by Type
- 10.1.1. Natural Graphite
- 10.1.2. Synthetic Graphite
- 10.2. Market Analysis, Insights and Forecast - by Application
- 10.2.1. Electrodes
- 10.2.2. Refractories, Casting, and Foundries
- 10.2.3. Batteries
- 10.2.4. Lubricants
- 10.2.5. Other Applications
- 10.3. Market Analysis, Insights and Forecast - by End-user Industry
- 10.3.1. Electronics
- 10.3.2. Metallurgy
- 10.3.3. Automotive (Includes EV/HEV Vehicles)
- 10.3.4. Other End-user Industries
- 10.1. Market Analysis, Insights and Forecast - by Type
- 11. Middle East and Africa Graphite Market Analysis, Insights and Forecast, 2020-2032
- 11.1. Market Analysis, Insights and Forecast - by Type
- 11.1.1. Natural Graphite
- 11.1.2. Synthetic Graphite
- 11.2. Market Analysis, Insights and Forecast - by Application
- 11.2.1. Electrodes
- 11.2.2. Refractories, Casting, and Foundries
- 11.2.3. Batteries
- 11.2.4. Lubricants
- 11.2.5. Other Applications
- 11.3. Market Analysis, Insights and Forecast - by End-user Industry
- 11.3.1. Electronics
- 11.3.2. Metallurgy
- 11.3.3. Automotive (Includes EV/HEV Vehicles)
- 11.3.4. Other End-user Industries
- 11.1. Market Analysis, Insights and Forecast - by Type
- 12. Competitive Analysis
- 12.1. Company Profiles
- 12.1.1 SGL Carbon
- 12.1.1.1. Company Overview
- 12.1.1.2. Products
- 12.1.1.3. Company Financials
- 12.1.1.4. SWOT Analysis
- 12.1.2 Showa Denko K k
- 12.1.2.1. Company Overview
- 12.1.2.2. Products
- 12.1.2.3. Company Financials
- 12.1.2.4. SWOT Analysis
- 12.1.3 Asbury Carbons
- 12.1.3.1. Company Overview
- 12.1.3.2. Products
- 12.1.3.3. Company Financials
- 12.1.3.4. SWOT Analysis
- 12.1.4 Tokai Carbon Co Ltd
- 12.1.4.1. Company Overview
- 12.1.4.2. Products
- 12.1.4.3. Company Financials
- 12.1.4.4. SWOT Analysis
- 12.1.5 Northern Graphite Corp
- 12.1.5.1. Company Overview
- 12.1.5.2. Products
- 12.1.5.3. Company Financials
- 12.1.5.4. SWOT Analysis
- 12.1.6 Mason Graphite Inc
- 12.1.6.1. Company Overview
- 12.1.6.2. Products
- 12.1.6.3. Company Financials
- 12.1.6.4. SWOT Analysis
- 12.1.7 Triton Minerals
- 12.1.7.1. Company Overview
- 12.1.7.2. Products
- 12.1.7.3. Company Financials
- 12.1.7.4. SWOT Analysis
- 12.1.8 BTR New Material Group Co Ltd
- 12.1.8.1. Company Overview
- 12.1.8.2. Products
- 12.1.8.3. Company Financials
- 12.1.8.4. SWOT Analysis
- 12.1.9 Jiangxi Zichen Technology Co Ltd
- 12.1.9.1. Company Overview
- 12.1.9.2. Products
- 12.1.9.3. Company Financials
- 12.1.9.4. SWOT Analysis
- 12.1.10 Imerys
- 12.1.10.1. Company Overview
- 12.1.10.2. Products
- 12.1.10.3. Company Financials
- 12.1.10.4. SWOT Analysis
- 12.1.11 Shanghai Shanshan Technology Co Ltd
- 12.1.11.1. Company Overview
- 12.1.11.2. Products
- 12.1.11.3. Company Financials
- 12.1.11.4. SWOT Analysis
- 12.1.12 Syrah Resources Limited
- 12.1.12.1. Company Overview
- 12.1.12.2. Products
- 12.1.12.3. Company Financials
- 12.1.12.4. SWOT Analysis
- 12.1.13 Shenzhen Xiangfenghua Technology Co Ltd
- 12.1.13.1. Company Overview
- 12.1.13.2. Products
- 12.1.13.3. Company Financials
- 12.1.13.4. SWOT Analysis
- 12.1.14 Nippon Kokuen Group
- 12.1.14.1. Company Overview
- 12.1.14.2. Products
- 12.1.14.3. Company Financials
- 12.1.14.4. SWOT Analysis
- 12.1.1 SGL Carbon
- 12.2. Market Entropy
- 12.2.1 Company's Key Areas Served
- 12.2.2 Recent Developments
- 12.3. Company Market Share Analysis 2025
- 12.3.1 Top 5 Companies Market Share Analysis
- 12.3.2 Top 3 Companies Market Share Analysis
- 12.4. List of Potential Customers
- 13. Research Methodology
List of Figures
- Figure 1: Global Graphite Market Revenue Breakdown (billion, %) by Region 2025 & 2033
- Figure 2: Global Graphite Market Volume Breakdown (K Tons, %) by Region 2025 & 2033
- Figure 3: Asia Pacific Graphite Market Revenue (billion), by Type 2025 & 2033
- Figure 4: Asia Pacific Graphite Market Volume (K Tons), by Type 2025 & 2033
- Figure 5: Asia Pacific Graphite Market Revenue Share (%), by Type 2025 & 2033
- Figure 6: Asia Pacific Graphite Market Volume Share (%), by Type 2025 & 2033
- Figure 7: Asia Pacific Graphite Market Revenue (billion), by Application 2025 & 2033
- Figure 8: Asia Pacific Graphite Market Volume (K Tons), by Application 2025 & 2033
- Figure 9: Asia Pacific Graphite Market Revenue Share (%), by Application 2025 & 2033
- Figure 10: Asia Pacific Graphite Market Volume Share (%), by Application 2025 & 2033
- Figure 11: Asia Pacific Graphite Market Revenue (billion), by End-user Industry 2025 & 2033
- Figure 12: Asia Pacific Graphite Market Volume (K Tons), by End-user Industry 2025 & 2033
- Figure 13: Asia Pacific Graphite Market Revenue Share (%), by End-user Industry 2025 & 2033
- Figure 14: Asia Pacific Graphite Market Volume Share (%), by End-user Industry 2025 & 2033
- Figure 15: Asia Pacific Graphite Market Revenue (billion), by Country 2025 & 2033
- Figure 16: Asia Pacific Graphite Market Volume (K Tons), by Country 2025 & 2033
- Figure 17: Asia Pacific Graphite Market Revenue Share (%), by Country 2025 & 2033
- Figure 18: Asia Pacific Graphite Market Volume Share (%), by Country 2025 & 2033
- Figure 19: North America Graphite Market Revenue (billion), by Type 2025 & 2033
- Figure 20: North America Graphite Market Volume (K Tons), by Type 2025 & 2033
- Figure 21: North America Graphite Market Revenue Share (%), by Type 2025 & 2033
- Figure 22: North America Graphite Market Volume Share (%), by Type 2025 & 2033
- Figure 23: North America Graphite Market Revenue (billion), by Application 2025 & 2033
- Figure 24: North America Graphite Market Volume (K Tons), by Application 2025 & 2033
- Figure 25: North America Graphite Market Revenue Share (%), by Application 2025 & 2033
- Figure 26: North America Graphite Market Volume Share (%), by Application 2025 & 2033
- Figure 27: North America Graphite Market Revenue (billion), by End-user Industry 2025 & 2033
- Figure 28: North America Graphite Market Volume (K Tons), by End-user Industry 2025 & 2033
- Figure 29: North America Graphite Market Revenue Share (%), by End-user Industry 2025 & 2033
- Figure 30: North America Graphite Market Volume Share (%), by End-user Industry 2025 & 2033
- Figure 31: North America Graphite Market Revenue (billion), by Country 2025 & 2033
- Figure 32: North America Graphite Market Volume (K Tons), by Country 2025 & 2033
- Figure 33: North America Graphite Market Revenue Share (%), by Country 2025 & 2033
- Figure 34: North America Graphite Market Volume Share (%), by Country 2025 & 2033
- Figure 35: Europe Graphite Market Revenue (billion), by Type 2025 & 2033
- Figure 36: Europe Graphite Market Volume (K Tons), by Type 2025 & 2033
- Figure 37: Europe Graphite Market Revenue Share (%), by Type 2025 & 2033
- Figure 38: Europe Graphite Market Volume Share (%), by Type 2025 & 2033
- Figure 39: Europe Graphite Market Revenue (billion), by Application 2025 & 2033
- Figure 40: Europe Graphite Market Volume (K Tons), by Application 2025 & 2033
- Figure 41: Europe Graphite Market Revenue Share (%), by Application 2025 & 2033
- Figure 42: Europe Graphite Market Volume Share (%), by Application 2025 & 2033
- Figure 43: Europe Graphite Market Revenue (billion), by End-user Industry 2025 & 2033
- Figure 44: Europe Graphite Market Volume (K Tons), by End-user Industry 2025 & 2033
- Figure 45: Europe Graphite Market Revenue Share (%), by End-user Industry 2025 & 2033
- Figure 46: Europe Graphite Market Volume Share (%), by End-user Industry 2025 & 2033
- Figure 47: Europe Graphite Market Revenue (billion), by Country 2025 & 2033
- Figure 48: Europe Graphite Market Volume (K Tons), by Country 2025 & 2033
- Figure 49: Europe Graphite Market Revenue Share (%), by Country 2025 & 2033
- Figure 50: Europe Graphite Market Volume Share (%), by Country 2025 & 2033
- Figure 51: South America Graphite Market Revenue (billion), by Type 2025 & 2033
- Figure 52: South America Graphite Market Volume (K Tons), by Type 2025 & 2033
- Figure 53: South America Graphite Market Revenue Share (%), by Type 2025 & 2033
- Figure 54: South America Graphite Market Volume Share (%), by Type 2025 & 2033
- Figure 55: South America Graphite Market Revenue (billion), by Application 2025 & 2033
- Figure 56: South America Graphite Market Volume (K Tons), by Application 2025 & 2033
- Figure 57: South America Graphite Market Revenue Share (%), by Application 2025 & 2033
- Figure 58: South America Graphite Market Volume Share (%), by Application 2025 & 2033
- Figure 59: South America Graphite Market Revenue (billion), by End-user Industry 2025 & 2033
- Figure 60: South America Graphite Market Volume (K Tons), by End-user Industry 2025 & 2033
- Figure 61: South America Graphite Market Revenue Share (%), by End-user Industry 2025 & 2033
- Figure 62: South America Graphite Market Volume Share (%), by End-user Industry 2025 & 2033
- Figure 63: South America Graphite Market Revenue (billion), by Country 2025 & 2033
- Figure 64: South America Graphite Market Volume (K Tons), by Country 2025 & 2033
- Figure 65: South America Graphite Market Revenue Share (%), by Country 2025 & 2033
- Figure 66: South America Graphite Market Volume Share (%), by Country 2025 & 2033
- Figure 67: Middle East and Africa Graphite Market Revenue (billion), by Type 2025 & 2033
- Figure 68: Middle East and Africa Graphite Market Volume (K Tons), by Type 2025 & 2033
- Figure 69: Middle East and Africa Graphite Market Revenue Share (%), by Type 2025 & 2033
- Figure 70: Middle East and Africa Graphite Market Volume Share (%), by Type 2025 & 2033
- Figure 71: Middle East and Africa Graphite Market Revenue (billion), by Application 2025 & 2033
- Figure 72: Middle East and Africa Graphite Market Volume (K Tons), by Application 2025 & 2033
- Figure 73: Middle East and Africa Graphite Market Revenue Share (%), by Application 2025 & 2033
- Figure 74: Middle East and Africa Graphite Market Volume Share (%), by Application 2025 & 2033
- Figure 75: Middle East and Africa Graphite Market Revenue (billion), by End-user Industry 2025 & 2033
- Figure 76: Middle East and Africa Graphite Market Volume (K Tons), by End-user Industry 2025 & 2033
- Figure 77: Middle East and Africa Graphite Market Revenue Share (%), by End-user Industry 2025 & 2033
- Figure 78: Middle East and Africa Graphite Market Volume Share (%), by End-user Industry 2025 & 2033
- Figure 79: Middle East and Africa Graphite Market Revenue (billion), by Country 2025 & 2033
- Figure 80: Middle East and Africa Graphite Market Volume (K Tons), by Country 2025 & 2033
- Figure 81: Middle East and Africa Graphite Market Revenue Share (%), by Country 2025 & 2033
- Figure 82: Middle East and Africa Graphite Market Volume Share (%), by Country 2025 & 2033
List of Tables
- Table 1: Global Graphite Market Revenue billion Forecast, by Type 2020 & 2033
- Table 2: Global Graphite Market Volume K Tons Forecast, by Type 2020 & 2033
- Table 3: Global Graphite Market Revenue billion Forecast, by Application 2020 & 2033
- Table 4: Global Graphite Market Volume K Tons Forecast, by Application 2020 & 2033
- Table 5: Global Graphite Market Revenue billion Forecast, by End-user Industry 2020 & 2033
- Table 6: Global Graphite Market Volume K Tons Forecast, by End-user Industry 2020 & 2033
- Table 7: Global Graphite Market Revenue billion Forecast, by Region 2020 & 2033
- Table 8: Global Graphite Market Volume K Tons Forecast, by Region 2020 & 2033
- Table 9: Global Graphite Market Revenue billion Forecast, by Type 2020 & 2033
- Table 10: Global Graphite Market Volume K Tons Forecast, by Type 2020 & 2033
- Table 11: Global Graphite Market Revenue billion Forecast, by Application 2020 & 2033
- Table 12: Global Graphite Market Volume K Tons Forecast, by Application 2020 & 2033
- Table 13: Global Graphite Market Revenue billion Forecast, by End-user Industry 2020 & 2033
- Table 14: Global Graphite Market Volume K Tons Forecast, by End-user Industry 2020 & 2033
- Table 15: Global Graphite Market Revenue billion Forecast, by Country 2020 & 2033
- Table 16: Global Graphite Market Volume K Tons Forecast, by Country 2020 & 2033
- Table 17: China Graphite Market Revenue (billion) Forecast, by Application 2020 & 2033
- Table 18: China Graphite Market Volume (K Tons) Forecast, by Application 2020 & 2033
- Table 19: India Graphite Market Revenue (billion) Forecast, by Application 2020 & 2033
- Table 20: India Graphite Market Volume (K Tons) Forecast, by Application 2020 & 2033
- Table 21: Japan Graphite Market Revenue (billion) Forecast, by Application 2020 & 2033
- Table 22: Japan Graphite Market Volume (K Tons) Forecast, by Application 2020 & 2033
- Table 23: South Korea Graphite Market Revenue (billion) Forecast, by Application 2020 & 2033
- Table 24: South Korea Graphite Market Volume (K Tons) Forecast, by Application 2020 & 2033
- Table 25: Rest of Asia Pacific Graphite Market Revenue (billion) Forecast, by Application 2020 & 2033
- Table 26: Rest of Asia Pacific Graphite Market Volume (K Tons) Forecast, by Application 2020 & 2033
- Table 27: Global Graphite Market Revenue billion Forecast, by Type 2020 & 2033
- Table 28: Global Graphite Market Volume K Tons Forecast, by Type 2020 & 2033
- Table 29: Global Graphite Market Revenue billion Forecast, by Application 2020 & 2033
- Table 30: Global Graphite Market Volume K Tons Forecast, by Application 2020 & 2033
- Table 31: Global Graphite Market Revenue billion Forecast, by End-user Industry 2020 & 2033
- Table 32: Global Graphite Market Volume K Tons Forecast, by End-user Industry 2020 & 2033
- Table 33: Global Graphite Market Revenue billion Forecast, by Country 2020 & 2033
- Table 34: Global Graphite Market Volume K Tons Forecast, by Country 2020 & 2033
- Table 35: United States Graphite Market Revenue (billion) Forecast, by Application 2020 & 2033
- Table 36: United States Graphite Market Volume (K Tons) Forecast, by Application 2020 & 2033
- Table 37: Canada Graphite Market Revenue (billion) Forecast, by Application 2020 & 2033
- Table 38: Canada Graphite Market Volume (K Tons) Forecast, by Application 2020 & 2033
- Table 39: Mexico Graphite Market Revenue (billion) Forecast, by Application 2020 & 2033
- Table 40: Mexico Graphite Market Volume (K Tons) Forecast, by Application 2020 & 2033
- Table 41: Global Graphite Market Revenue billion Forecast, by Type 2020 & 2033
- Table 42: Global Graphite Market Volume K Tons Forecast, by Type 2020 & 2033
- Table 43: Global Graphite Market Revenue billion Forecast, by Application 2020 & 2033
- Table 44: Global Graphite Market Volume K Tons Forecast, by Application 2020 & 2033
- Table 45: Global Graphite Market Revenue billion Forecast, by End-user Industry 2020 & 2033
- Table 46: Global Graphite Market Volume K Tons Forecast, by End-user Industry 2020 & 2033
- Table 47: Global Graphite Market Revenue billion Forecast, by Country 2020 & 2033
- Table 48: Global Graphite Market Volume K Tons Forecast, by Country 2020 & 2033
- Table 49: Germany Graphite Market Revenue (billion) Forecast, by Application 2020 & 2033
- Table 50: Germany Graphite Market Volume (K Tons) Forecast, by Application 2020 & 2033
- Table 51: United Kingdom Graphite Market Revenue (billion) Forecast, by Application 2020 & 2033
- Table 52: United Kingdom Graphite Market Volume (K Tons) Forecast, by Application 2020 & 2033
- Table 53: Italy Graphite Market Revenue (billion) Forecast, by Application 2020 & 2033
- Table 54: Italy Graphite Market Volume (K Tons) Forecast, by Application 2020 & 2033
- Table 55: France Graphite Market Revenue (billion) Forecast, by Application 2020 & 2033
- Table 56: France Graphite Market Volume (K Tons) Forecast, by Application 2020 & 2033
- Table 57: Russia Graphite Market Revenue (billion) Forecast, by Application 2020 & 2033
- Table 58: Russia Graphite Market Volume (K Tons) Forecast, by Application 2020 & 2033
- Table 59: Rest of Europe Graphite Market Revenue (billion) Forecast, by Application 2020 & 2033
- Table 60: Rest of Europe Graphite Market Volume (K Tons) Forecast, by Application 2020 & 2033
- Table 61: Global Graphite Market Revenue billion Forecast, by Type 2020 & 2033
- Table 62: Global Graphite Market Volume K Tons Forecast, by Type 2020 & 2033
- Table 63: Global Graphite Market Revenue billion Forecast, by Application 2020 & 2033
- Table 64: Global Graphite Market Volume K Tons Forecast, by Application 2020 & 2033
- Table 65: Global Graphite Market Revenue billion Forecast, by End-user Industry 2020 & 2033
- Table 66: Global Graphite Market Volume K Tons Forecast, by End-user Industry 2020 & 2033
- Table 67: Global Graphite Market Revenue billion Forecast, by Country 2020 & 2033
- Table 68: Global Graphite Market Volume K Tons Forecast, by Country 2020 & 2033
- Table 69: Brazil Graphite Market Revenue (billion) Forecast, by Application 2020 & 2033
- Table 70: Brazil Graphite Market Volume (K Tons) Forecast, by Application 2020 & 2033
- Table 71: Argentina Graphite Market Revenue (billion) Forecast, by Application 2020 & 2033
- Table 72: Argentina Graphite Market Volume (K Tons) Forecast, by Application 2020 & 2033
- Table 73: Rest of South America Graphite Market Revenue (billion) Forecast, by Application 2020 & 2033
- Table 74: Rest of South America Graphite Market Volume (K Tons) Forecast, by Application 2020 & 2033
- Table 75: Global Graphite Market Revenue billion Forecast, by Type 2020 & 2033
- Table 76: Global Graphite Market Volume K Tons Forecast, by Type 2020 & 2033
- Table 77: Global Graphite Market Revenue billion Forecast, by Application 2020 & 2033
- Table 78: Global Graphite Market Volume K Tons Forecast, by Application 2020 & 2033
- Table 79: Global Graphite Market Revenue billion Forecast, by End-user Industry 2020 & 2033
- Table 80: Global Graphite Market Volume K Tons Forecast, by End-user Industry 2020 & 2033
- Table 81: Global Graphite Market Revenue billion Forecast, by Country 2020 & 2033
- Table 82: Global Graphite Market Volume K Tons Forecast, by Country 2020 & 2033
- Table 83: Saudi Arabia Graphite Market Revenue (billion) Forecast, by Application 2020 & 2033
- Table 84: Saudi Arabia Graphite Market Volume (K Tons) Forecast, by Application 2020 & 2033
- Table 85: South Africa Graphite Market Revenue (billion) Forecast, by Application 2020 & 2033
- Table 86: South Africa Graphite Market Volume (K Tons) Forecast, by Application 2020 & 2033
- Table 87: Rest of Middle East and Africa Graphite Market Revenue (billion) Forecast, by Application 2020 & 2033
- Table 88: Rest of Middle East and Africa Graphite Market Volume (K Tons) Forecast, by Application 2020 & 2033
Frequently Asked Questions
1. What is the projected Compound Annual Growth Rate (CAGR) of the Graphite Market?
The projected CAGR is approximately 8.42%.
2. Which companies are prominent players in the Graphite Market?
Key companies in the market include SGL Carbon, Showa Denko K k, Asbury Carbons, Tokai Carbon Co Ltd, Northern Graphite Corp, Mason Graphite Inc, Triton Minerals, BTR New Material Group Co Ltd, Jiangxi Zichen Technology Co Ltd, Imerys, Shanghai Shanshan Technology Co Ltd, Syrah Resources Limited, Shenzhen Xiangfenghua Technology Co Ltd, Nippon Kokuen Group.
3. What are the main segments of the Graphite Market?
The market segments include Type, Application, End-user Industry.
4. Can you provide details about the market size?
The market size is estimated to be USD 31.59 billion as of 2022.
5. What are some drivers contributing to market growth?
Augmenting Demand from the Burgeoning Lithium-ion Battery Industry; Increase In Steel Production in Asia and the Middle East.
6. What are the notable trends driving market growth?
The Metallurgy Segment is Expected to Dominate the Market.
7. Are there any restraints impacting market growth?
Stringent Environmental Regulations; Other Restraints.
8. Can you provide examples of recent developments in the market?
October 2022: Syrah Resources Ltd. announced it would supply a key lithium-ion battery component to South Korea's LG Energy Solution Ltd. According to the agreement, the company was to provide 2 kilotons per annum of graphite to LG Energy Solution Ltd. active anode material (AAM) from 2025 and increase it to at least 10 ktpa after its production capacity at its Vidalia facility in Louisiana.
9. What pricing options are available for accessing the report?
Pricing options include single-user, multi-user, and enterprise licenses priced at USD 4750, USD 5250, and USD 8750 respectively.
10. Is the market size provided in terms of value or volume?
The market size is provided in terms of value, measured in billion and volume, measured in K Tons.
11. Are there any specific market keywords associated with the report?
Yes, the market keyword associated with the report is "Graphite Market," which aids in identifying and referencing the specific market segment covered.
12. How do I determine which pricing option suits my needs best?
The pricing options vary based on user requirements and access needs. Individual users may opt for single-user licenses, while businesses requiring broader access may choose multi-user or enterprise licenses for cost-effective access to the report.
13. Are there any additional resources or data provided in the Graphite Market report?
While the report offers comprehensive insights, it's advisable to review the specific contents or supplementary materials provided to ascertain if additional resources or data are available.
14. How can I stay updated on further developments or reports in the Graphite Market?
To stay informed about further developments, trends, and reports in the Graphite Market, consider subscribing to industry newsletters, following relevant companies and organizations, or regularly checking reputable industry news sources and publications.
Methodology
Step 1 - Identification of Relevant Samples Size from Population Database


Step 2 - Approaches for Defining Global Market Size (Value, Volume* & Price*)

Note*: In applicable scenarios
Step 3 - Data Sources
Primary Research
- Web Analytics
- Survey Reports
- Research Institute
- Latest Research Reports
- Opinion Leaders
Secondary Research
- Annual Reports
- White Paper
- Latest Press Release
- Industry Association
- Paid Database
- Investor Presentations

Step 4 - Data Triangulation
Involves using different sources of information in order to increase the validity of a study
These sources are likely to be stakeholders in a program - participants, other researchers, program staff, other community members, and so on.
Then we put all data in single framework & apply various statistical tools to find out the dynamic on the market.
During the analysis stage, feedback from the stakeholder groups would be compared to determine areas of agreement as well as areas of divergence