

Key Insights
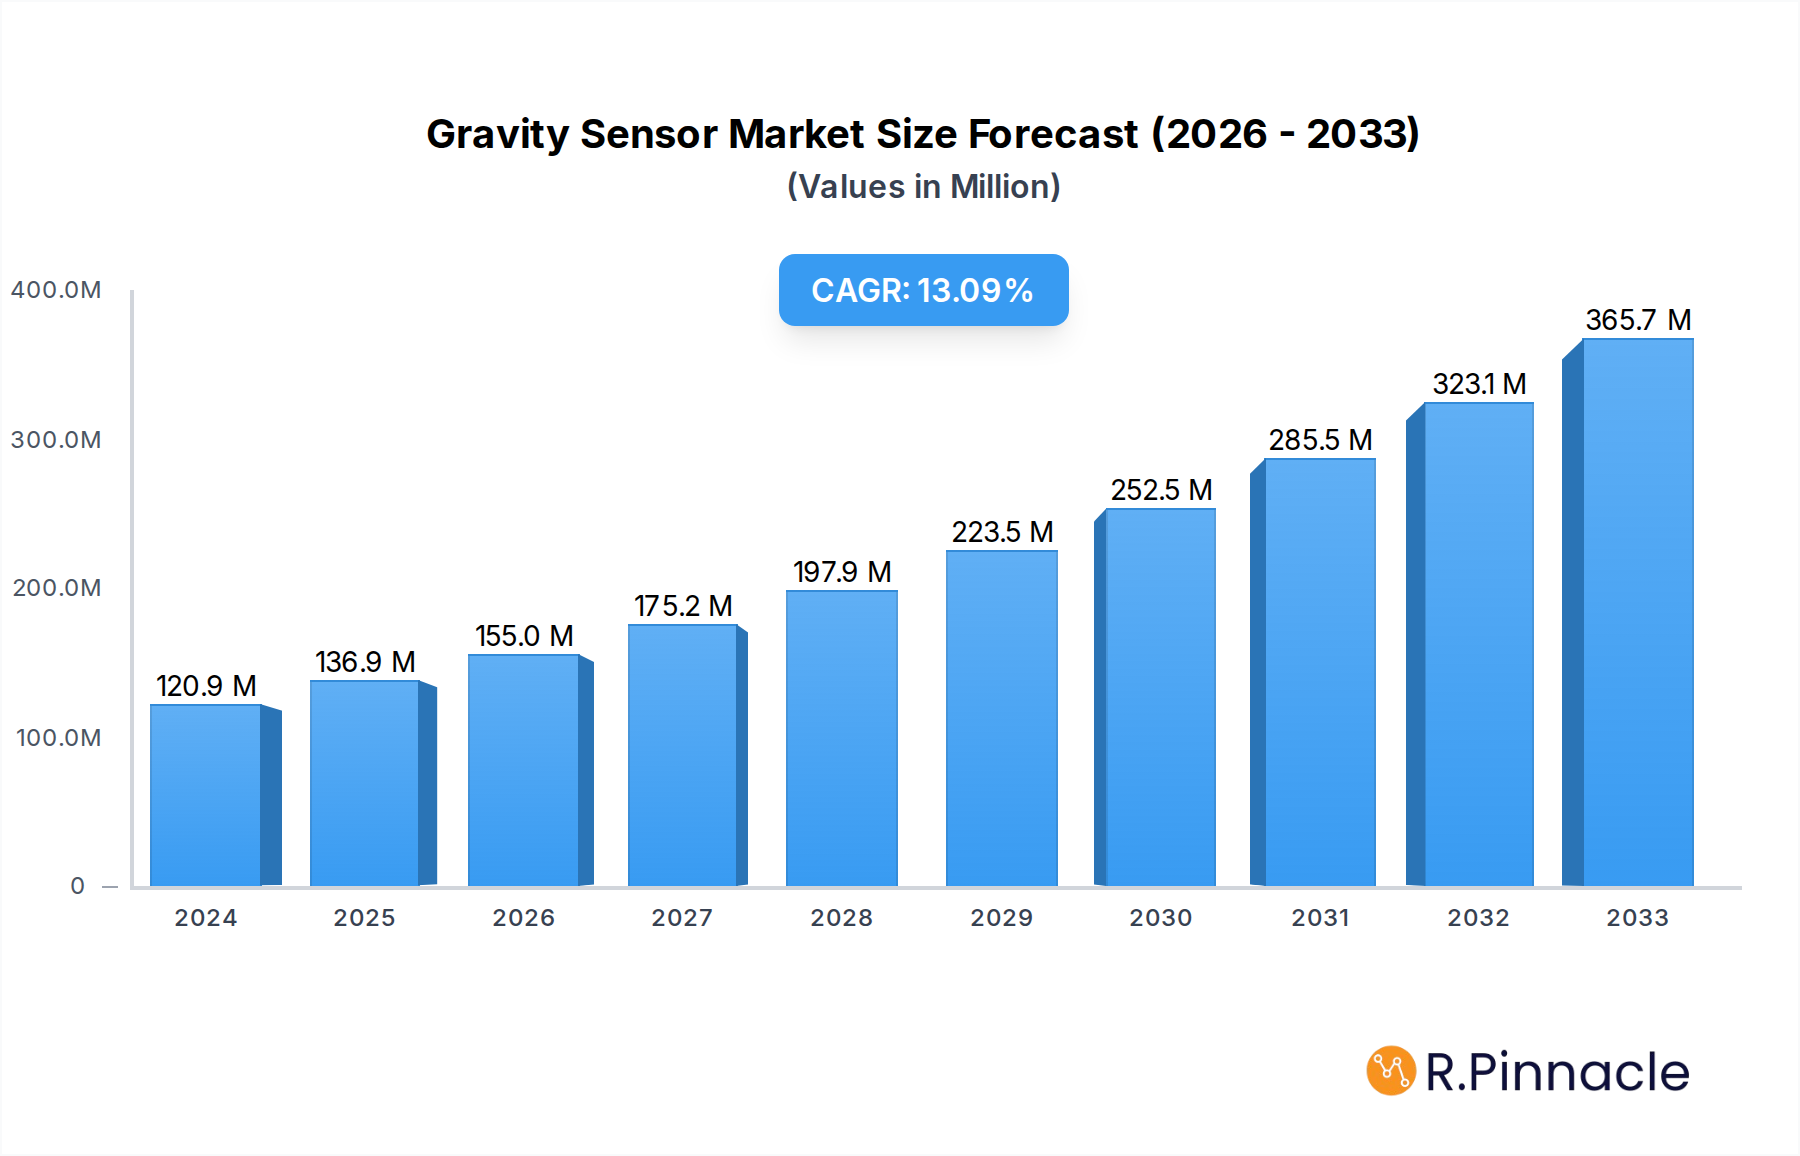
The global Gravity Sensor market is poised for significant expansion, projected to reach USD 120.9 million in 2024 and grow at a robust compound annual growth rate (CAGR) of 13.2% through 2033. This dynamic growth is primarily fueled by the escalating demand for smartphones and tablets, where gravity sensors are integral for features like screen rotation, motion-based gaming, and improved user experience. The automotive sector also presents a substantial growth avenue, driven by the increasing integration of sensors for advanced driver-assistance systems (ADAS), vehicle stability control, and sophisticated navigation. Emerging applications in the "Others" segment, encompassing wearables, industrial automation, and medical devices, are further contributing to the market's upward trajectory. This expanding adoption across diverse consumer and industrial electronics underscores the fundamental role of gravity sensors in modern technology.

Gravity Sensor Market Size (In Million)
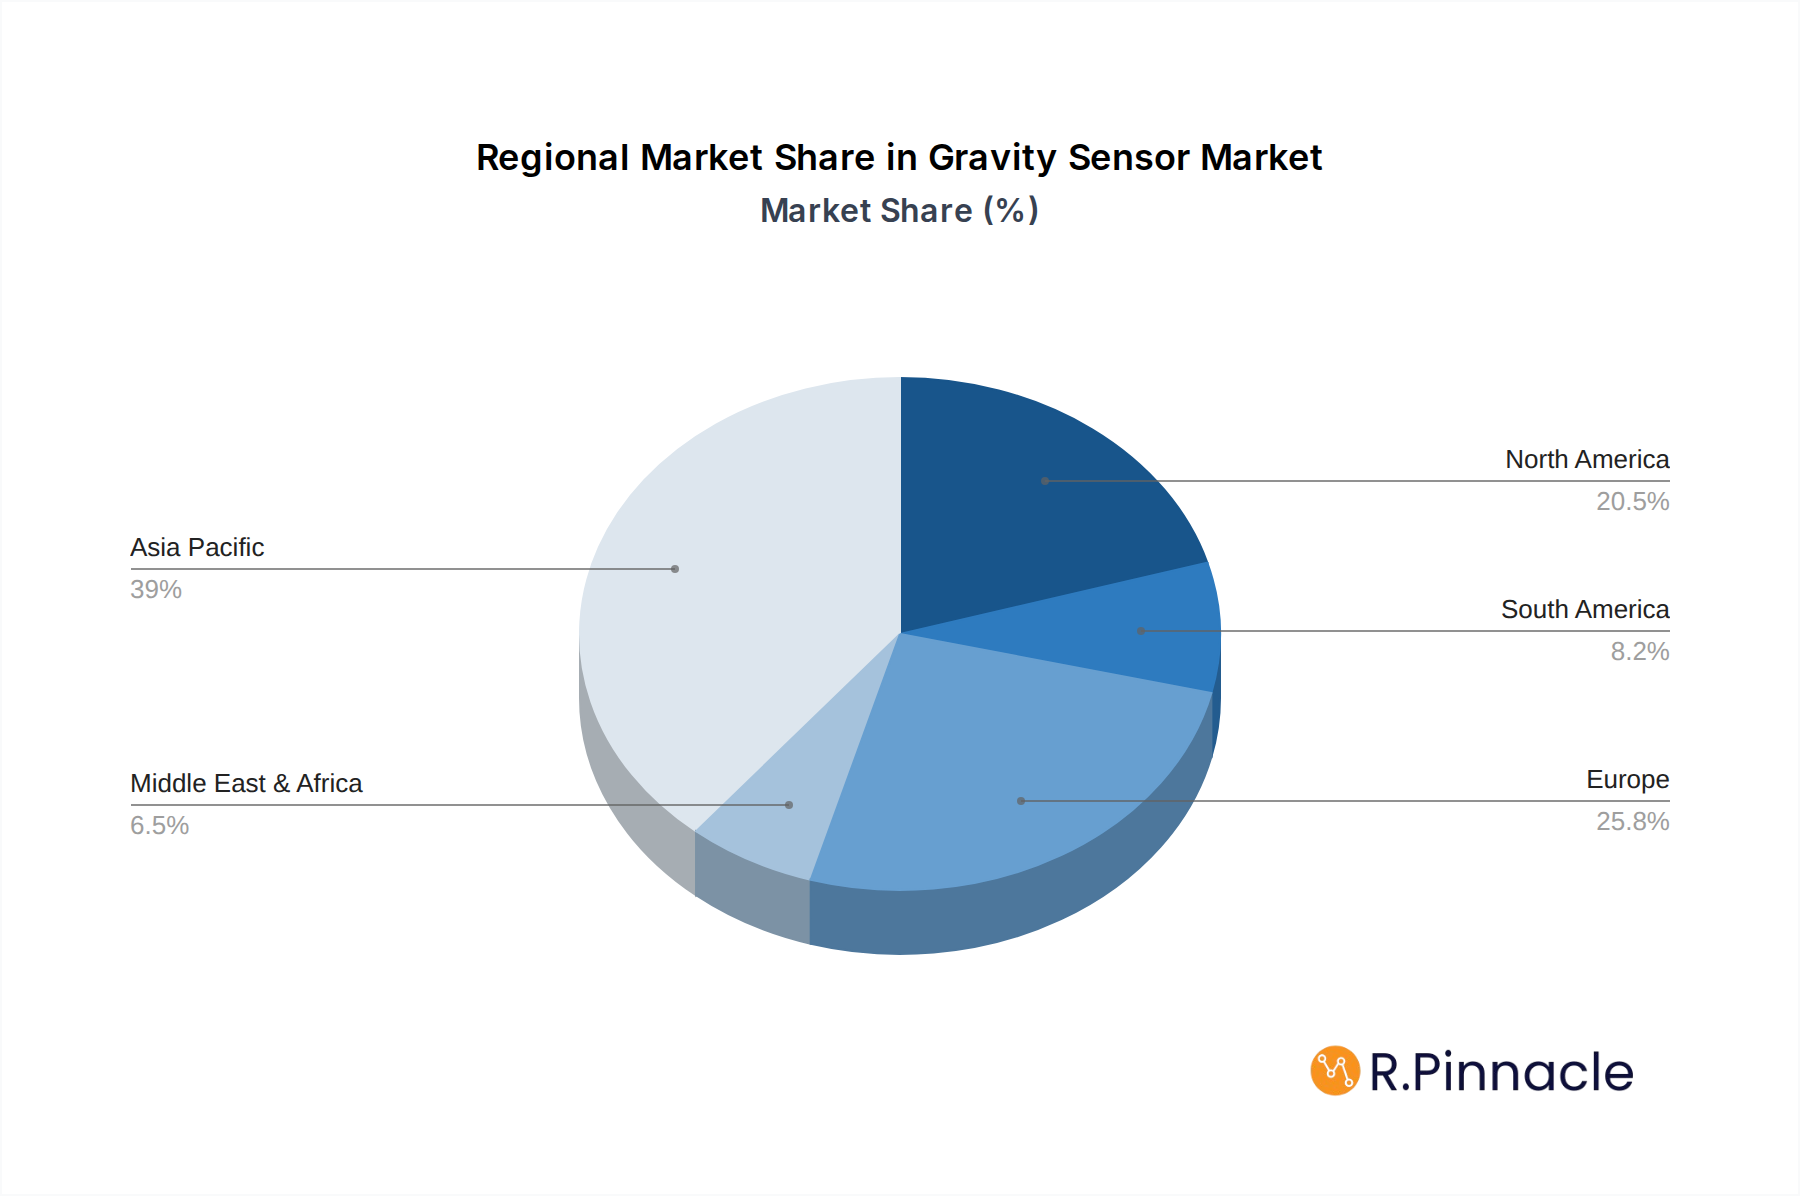
The market is characterized by a clear segmentation between "Normal Sensors" and "High Precision Sensors," with the former likely dominating current volumes due to cost-effectiveness and widespread use in consumer electronics. However, the "High Precision Sensor" segment is anticipated to witness a faster growth rate, driven by specialized applications in automotive safety, industrial robotics, and scientific instrumentation where accuracy is paramount. Key players like Bosch, Murata, and Denso are at the forefront of innovation, developing more compact, energy-efficient, and accurate gravity sensing solutions. Geographically, Asia Pacific is expected to lead the market, propelled by the robust manufacturing capabilities and high consumer electronics demand in countries like China and India. North America and Europe, with their strong focus on automotive advancements and technological innovation, will also remain significant markets.
Gravity Sensor Company Market Share
Gravity Sensor Market Structure & Innovation Trends
The global gravity sensor market exhibits a moderately concentrated structure, with a few dominant players holding significant market share, estimated to be over 70% in 2025. Innovation is primarily driven by advancements in MEMS (Micro-Electro-Mechanical Systems) technology, miniaturization, and improved accuracy, leading to a surge in new product developments. Key innovation drivers include enhanced power efficiency and increased sensitivity in high-precision sensors for sophisticated applications. Regulatory frameworks are evolving, focusing on standardization and safety certifications, particularly for automotive and medical devices. Product substitutes, such as inertial measurement units (IMUs) that integrate accelerometers and gyroscopes, are present but gravity sensors offer distinct advantages in certain use cases due to their simplicity and accuracy in detecting linear acceleration due to gravity. End-user demographics are increasingly sophisticated, demanding higher performance and smaller form factors. Merger and acquisition (M&A) activities, valued at an estimated $1,200 million in the historical period (2019-2024), are strategic moves by larger companies to acquire innovative technologies and expand their product portfolios. For instance, the acquisition of emerging MEMS specialists by established semiconductor manufacturers is a recurring trend.
Gravity Sensor Market Dynamics & Trends
The gravity sensor market is poised for substantial growth, projected to expand at a Compound Annual Growth Rate (CAGR) of approximately 11.5% from 2025 to 2033. This upward trajectory is propelled by a confluence of robust growth drivers. The burgeoning adoption of smart devices, including smartphones, tablets, wearables, and the Internet of Things (IoT) ecosystem, is a primary catalyst. These devices increasingly rely on gravity sensors for orientation detection, motion tracking, and user interface enhancements, contributing to a market penetration rate that is expected to surpass 85% in the smartphone segment by 2028. Technological disruptions are at the forefront, with continuous improvements in MEMS technology leading to smaller, more power-efficient, and highly accurate gravity sensors. Research and development efforts are focused on enhancing sensitivity, reducing noise, and enabling novel functionalities. Consumer preferences are shifting towards more intuitive and immersive user experiences, where gravity sensors play a crucial role in enabling features like automatic screen rotation, gesture recognition, and enhanced gaming. The competitive landscape is characterized by intense innovation and strategic partnerships. Leading manufacturers are investing heavily in R&D to maintain a competitive edge, offering differentiated products that cater to specific application needs. The automotive sector is another significant growth engine, with gravity sensors being integrated into advanced driver-assistance systems (ADAS), electronic stability control (ESC), and infotainment systems, demanding higher precision and reliability. The increasing demand for compact and energy-efficient solutions across various consumer electronics further fuels market expansion. The "Others" segment, encompassing industrial automation, robotics, and healthcare devices, is also witnessing steady growth as gravity sensors find applications in precision measurement, navigation, and patient monitoring. The projected market size for gravity sensors is estimated to reach $7,500 million by 2033.
Dominant Regions & Segments in Gravity Sensor
The Asia Pacific region is emerging as the dominant force in the global gravity sensor market, with China leading the charge in terms of both production and consumption. This dominance is underpinned by a robust manufacturing ecosystem for consumer electronics and automotive components, coupled with favorable government policies promoting technological innovation and industrial growth. The region's economic policies actively support the semiconductor industry, leading to significant investments in research and development and large-scale production facilities. The infrastructure in countries like China, South Korea, and Taiwan is well-developed, facilitating the seamless integration of gravity sensors into a wide array of electronic devices.
Application: Smartphone and Tablets remains the largest and most influential segment, accounting for an estimated 65% of the market share in 2025. The ubiquitous nature of smartphones and tablets, coupled with the continuous demand for enhanced user experiences and new functionalities, drives this segment's dominance. Key drivers include the integration of advanced features such as augmented reality (AR), virtual reality (VR), and sophisticated gaming, all of which rely heavily on accurate motion and orientation sensing.
Type: Normal Sensor holds a significant portion of the market due to its widespread use in cost-sensitive consumer electronics. However, the High Precision Sensor segment is experiencing accelerated growth, driven by its increasing adoption in critical applications like automotive safety systems, medical devices, and industrial automation where accuracy and reliability are paramount. The development of advanced algorithms and improved MEMS fabrication processes are key to the advancement of high-precision sensors. The market penetration of high-precision sensors is expected to witness a CAGR of 13.2% during the forecast period.
The Automotive segment is a rapidly expanding domain, fueled by the increasing integration of ADAS, autonomous driving technologies, and in-car entertainment systems. Gravity sensors are crucial for detecting vehicle pitch and roll, aiding in stability control and navigation. The market for gravity sensors in automotive applications is projected to reach $1,800 million by 2030.
Gravity Sensor Product Innovations
Recent product innovations in the gravity sensor market are characterized by a relentless pursuit of miniaturization, improved power efficiency, and enhanced accuracy. Manufacturers are developing ultra-compact gravity sensors with dimensions as small as xx mm², making them ideal for integration into space-constrained devices like wearables and miniaturized medical implants. Innovations in MEMS fabrication have led to a significant reduction in power consumption, enabling extended battery life for portable electronics. Furthermore, advanced signal processing techniques are enhancing the signal-to-noise ratio, resulting in higher precision gravity sensing capabilities critical for applications in autonomous navigation and industrial robotics. These advancements are creating competitive advantages by enabling new functionalities and improving the performance of existing applications.
Report Scope & Segmentation Analysis
This report provides a comprehensive analysis of the gravity sensor market, segmented by application and type.
Application Segmentation: The Smartphone and Tablets segment is projected to dominate the market, driven by the increasing demand for enhanced user experiences and immersive technologies. Growth in this segment is estimated at 10.8% CAGR. The Automotive segment is expected to witness robust growth, fueled by the increasing adoption of ADAS and autonomous driving features. This segment's market size is forecast to reach $1,800 million by 2030, with a CAGR of 12.5%. The Others segment, encompassing industrial automation, healthcare, and consumer electronics beyond smartphones, presents diverse opportunities with steady growth projections, estimated at 9.5% CAGR.
Type Segmentation: The Normal Sensor segment, catering to general-purpose applications, will continue to hold a substantial market share. However, the High Precision Sensor segment is anticipated to experience the fastest growth, driven by the stringent accuracy requirements of advanced applications. This segment is projected to grow at a CAGR of 13.2%, with a market size expected to reach $2,500 million by 2030. The competitive dynamics within each segment are characterized by technological advancements and strategic partnerships.
Key Drivers of Gravity Sensor Growth
The growth of the gravity sensor market is primarily propelled by the ubiquitous integration of these sensors into an ever-expanding array of electronic devices. The relentless pursuit of enhanced user experiences in smartphones and tablets, demanding features like automatic screen rotation, gesture control, and augmented reality, is a significant driver. In the automotive sector, the escalating adoption of Advanced Driver-Assistance Systems (ADAS), electronic stability control (ESC), and future autonomous driving technologies necessitates highly accurate gravity sensing for stability and navigation. Technologically, advancements in MEMS fabrication and miniaturization are enabling the development of smaller, more power-efficient, and cost-effective gravity sensors, widening their applicability. Furthermore, the growing demand for wearable technology and IoT devices, where compact size and low power consumption are critical, presents substantial growth opportunities.
Challenges in the Gravity Sensor Sector
Despite the promising growth outlook, the gravity sensor sector faces several challenges. Intense price competition, particularly in the consumer electronics segment, can squeeze profit margins for manufacturers. Supply chain disruptions, as witnessed in recent years, can impact the availability of essential components and raw materials, leading to production delays and increased costs. Stringent quality control and reliability requirements, especially for automotive and medical applications, necessitate significant investment in testing and validation, adding to development expenses. Furthermore, the rapid pace of technological obsolescence requires continuous R&D investment to stay competitive, posing a challenge for smaller players with limited resources. The development of alternative sensing technologies that may offer comparable or superior functionality for specific applications could also pose a competitive threat.
Emerging Opportunities in Gravity Sensor
The gravity sensor market is ripe with emerging opportunities driven by technological advancements and evolving consumer demands. The expansion of the Internet of Things (IoT) ecosystem presents a significant opportunity, with gravity sensors finding applications in smart home devices, industrial sensors, and environmental monitoring systems. The burgeoning field of wearable technology, including smartwatches, fitness trackers, and medical monitoring devices, requires miniaturized, low-power gravity sensors for activity tracking and health monitoring. In the healthcare sector, opportunities lie in the development of advanced medical devices for patient rehabilitation, mobility assistance, and diagnostics. The increasing complexity of robotics and automation, both in industrial and service settings, will drive demand for precise orientation and motion sensing capabilities. Furthermore, the development of more sophisticated augmented reality (AR) and virtual reality (VR) applications will require highly accurate and responsive gravity sensors for immersive experiences.
Leading Players in the Gravity Sensor Market
- Philips
- DFRobot
- Bosch
- Hewlett Packard Enterprise (HPE)
- Shenzhen Ligent Sensor
- Knowles Electroincs
- Denso
- MURATA
- ROHM
Key Developments in Gravity Sensor Industry
- 2023 Q4: Bosch launches a new generation of ultra-low-power gravity sensors optimized for wearables and IoT devices.
- 2024 Q1: MURATA introduces a high-precision gravity sensor with enhanced temperature stability for automotive applications.
- 2024 Q2: Knowles Electronics announces a strategic partnership with a leading smartphone manufacturer to integrate its advanced gravity sensing technology.
- 2024 Q3: DFRobot releases a developer-friendly gravity sensor module, fostering innovation in the maker community.
- 2024 Q4: ROHM showcases its latest advancements in miniaturized gravity sensors at a major electronics exhibition.
- 2025 Q1: Shenzhen Ligent Sensor announces expansion of its manufacturing capacity to meet growing demand in the consumer electronics sector.
Future Outlook for Gravity Sensor Market
The future outlook for the gravity sensor market is exceptionally bright, driven by sustained innovation and expanding application landscapes. The relentless progress in MEMS technology will continue to yield smaller, more power-efficient, and increasingly accurate sensors, paving the way for their integration into an even wider array of devices and systems. The automotive industry's push towards greater autonomy and advanced safety features will remain a significant growth accelerator. Moreover, the proliferation of the Internet of Things (IoT) and wearable technology will continue to fuel demand for these essential sensing components. Strategic investments in research and development by key players, coupled with the emergence of new market applications, will solidify the gravity sensor's indispensable role in the future of technology. The market is expected to witness a steady increase in the adoption of high-precision sensors for critical applications, further driving value and innovation.
Gravity Sensor Segmentation
-
1. Application
- 1.1. Smartphone and Tablets
- 1.2. Automotive
- 1.3. Others
-
2. Types
- 2.1. Normal Sensor
- 2.2. High Precision Sensor
Gravity Sensor Segmentation By Geography
-
1. North America
- 1.1. United States
- 1.2. Canada
- 1.3. Mexico
-
2. South America
- 2.1. Brazil
- 2.2. Argentina
- 2.3. Rest of South America
-
3. Europe
- 3.1. United Kingdom
- 3.2. Germany
- 3.3. France
- 3.4. Italy
- 3.5. Spain
- 3.6. Russia
- 3.7. Benelux
- 3.8. Nordics
- 3.9. Rest of Europe
-
4. Middle East & Africa
- 4.1. Turkey
- 4.2. Israel
- 4.3. GCC
- 4.4. North Africa
- 4.5. South Africa
- 4.6. Rest of Middle East & Africa
-
5. Asia Pacific
- 5.1. China
- 5.2. India
- 5.3. Japan
- 5.4. South Korea
- 5.5. ASEAN
- 5.6. Oceania
- 5.7. Rest of Asia Pacific
Gravity Sensor Regional Market Share
Geographic Coverage of Gravity Sensor
Gravity Sensor REPORT HIGHLIGHTS
| Aspects | Details |
|---|---|
| Study Period | 2020-2034 |
| Base Year | 2025 |
| Estimated Year | 2026 |
| Forecast Period | 2026-2034 |
| Historical Period | 2020-2025 |
| Growth Rate | CAGR of 13.2% from 2020-2034 |
| Segmentation |
|
Table of Contents
- 1. Introduction
- 1.1. Research Scope
- 1.2. Market Segmentation
- 1.3. Research Methodology
- 1.4. Definitions and Assumptions
- 2. Executive Summary
- 2.1. Introduction
- 3. Market Dynamics
- 3.1. Introduction
- 3.2. Market Drivers
- 3.3. Market Restrains
- 3.4. Market Trends
- 4. Market Factor Analysis
- 4.1. Porters Five Forces
- 4.2. Supply/Value Chain
- 4.3. PESTEL analysis
- 4.4. Market Entropy
- 4.5. Patent/Trademark Analysis
- 5. Global Gravity Sensor Analysis, Insights and Forecast, 2020-2032
- 5.1. Market Analysis, Insights and Forecast - by Application
- 5.1.1. Smartphone and Tablets
- 5.1.2. Automotive
- 5.1.3. Others
- 5.2. Market Analysis, Insights and Forecast - by Types
- 5.2.1. Normal Sensor
- 5.2.2. High Precision Sensor
- 5.3. Market Analysis, Insights and Forecast - by Region
- 5.3.1. North America
- 5.3.2. South America
- 5.3.3. Europe
- 5.3.4. Middle East & Africa
- 5.3.5. Asia Pacific
- 5.1. Market Analysis, Insights and Forecast - by Application
- 6. North America Gravity Sensor Analysis, Insights and Forecast, 2020-2032
- 6.1. Market Analysis, Insights and Forecast - by Application
- 6.1.1. Smartphone and Tablets
- 6.1.2. Automotive
- 6.1.3. Others
- 6.2. Market Analysis, Insights and Forecast - by Types
- 6.2.1. Normal Sensor
- 6.2.2. High Precision Sensor
- 6.1. Market Analysis, Insights and Forecast - by Application
- 7. South America Gravity Sensor Analysis, Insights and Forecast, 2020-2032
- 7.1. Market Analysis, Insights and Forecast - by Application
- 7.1.1. Smartphone and Tablets
- 7.1.2. Automotive
- 7.1.3. Others
- 7.2. Market Analysis, Insights and Forecast - by Types
- 7.2.1. Normal Sensor
- 7.2.2. High Precision Sensor
- 7.1. Market Analysis, Insights and Forecast - by Application
- 8. Europe Gravity Sensor Analysis, Insights and Forecast, 2020-2032
- 8.1. Market Analysis, Insights and Forecast - by Application
- 8.1.1. Smartphone and Tablets
- 8.1.2. Automotive
- 8.1.3. Others
- 8.2. Market Analysis, Insights and Forecast - by Types
- 8.2.1. Normal Sensor
- 8.2.2. High Precision Sensor
- 8.1. Market Analysis, Insights and Forecast - by Application
- 9. Middle East & Africa Gravity Sensor Analysis, Insights and Forecast, 2020-2032
- 9.1. Market Analysis, Insights and Forecast - by Application
- 9.1.1. Smartphone and Tablets
- 9.1.2. Automotive
- 9.1.3. Others
- 9.2. Market Analysis, Insights and Forecast - by Types
- 9.2.1. Normal Sensor
- 9.2.2. High Precision Sensor
- 9.1. Market Analysis, Insights and Forecast - by Application
- 10. Asia Pacific Gravity Sensor Analysis, Insights and Forecast, 2020-2032
- 10.1. Market Analysis, Insights and Forecast - by Application
- 10.1.1. Smartphone and Tablets
- 10.1.2. Automotive
- 10.1.3. Others
- 10.2. Market Analysis, Insights and Forecast - by Types
- 10.2.1. Normal Sensor
- 10.2.2. High Precision Sensor
- 10.1. Market Analysis, Insights and Forecast - by Application
- 11. Competitive Analysis
- 11.1. Global Market Share Analysis 2025
- 11.2. Company Profiles
- 11.2.1 Philips
- 11.2.1.1. Overview
- 11.2.1.2. Products
- 11.2.1.3. SWOT Analysis
- 11.2.1.4. Recent Developments
- 11.2.1.5. Financials (Based on Availability)
- 11.2.2 DFRobot
- 11.2.2.1. Overview
- 11.2.2.2. Products
- 11.2.2.3. SWOT Analysis
- 11.2.2.4. Recent Developments
- 11.2.2.5. Financials (Based on Availability)
- 11.2.3 Bosch
- 11.2.3.1. Overview
- 11.2.3.2. Products
- 11.2.3.3. SWOT Analysis
- 11.2.3.4. Recent Developments
- 11.2.3.5. Financials (Based on Availability)
- 11.2.4 Hewlett Packard Enterprise (HPE)
- 11.2.4.1. Overview
- 11.2.4.2. Products
- 11.2.4.3. SWOT Analysis
- 11.2.4.4. Recent Developments
- 11.2.4.5. Financials (Based on Availability)
- 11.2.5 Shenzhen Ligent Sensor
- 11.2.5.1. Overview
- 11.2.5.2. Products
- 11.2.5.3. SWOT Analysis
- 11.2.5.4. Recent Developments
- 11.2.5.5. Financials (Based on Availability)
- 11.2.6 Knowles Electroincs
- 11.2.6.1. Overview
- 11.2.6.2. Products
- 11.2.6.3. SWOT Analysis
- 11.2.6.4. Recent Developments
- 11.2.6.5. Financials (Based on Availability)
- 11.2.7 Denso
- 11.2.7.1. Overview
- 11.2.7.2. Products
- 11.2.7.3. SWOT Analysis
- 11.2.7.4. Recent Developments
- 11.2.7.5. Financials (Based on Availability)
- 11.2.8 MURATA
- 11.2.8.1. Overview
- 11.2.8.2. Products
- 11.2.8.3. SWOT Analysis
- 11.2.8.4. Recent Developments
- 11.2.8.5. Financials (Based on Availability)
- 11.2.9 ROHM
- 11.2.9.1. Overview
- 11.2.9.2. Products
- 11.2.9.3. SWOT Analysis
- 11.2.9.4. Recent Developments
- 11.2.9.5. Financials (Based on Availability)
- 11.2.1 Philips
List of Figures
- Figure 1: Global Gravity Sensor Revenue Breakdown (million, %) by Region 2025 & 2033
- Figure 2: Global Gravity Sensor Volume Breakdown (K, %) by Region 2025 & 2033
- Figure 3: North America Gravity Sensor Revenue (million), by Application 2025 & 2033
- Figure 4: North America Gravity Sensor Volume (K), by Application 2025 & 2033
- Figure 5: North America Gravity Sensor Revenue Share (%), by Application 2025 & 2033
- Figure 6: North America Gravity Sensor Volume Share (%), by Application 2025 & 2033
- Figure 7: North America Gravity Sensor Revenue (million), by Types 2025 & 2033
- Figure 8: North America Gravity Sensor Volume (K), by Types 2025 & 2033
- Figure 9: North America Gravity Sensor Revenue Share (%), by Types 2025 & 2033
- Figure 10: North America Gravity Sensor Volume Share (%), by Types 2025 & 2033
- Figure 11: North America Gravity Sensor Revenue (million), by Country 2025 & 2033
- Figure 12: North America Gravity Sensor Volume (K), by Country 2025 & 2033
- Figure 13: North America Gravity Sensor Revenue Share (%), by Country 2025 & 2033
- Figure 14: North America Gravity Sensor Volume Share (%), by Country 2025 & 2033
- Figure 15: South America Gravity Sensor Revenue (million), by Application 2025 & 2033
- Figure 16: South America Gravity Sensor Volume (K), by Application 2025 & 2033
- Figure 17: South America Gravity Sensor Revenue Share (%), by Application 2025 & 2033
- Figure 18: South America Gravity Sensor Volume Share (%), by Application 2025 & 2033
- Figure 19: South America Gravity Sensor Revenue (million), by Types 2025 & 2033
- Figure 20: South America Gravity Sensor Volume (K), by Types 2025 & 2033
- Figure 21: South America Gravity Sensor Revenue Share (%), by Types 2025 & 2033
- Figure 22: South America Gravity Sensor Volume Share (%), by Types 2025 & 2033
- Figure 23: South America Gravity Sensor Revenue (million), by Country 2025 & 2033
- Figure 24: South America Gravity Sensor Volume (K), by Country 2025 & 2033
- Figure 25: South America Gravity Sensor Revenue Share (%), by Country 2025 & 2033
- Figure 26: South America Gravity Sensor Volume Share (%), by Country 2025 & 2033
- Figure 27: Europe Gravity Sensor Revenue (million), by Application 2025 & 2033
- Figure 28: Europe Gravity Sensor Volume (K), by Application 2025 & 2033
- Figure 29: Europe Gravity Sensor Revenue Share (%), by Application 2025 & 2033
- Figure 30: Europe Gravity Sensor Volume Share (%), by Application 2025 & 2033
- Figure 31: Europe Gravity Sensor Revenue (million), by Types 2025 & 2033
- Figure 32: Europe Gravity Sensor Volume (K), by Types 2025 & 2033
- Figure 33: Europe Gravity Sensor Revenue Share (%), by Types 2025 & 2033
- Figure 34: Europe Gravity Sensor Volume Share (%), by Types 2025 & 2033
- Figure 35: Europe Gravity Sensor Revenue (million), by Country 2025 & 2033
- Figure 36: Europe Gravity Sensor Volume (K), by Country 2025 & 2033
- Figure 37: Europe Gravity Sensor Revenue Share (%), by Country 2025 & 2033
- Figure 38: Europe Gravity Sensor Volume Share (%), by Country 2025 & 2033
- Figure 39: Middle East & Africa Gravity Sensor Revenue (million), by Application 2025 & 2033
- Figure 40: Middle East & Africa Gravity Sensor Volume (K), by Application 2025 & 2033
- Figure 41: Middle East & Africa Gravity Sensor Revenue Share (%), by Application 2025 & 2033
- Figure 42: Middle East & Africa Gravity Sensor Volume Share (%), by Application 2025 & 2033
- Figure 43: Middle East & Africa Gravity Sensor Revenue (million), by Types 2025 & 2033
- Figure 44: Middle East & Africa Gravity Sensor Volume (K), by Types 2025 & 2033
- Figure 45: Middle East & Africa Gravity Sensor Revenue Share (%), by Types 2025 & 2033
- Figure 46: Middle East & Africa Gravity Sensor Volume Share (%), by Types 2025 & 2033
- Figure 47: Middle East & Africa Gravity Sensor Revenue (million), by Country 2025 & 2033
- Figure 48: Middle East & Africa Gravity Sensor Volume (K), by Country 2025 & 2033
- Figure 49: Middle East & Africa Gravity Sensor Revenue Share (%), by Country 2025 & 2033
- Figure 50: Middle East & Africa Gravity Sensor Volume Share (%), by Country 2025 & 2033
- Figure 51: Asia Pacific Gravity Sensor Revenue (million), by Application 2025 & 2033
- Figure 52: Asia Pacific Gravity Sensor Volume (K), by Application 2025 & 2033
- Figure 53: Asia Pacific Gravity Sensor Revenue Share (%), by Application 2025 & 2033
- Figure 54: Asia Pacific Gravity Sensor Volume Share (%), by Application 2025 & 2033
- Figure 55: Asia Pacific Gravity Sensor Revenue (million), by Types 2025 & 2033
- Figure 56: Asia Pacific Gravity Sensor Volume (K), by Types 2025 & 2033
- Figure 57: Asia Pacific Gravity Sensor Revenue Share (%), by Types 2025 & 2033
- Figure 58: Asia Pacific Gravity Sensor Volume Share (%), by Types 2025 & 2033
- Figure 59: Asia Pacific Gravity Sensor Revenue (million), by Country 2025 & 2033
- Figure 60: Asia Pacific Gravity Sensor Volume (K), by Country 2025 & 2033
- Figure 61: Asia Pacific Gravity Sensor Revenue Share (%), by Country 2025 & 2033
- Figure 62: Asia Pacific Gravity Sensor Volume Share (%), by Country 2025 & 2033
List of Tables
- Table 1: Global Gravity Sensor Revenue million Forecast, by Application 2020 & 2033
- Table 2: Global Gravity Sensor Volume K Forecast, by Application 2020 & 2033
- Table 3: Global Gravity Sensor Revenue million Forecast, by Types 2020 & 2033
- Table 4: Global Gravity Sensor Volume K Forecast, by Types 2020 & 2033
- Table 5: Global Gravity Sensor Revenue million Forecast, by Region 2020 & 2033
- Table 6: Global Gravity Sensor Volume K Forecast, by Region 2020 & 2033
- Table 7: Global Gravity Sensor Revenue million Forecast, by Application 2020 & 2033
- Table 8: Global Gravity Sensor Volume K Forecast, by Application 2020 & 2033
- Table 9: Global Gravity Sensor Revenue million Forecast, by Types 2020 & 2033
- Table 10: Global Gravity Sensor Volume K Forecast, by Types 2020 & 2033
- Table 11: Global Gravity Sensor Revenue million Forecast, by Country 2020 & 2033
- Table 12: Global Gravity Sensor Volume K Forecast, by Country 2020 & 2033
- Table 13: United States Gravity Sensor Revenue (million) Forecast, by Application 2020 & 2033
- Table 14: United States Gravity Sensor Volume (K) Forecast, by Application 2020 & 2033
- Table 15: Canada Gravity Sensor Revenue (million) Forecast, by Application 2020 & 2033
- Table 16: Canada Gravity Sensor Volume (K) Forecast, by Application 2020 & 2033
- Table 17: Mexico Gravity Sensor Revenue (million) Forecast, by Application 2020 & 2033
- Table 18: Mexico Gravity Sensor Volume (K) Forecast, by Application 2020 & 2033
- Table 19: Global Gravity Sensor Revenue million Forecast, by Application 2020 & 2033
- Table 20: Global Gravity Sensor Volume K Forecast, by Application 2020 & 2033
- Table 21: Global Gravity Sensor Revenue million Forecast, by Types 2020 & 2033
- Table 22: Global Gravity Sensor Volume K Forecast, by Types 2020 & 2033
- Table 23: Global Gravity Sensor Revenue million Forecast, by Country 2020 & 2033
- Table 24: Global Gravity Sensor Volume K Forecast, by Country 2020 & 2033
- Table 25: Brazil Gravity Sensor Revenue (million) Forecast, by Application 2020 & 2033
- Table 26: Brazil Gravity Sensor Volume (K) Forecast, by Application 2020 & 2033
- Table 27: Argentina Gravity Sensor Revenue (million) Forecast, by Application 2020 & 2033
- Table 28: Argentina Gravity Sensor Volume (K) Forecast, by Application 2020 & 2033
- Table 29: Rest of South America Gravity Sensor Revenue (million) Forecast, by Application 2020 & 2033
- Table 30: Rest of South America Gravity Sensor Volume (K) Forecast, by Application 2020 & 2033
- Table 31: Global Gravity Sensor Revenue million Forecast, by Application 2020 & 2033
- Table 32: Global Gravity Sensor Volume K Forecast, by Application 2020 & 2033
- Table 33: Global Gravity Sensor Revenue million Forecast, by Types 2020 & 2033
- Table 34: Global Gravity Sensor Volume K Forecast, by Types 2020 & 2033
- Table 35: Global Gravity Sensor Revenue million Forecast, by Country 2020 & 2033
- Table 36: Global Gravity Sensor Volume K Forecast, by Country 2020 & 2033
- Table 37: United Kingdom Gravity Sensor Revenue (million) Forecast, by Application 2020 & 2033
- Table 38: United Kingdom Gravity Sensor Volume (K) Forecast, by Application 2020 & 2033
- Table 39: Germany Gravity Sensor Revenue (million) Forecast, by Application 2020 & 2033
- Table 40: Germany Gravity Sensor Volume (K) Forecast, by Application 2020 & 2033
- Table 41: France Gravity Sensor Revenue (million) Forecast, by Application 2020 & 2033
- Table 42: France Gravity Sensor Volume (K) Forecast, by Application 2020 & 2033
- Table 43: Italy Gravity Sensor Revenue (million) Forecast, by Application 2020 & 2033
- Table 44: Italy Gravity Sensor Volume (K) Forecast, by Application 2020 & 2033
- Table 45: Spain Gravity Sensor Revenue (million) Forecast, by Application 2020 & 2033
- Table 46: Spain Gravity Sensor Volume (K) Forecast, by Application 2020 & 2033
- Table 47: Russia Gravity Sensor Revenue (million) Forecast, by Application 2020 & 2033
- Table 48: Russia Gravity Sensor Volume (K) Forecast, by Application 2020 & 2033
- Table 49: Benelux Gravity Sensor Revenue (million) Forecast, by Application 2020 & 2033
- Table 50: Benelux Gravity Sensor Volume (K) Forecast, by Application 2020 & 2033
- Table 51: Nordics Gravity Sensor Revenue (million) Forecast, by Application 2020 & 2033
- Table 52: Nordics Gravity Sensor Volume (K) Forecast, by Application 2020 & 2033
- Table 53: Rest of Europe Gravity Sensor Revenue (million) Forecast, by Application 2020 & 2033
- Table 54: Rest of Europe Gravity Sensor Volume (K) Forecast, by Application 2020 & 2033
- Table 55: Global Gravity Sensor Revenue million Forecast, by Application 2020 & 2033
- Table 56: Global Gravity Sensor Volume K Forecast, by Application 2020 & 2033
- Table 57: Global Gravity Sensor Revenue million Forecast, by Types 2020 & 2033
- Table 58: Global Gravity Sensor Volume K Forecast, by Types 2020 & 2033
- Table 59: Global Gravity Sensor Revenue million Forecast, by Country 2020 & 2033
- Table 60: Global Gravity Sensor Volume K Forecast, by Country 2020 & 2033
- Table 61: Turkey Gravity Sensor Revenue (million) Forecast, by Application 2020 & 2033
- Table 62: Turkey Gravity Sensor Volume (K) Forecast, by Application 2020 & 2033
- Table 63: Israel Gravity Sensor Revenue (million) Forecast, by Application 2020 & 2033
- Table 64: Israel Gravity Sensor Volume (K) Forecast, by Application 2020 & 2033
- Table 65: GCC Gravity Sensor Revenue (million) Forecast, by Application 2020 & 2033
- Table 66: GCC Gravity Sensor Volume (K) Forecast, by Application 2020 & 2033
- Table 67: North Africa Gravity Sensor Revenue (million) Forecast, by Application 2020 & 2033
- Table 68: North Africa Gravity Sensor Volume (K) Forecast, by Application 2020 & 2033
- Table 69: South Africa Gravity Sensor Revenue (million) Forecast, by Application 2020 & 2033
- Table 70: South Africa Gravity Sensor Volume (K) Forecast, by Application 2020 & 2033
- Table 71: Rest of Middle East & Africa Gravity Sensor Revenue (million) Forecast, by Application 2020 & 2033
- Table 72: Rest of Middle East & Africa Gravity Sensor Volume (K) Forecast, by Application 2020 & 2033
- Table 73: Global Gravity Sensor Revenue million Forecast, by Application 2020 & 2033
- Table 74: Global Gravity Sensor Volume K Forecast, by Application 2020 & 2033
- Table 75: Global Gravity Sensor Revenue million Forecast, by Types 2020 & 2033
- Table 76: Global Gravity Sensor Volume K Forecast, by Types 2020 & 2033
- Table 77: Global Gravity Sensor Revenue million Forecast, by Country 2020 & 2033
- Table 78: Global Gravity Sensor Volume K Forecast, by Country 2020 & 2033
- Table 79: China Gravity Sensor Revenue (million) Forecast, by Application 2020 & 2033
- Table 80: China Gravity Sensor Volume (K) Forecast, by Application 2020 & 2033
- Table 81: India Gravity Sensor Revenue (million) Forecast, by Application 2020 & 2033
- Table 82: India Gravity Sensor Volume (K) Forecast, by Application 2020 & 2033
- Table 83: Japan Gravity Sensor Revenue (million) Forecast, by Application 2020 & 2033
- Table 84: Japan Gravity Sensor Volume (K) Forecast, by Application 2020 & 2033
- Table 85: South Korea Gravity Sensor Revenue (million) Forecast, by Application 2020 & 2033
- Table 86: South Korea Gravity Sensor Volume (K) Forecast, by Application 2020 & 2033
- Table 87: ASEAN Gravity Sensor Revenue (million) Forecast, by Application 2020 & 2033
- Table 88: ASEAN Gravity Sensor Volume (K) Forecast, by Application 2020 & 2033
- Table 89: Oceania Gravity Sensor Revenue (million) Forecast, by Application 2020 & 2033
- Table 90: Oceania Gravity Sensor Volume (K) Forecast, by Application 2020 & 2033
- Table 91: Rest of Asia Pacific Gravity Sensor Revenue (million) Forecast, by Application 2020 & 2033
- Table 92: Rest of Asia Pacific Gravity Sensor Volume (K) Forecast, by Application 2020 & 2033
Frequently Asked Questions
1. What is the projected Compound Annual Growth Rate (CAGR) of the Gravity Sensor?
The projected CAGR is approximately 13.2%.
2. Which companies are prominent players in the Gravity Sensor?
Key companies in the market include Philips, DFRobot, Bosch, Hewlett Packard Enterprise (HPE), Shenzhen Ligent Sensor, Knowles Electroincs, Denso, MURATA, ROHM.
3. What are the main segments of the Gravity Sensor?
The market segments include Application, Types.
4. Can you provide details about the market size?
The market size is estimated to be USD 120.9 million as of 2022.
5. What are some drivers contributing to market growth?
N/A
6. What are the notable trends driving market growth?
N/A
7. Are there any restraints impacting market growth?
N/A
8. Can you provide examples of recent developments in the market?
N/A
9. What pricing options are available for accessing the report?
Pricing options include single-user, multi-user, and enterprise licenses priced at USD 3350.00, USD 5025.00, and USD 6700.00 respectively.
10. Is the market size provided in terms of value or volume?
The market size is provided in terms of value, measured in million and volume, measured in K.
11. Are there any specific market keywords associated with the report?
Yes, the market keyword associated with the report is "Gravity Sensor," which aids in identifying and referencing the specific market segment covered.
12. How do I determine which pricing option suits my needs best?
The pricing options vary based on user requirements and access needs. Individual users may opt for single-user licenses, while businesses requiring broader access may choose multi-user or enterprise licenses for cost-effective access to the report.
13. Are there any additional resources or data provided in the Gravity Sensor report?
While the report offers comprehensive insights, it's advisable to review the specific contents or supplementary materials provided to ascertain if additional resources or data are available.
14. How can I stay updated on further developments or reports in the Gravity Sensor?
To stay informed about further developments, trends, and reports in the Gravity Sensor, consider subscribing to industry newsletters, following relevant companies and organizations, or regularly checking reputable industry news sources and publications.
Methodology
Step 1 - Identification of Relevant Samples Size from Population Database


Step 2 - Approaches for Defining Global Market Size (Value, Volume* & Price*)

Note*: In applicable scenarios
Step 3 - Data Sources
Primary Research
- Web Analytics
- Survey Reports
- Research Institute
- Latest Research Reports
- Opinion Leaders
Secondary Research
- Annual Reports
- White Paper
- Latest Press Release
- Industry Association
- Paid Database
- Investor Presentations

Step 4 - Data Triangulation
Involves using different sources of information in order to increase the validity of a study
These sources are likely to be stakeholders in a program - participants, other researchers, program staff, other community members, and so on.
Then we put all data in single framework & apply various statistical tools to find out the dynamic on the market.
During the analysis stage, feedback from the stakeholder groups would be compared to determine areas of agreement as well as areas of divergence