Unlocking Insights for Green Hydrogen Market Growth Strategies

Green Hydrogen Market by End-user Industry (Refining, Chemicals, Iron and Steel, Transportation, Power and Other End-user Industries), by Asia Pacific (China, India, Japan, South Korea, Rest of Asia Pacific), by North America (United States, Canada, Mexico), by Europe (Germany, United Kingdom, France, Italy, Rest of Europe), by Rest of the World (South America, Middle East and Africa) Forecast 2025-2033

Aug 29 2025
Base Year: 2024

180 Pages
Main Logo

Unlocking Insights for Green Hydrogen Market Growth Strategies


Home
Industries
Chemicals & Materials
sponsor image
sponsor image
sponsor image
sponsor image

Tailored for you

  • In-depth Analysis Tailored to Specified Regions or Segments
  • Company Profiles Customized to User Preferences
  • Comprehensive Insights Focused on Specific Segments or Regions
  • Customized Evaluation of Competitive Landscape to Meet Your Needs
  • Tailored Customization to Address Other Specific Requirements
Ask for customization


Key Insights

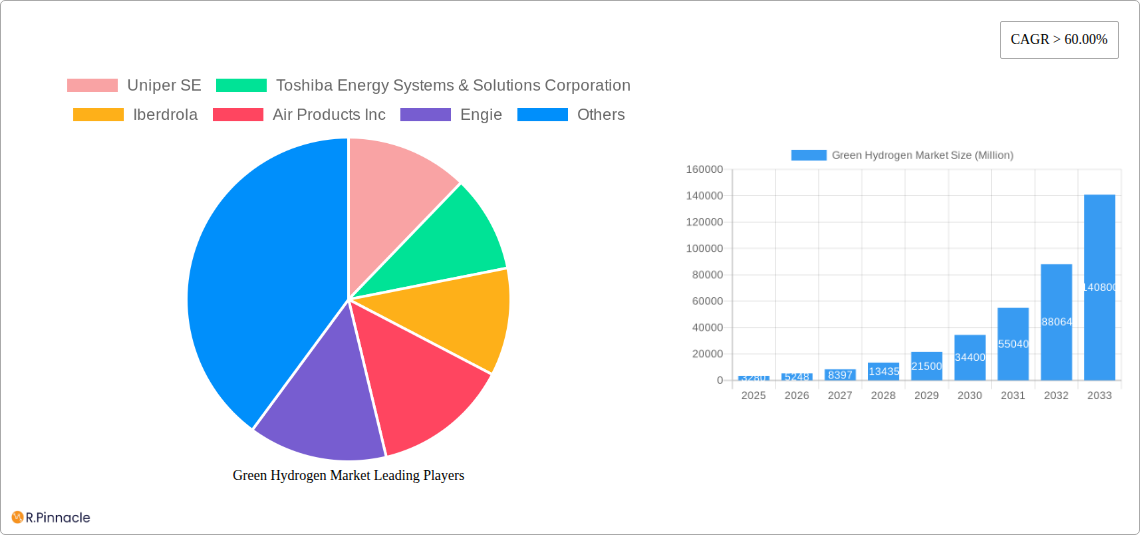
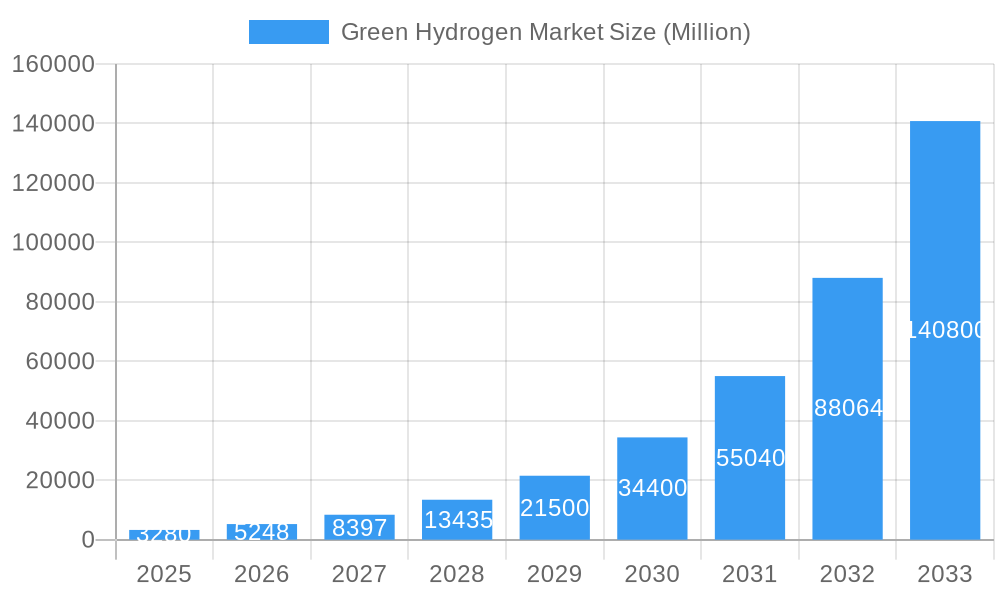
The green hydrogen market is experiencing explosive growth, projected to reach a market size of $3.28 billion in 2025 and exhibiting a Compound Annual Growth Rate (CAGR) exceeding 60%. This remarkable expansion is driven by several key factors. Increasing global concerns about climate change and the urgent need to decarbonize energy-intensive industries are fueling significant investment in green hydrogen production technologies. Government policies promoting renewable energy sources and incentives for green hydrogen adoption are further accelerating market growth. The rising demand for clean energy across various end-user industries, including refining, chemicals, iron and steel, and transportation, is creating a robust market for green hydrogen as a clean fuel and feedstock. Technological advancements leading to cost reductions in electrolyzer technology and improved energy efficiency are also contributing to the market's rapid expansion. Furthermore, the strategic partnerships and investments by major players like Uniper SE, Toshiba Energy Systems & Solutions Corporation, and Air Liquide demonstrate the strong industry confidence in the long-term prospects of the green hydrogen market.

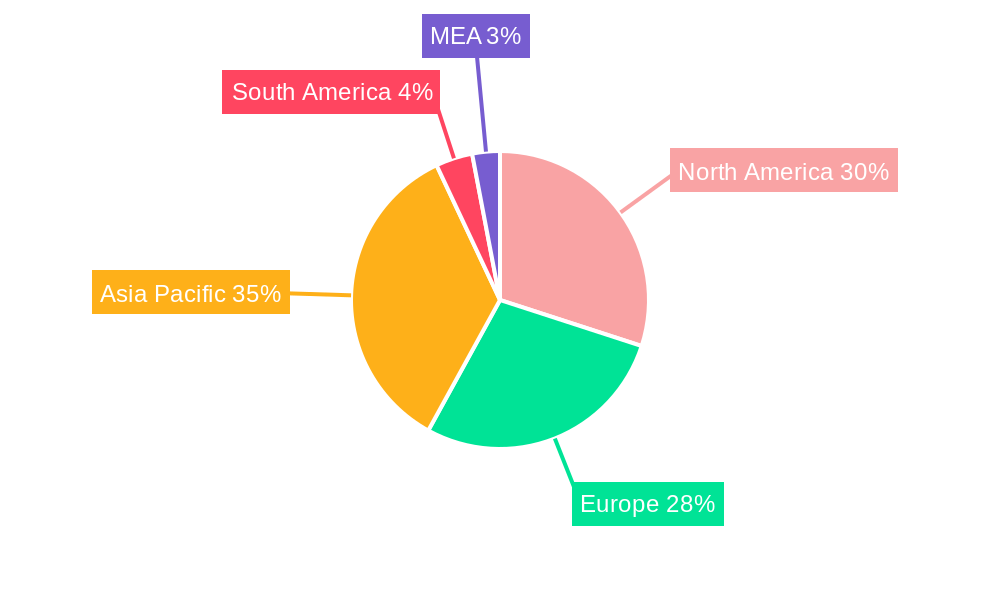
The geographic distribution of the green hydrogen market is diverse, with North America, Europe, and Asia Pacific emerging as key regional players. North America benefits from abundant renewable energy resources and supportive government policies. Europe is witnessing significant investments in green hydrogen infrastructure development, driven by the European Green Deal. Asia Pacific, particularly China and Japan, are making substantial strides in green hydrogen technology and deployment. The market is segmented by end-user industries, reflecting the diverse applications of green hydrogen. The refining, chemicals, and iron and steel sectors are major consumers, utilizing green hydrogen for process heat and feedstock. The transportation sector is also a significant growth area, with green hydrogen increasingly considered as a fuel for heavy-duty vehicles. While challenges such as high production costs and limited infrastructure remain, the substantial market drivers and ongoing technological advancements suggest that the green hydrogen market is poised for continued substantial growth throughout the forecast period (2025-2033).

Green Hydrogen Market Research Report - Market Size, Growth & Forecast

Green Hydrogen Market: A Comprehensive Report (2019-2033)

This in-depth report provides a comprehensive analysis of the Green Hydrogen Market, encompassing market structure, dynamics, regional performance, key players, and future outlook. The study period covers 2019-2033, with 2025 serving as the base and estimated year. This report is essential for industry professionals, investors, and strategists seeking to understand and capitalize on the burgeoning green hydrogen sector. The market is projected to reach xx Million by 2033, exhibiting a CAGR of xx% during the forecast period (2025-2033).

Green Hydrogen Market Structure & Innovation Trends

The Green Hydrogen market is characterized by a moderately concentrated landscape with several major players vying for market share. Key players include Uniper SE, Toshiba Energy Systems & Solutions Corporation, Iberdrola, Air Products Inc, Engie, Yara International, Lhyfe, Linde plc, Cummins Inc, Siemens Energy, Air Liquide, Nel ASA, and Bloom Energy. However, the market also features several smaller, innovative companies.

  • Market Concentration: The top 5 players hold an estimated xx% market share in 2025, indicating a moderately concentrated market.
  • Innovation Drivers: Government incentives, technological advancements in electrolyzer technology, and growing demand from decarbonization efforts are major drivers of innovation.
  • Regulatory Frameworks: Government policies and regulations regarding renewable energy targets and carbon emission reduction play a vital role in shaping the market.
  • Product Substitutes: Grey and blue hydrogen currently serve as substitutes, although green hydrogen is increasingly favored due to its environmental benefits.
  • End-User Demographics: The primary end-users include the refining, chemicals, iron and steel, and transportation sectors.
  • M&A Activities: The market has witnessed significant M&A activity in recent years, with deal values exceeding xx Million in the period 2019-2024. These activities highlight the strategic importance of the sector and the drive for consolidation.
Green Hydrogen Market Growth

Green Hydrogen Market Dynamics & Trends

The Green Hydrogen market is experiencing rapid growth, driven by several factors. The increasing urgency to reduce carbon emissions, coupled with advancements in electrolyzer technology, has fueled substantial investments in green hydrogen production and infrastructure. Consumer preference is shifting towards cleaner energy solutions, further bolstering market growth. Competition is intensifying as both established players and new entrants seek to capitalize on market opportunities.

The market is projected to witness technological disruptions, particularly in electrolyzer efficiency and cost reduction, which will further accelerate market expansion. Consumer preferences are aligning with sustainability goals, leading to increased demand for green hydrogen across various sectors. Competitive dynamics are characterized by ongoing innovation, strategic partnerships, and mergers and acquisitions. The market penetration of green hydrogen is increasing steadily, with projections showing significant growth in the coming years.

Green Hydrogen Market Growth

Dominant Regions & Segments in Green Hydrogen Market

While the Green Hydrogen market is globally distributed, certain regions and segments exhibit stronger growth trajectories. Europe and North America are currently leading in terms of deployment and investment, benefiting from supportive government policies and advanced technological infrastructure.

  • Europe: Strong regulatory support, substantial investments, and a well-established renewable energy infrastructure are driving market leadership.
  • North America: Growing demand from heavy industries and a push for decarbonization are key growth drivers.
  • Asia-Pacific: This region exhibits high growth potential, driven by increasing energy demands and government initiatives.

Dominant End-User Segments:

  • Refining: The sector is adopting green hydrogen for refinery processes, reducing carbon emissions.
  • Chemicals: Green hydrogen plays a pivotal role in chemical production, offering a cleaner alternative to traditional methods.
  • Iron and Steel: Green hydrogen is emerging as a crucial decarbonization solution for the iron and steel industry.
  • Transportation: The transportation sector is gradually integrating green hydrogen into its fuel mix, promoting sustainable transportation solutions.
  • Other End-User Industries: Other sectors, such as power generation and building heating, are showing growing interest in green hydrogen as a clean energy source.

Green Hydrogen Market Product Innovations

Recent innovations center around improving electrolyzer efficiency, lowering production costs, and developing more sustainable and scalable production methods. Advancements in alkaline, proton exchange membrane (PEM), and solid oxide electrolyzer technologies are driving market growth. These innovations are improving market fit by making green hydrogen increasingly competitive with traditional energy sources.

Report Scope & Segmentation Analysis

This report comprehensively segments the Green Hydrogen Market based on end-user applications: Refining, Chemicals, Iron and Steel, Transportation, and Other End-user Industries. Each segment's growth projections, market sizes, and competitive dynamics are analyzed in detail. For example, the Refining segment is expected to demonstrate robust growth owing to its integration into the refinery processes while the Transportation sector shows gradual penetration, driven by advancements in fuel cell technology. Market sizes and growth projections are detailed within the full report for each segment.

Key Drivers of Green Hydrogen Market Growth

Several factors are propelling the growth of the Green Hydrogen market:

  • Stringent Environmental Regulations: Governments worldwide are implementing stricter regulations to combat climate change, creating a favorable environment for green hydrogen adoption.
  • Technological Advancements: Continuous advancements in electrolyzer technology are reducing production costs and increasing efficiency.
  • Government Incentives and Subsidies: Significant financial support from governments is stimulating investments in green hydrogen projects.
  • Rising Energy Demand: The global energy demand is steadily increasing, driving the need for sustainable energy sources.

Challenges in the Green Hydrogen Market Sector

Despite its potential, the Green Hydrogen market faces certain challenges:

  • High Production Costs: The production cost of green hydrogen remains relatively high compared to fossil fuels.
  • Infrastructure Development: The lack of adequate infrastructure for storage, transportation, and distribution poses a significant challenge.
  • Intermittency of Renewable Energy Sources: The dependence on renewable energy sources introduces intermittency concerns in green hydrogen production.
  • Energy Storage and Transportation: Cost-effective and efficient solutions for storage and transportation remain crucial challenges.

Emerging Opportunities in Green Hydrogen Market

Several emerging opportunities are shaping the future of the Green Hydrogen market:

  • Hydrogen-based Power Generation: Green hydrogen is gaining traction as a clean energy source for power generation.
  • Fuel Cell Applications: Fuel cell technology is driving growth in transportation and other applications.
  • Industrial Decarbonization: Green hydrogen is offering viable solutions for decarbonizing various industrial sectors.
  • Green Ammonia Production: Green ammonia production leveraging green hydrogen is a developing sector.

Leading Players in the Green Hydrogen Market

  • Uniper SE
  • Toshiba Energy Systems & Solutions Corporation
  • Iberdrola
  • Air Products Inc
  • Engie
  • Yara International
  • Lhyfe
  • Linde plc
  • Cummins Inc
  • Siemens Energy
  • Air Liquide
  • Nel ASA
  • Bloom Energy

Key Developments in Green Hydrogen Market Industry

  • September 2022: ENGIE announced its final investment decision for an industrial-scale renewable hydrogen project in Western Australia's Pilbara region, marking a significant milestone in developing a Pilbara Green Hydrogen Hub.
  • September 2022: Siemens commissioned one of Germany's largest green hydrogen generation plants, highlighting the country's commitment to green energy.
  • June 2022: Siemens Energy and Air Liquide formed a joint venture to produce industrial-scale renewable hydrogen electrolyzers in Europe, boosting electrolyzer production capacity.
  • January 2023: Nel and Statkraft partnered to deliver 40 MW electrolyzers for green hydrogen production in Norway, strengthening the Norwegian green hydrogen value chain.

Future Outlook for Green Hydrogen Market

The Green Hydrogen market is poised for significant growth, driven by supportive government policies, technological advancements, and increasing demand for cleaner energy solutions. The market is projected to experience robust growth in the coming years, presenting attractive investment opportunities and strategic advantages for players across the value chain. Focus on cost reduction, technological innovation, and strategic partnerships will be key to success.

Green Hydrogen Market Segmentation

  • 1. End-user Industry
    • 1.1. Refining
    • 1.2. Chemicals
    • 1.3. Iron and Steel
    • 1.4. Transportation
    • 1.5. Power and Other End-user Industries

Green Hydrogen Market Segmentation By Geography

  • 1. Asia Pacific
    • 1.1. China
    • 1.2. India
    • 1.3. Japan
    • 1.4. South Korea
    • 1.5. Rest of Asia Pacific
  • 2. North America
    • 2.1. United States
    • 2.2. Canada
    • 2.3. Mexico
  • 3. Europe
    • 3.1. Germany
    • 3.2. United Kingdom
    • 3.3. France
    • 3.4. Italy
    • 3.5. Rest of Europe
  • 4. Rest of the World
    • 4.1. South America
    • 4.2. Middle East and Africa
Green Hydrogen Market Regional Share


Green Hydrogen Market REPORT HIGHLIGHTS

AspectsDetails
Study Period 2019-2033
Base Year 2024
Estimated Year 2025
Forecast Period2025-2033
Historical Period2019-2024
Growth RateCAGR of > 60.00% from 2019-2033
Segmentation
    • By End-user Industry
      • Refining
      • Chemicals
      • Iron and Steel
      • Transportation
      • Power and Other End-user Industries
  • By Geography
    • Asia Pacific
      • China
      • India
      • Japan
      • South Korea
      • Rest of Asia Pacific
    • North America
      • United States
      • Canada
      • Mexico
    • Europe
      • Germany
      • United Kingdom
      • France
      • Italy
      • Rest of Europe
    • Rest of the World
      • South America
      • Middle East and Africa


Table of Contents

  1. 1. Introduction
    • 1.1. Research Scope
    • 1.2. Market Segmentation
    • 1.3. Research Methodology
    • 1.4. Definitions and Assumptions
  2. 2. Executive Summary
    • 2.1. Introduction
  3. 3. Market Dynamics
    • 3.1. Introduction
      • 3.2. Market Drivers
        • 3.2.1. Surging Demand in the Chemical Industry; Growing Environmental Concerns Regarding Carbon Emissions
      • 3.3. Market Restrains
        • 3.3.1. High Cost of Green Hydrogen; Other Market Restraints
      • 3.4. Market Trends
        • 3.4.1. Surging Demand in the Chemical Industry
  4. 4. Market Factor Analysis
    • 4.1. Porters Five Forces
    • 4.2. Supply/Value Chain
    • 4.3. PESTEL analysis
    • 4.4. Market Entropy
    • 4.5. Patent/Trademark Analysis
  5. 5. Global Green Hydrogen Market Analysis, Insights and Forecast, 2019-2031
    • 5.1. Market Analysis, Insights and Forecast - by End-user Industry
      • 5.1.1. Refining
      • 5.1.2. Chemicals
      • 5.1.3. Iron and Steel
      • 5.1.4. Transportation
      • 5.1.5. Power and Other End-user Industries
    • 5.2. Market Analysis, Insights and Forecast - by Region
      • 5.2.1. Asia Pacific
      • 5.2.2. North America
      • 5.2.3. Europe
      • 5.2.4. Rest of the World
  6. 6. Asia Pacific Green Hydrogen Market Analysis, Insights and Forecast, 2019-2031
    • 6.1. Market Analysis, Insights and Forecast - by End-user Industry
      • 6.1.1. Refining
      • 6.1.2. Chemicals
      • 6.1.3. Iron and Steel
      • 6.1.4. Transportation
      • 6.1.5. Power and Other End-user Industries
  7. 7. North America Green Hydrogen Market Analysis, Insights and Forecast, 2019-2031
    • 7.1. Market Analysis, Insights and Forecast - by End-user Industry
      • 7.1.1. Refining
      • 7.1.2. Chemicals
      • 7.1.3. Iron and Steel
      • 7.1.4. Transportation
      • 7.1.5. Power and Other End-user Industries
  8. 8. Europe Green Hydrogen Market Analysis, Insights and Forecast, 2019-2031
    • 8.1. Market Analysis, Insights and Forecast - by End-user Industry
      • 8.1.1. Refining
      • 8.1.2. Chemicals
      • 8.1.3. Iron and Steel
      • 8.1.4. Transportation
      • 8.1.5. Power and Other End-user Industries
  9. 9. Rest of the World Green Hydrogen Market Analysis, Insights and Forecast, 2019-2031
    • 9.1. Market Analysis, Insights and Forecast - by End-user Industry
      • 9.1.1. Refining
      • 9.1.2. Chemicals
      • 9.1.3. Iron and Steel
      • 9.1.4. Transportation
      • 9.1.5. Power and Other End-user Industries
  10. 10. North America Green Hydrogen Market Analysis, Insights and Forecast, 2019-2031
      • 10.1. Market Analysis, Insights and Forecast - By Country/Sub-region
        • 10.1.1 United States
        • 10.1.2 Canada
        • 10.1.3 Mexico
  11. 11. Europe Green Hydrogen Market Analysis, Insights and Forecast, 2019-2031
      • 11.1. Market Analysis, Insights and Forecast - By Country/Sub-region
        • 11.1.1 Germany
        • 11.1.2 United Kingdom
        • 11.1.3 France
        • 11.1.4 Spain
        • 11.1.5 Italy
        • 11.1.6 Spain
        • 11.1.7 Belgium
        • 11.1.8 Netherland
        • 11.1.9 Nordics
        • 11.1.10 Rest of Europe
  12. 12. Asia Pacific Green Hydrogen Market Analysis, Insights and Forecast, 2019-2031
      • 12.1. Market Analysis, Insights and Forecast - By Country/Sub-region
        • 12.1.1 China
        • 12.1.2 Japan
        • 12.1.3 India
        • 12.1.4 South Korea
        • 12.1.5 Southeast Asia
        • 12.1.6 Australia
        • 12.1.7 Indonesia
        • 12.1.8 Phillipes
        • 12.1.9 Singapore
        • 12.1.10 Thailandc
        • 12.1.11 Rest of Asia Pacific
  13. 13. South America Green Hydrogen Market Analysis, Insights and Forecast, 2019-2031
      • 13.1. Market Analysis, Insights and Forecast - By Country/Sub-region
        • 13.1.1 Brazil
        • 13.1.2 Argentina
        • 13.1.3 Peru
        • 13.1.4 Chile
        • 13.1.5 Colombia
        • 13.1.6 Ecuador
        • 13.1.7 Venezuela
        • 13.1.8 Rest of South America
  14. 14. North America Green Hydrogen Market Analysis, Insights and Forecast, 2019-2031
      • 14.1. Market Analysis, Insights and Forecast - By Country/Sub-region
        • 14.1.1 United States
        • 14.1.2 Canada
        • 14.1.3 Mexico
  15. 15. MEA Green Hydrogen Market Analysis, Insights and Forecast, 2019-2031
      • 15.1. Market Analysis, Insights and Forecast - By Country/Sub-region
        • 15.1.1 United Arab Emirates
        • 15.1.2 Saudi Arabia
        • 15.1.3 South Africa
        • 15.1.4 Rest of Middle East and Africa
  16. 16. Competitive Analysis
    • 16.1. Global Market Share Analysis 2024
      • 16.2. Company Profiles
        • 16.2.1 Uniper SE
          • 16.2.1.1. Overview
          • 16.2.1.2. Products
          • 16.2.1.3. SWOT Analysis
          • 16.2.1.4. Recent Developments
          • 16.2.1.5. Financials (Based on Availability)
        • 16.2.2 Toshiba Energy Systems & Solutions Corporation
          • 16.2.2.1. Overview
          • 16.2.2.2. Products
          • 16.2.2.3. SWOT Analysis
          • 16.2.2.4. Recent Developments
          • 16.2.2.5. Financials (Based on Availability)
        • 16.2.3 Iberdrola
          • 16.2.3.1. Overview
          • 16.2.3.2. Products
          • 16.2.3.3. SWOT Analysis
          • 16.2.3.4. Recent Developments
          • 16.2.3.5. Financials (Based on Availability)
        • 16.2.4 Air Products Inc
          • 16.2.4.1. Overview
          • 16.2.4.2. Products
          • 16.2.4.3. SWOT Analysis
          • 16.2.4.4. Recent Developments
          • 16.2.4.5. Financials (Based on Availability)
        • 16.2.5 Engie
          • 16.2.5.1. Overview
          • 16.2.5.2. Products
          • 16.2.5.3. SWOT Analysis
          • 16.2.5.4. Recent Developments
          • 16.2.5.5. Financials (Based on Availability)
        • 16.2.6 Yara International*List Not Exhaustive
          • 16.2.6.1. Overview
          • 16.2.6.2. Products
          • 16.2.6.3. SWOT Analysis
          • 16.2.6.4. Recent Developments
          • 16.2.6.5. Financials (Based on Availability)
        • 16.2.7 Lhyfe
          • 16.2.7.1. Overview
          • 16.2.7.2. Products
          • 16.2.7.3. SWOT Analysis
          • 16.2.7.4. Recent Developments
          • 16.2.7.5. Financials (Based on Availability)
        • 16.2.8 Linde plc
          • 16.2.8.1. Overview
          • 16.2.8.2. Products
          • 16.2.8.3. SWOT Analysis
          • 16.2.8.4. Recent Developments
          • 16.2.8.5. Financials (Based on Availability)
        • 16.2.9 Cummins Inc
          • 16.2.9.1. Overview
          • 16.2.9.2. Products
          • 16.2.9.3. SWOT Analysis
          • 16.2.9.4. Recent Developments
          • 16.2.9.5. Financials (Based on Availability)
        • 16.2.10 Siemens Energy
          • 16.2.10.1. Overview
          • 16.2.10.2. Products
          • 16.2.10.3. SWOT Analysis
          • 16.2.10.4. Recent Developments
          • 16.2.10.5. Financials (Based on Availability)
        • 16.2.11 Air Liquide
          • 16.2.11.1. Overview
          • 16.2.11.2. Products
          • 16.2.11.3. SWOT Analysis
          • 16.2.11.4. Recent Developments
          • 16.2.11.5. Financials (Based on Availability)
        • 16.2.12 Nel ASA
          • 16.2.12.1. Overview
          • 16.2.12.2. Products
          • 16.2.12.3. SWOT Analysis
          • 16.2.12.4. Recent Developments
          • 16.2.12.5. Financials (Based on Availability)
        • 16.2.13 Bloom Energy
          • 16.2.13.1. Overview
          • 16.2.13.2. Products
          • 16.2.13.3. SWOT Analysis
          • 16.2.13.4. Recent Developments
          • 16.2.13.5. Financials (Based on Availability)

List of Figures

  1. Figure 1: Global Green Hydrogen Market Revenue Breakdown (Million, %) by Region 2024 & 2032
  2. Figure 2: Global Green Hydrogen Market Volume Breakdown (K Tons, %) by Region 2024 & 2032
  3. Figure 3: North America Green Hydrogen Market Revenue (Million), by Country 2024 & 2032
  4. Figure 4: North America Green Hydrogen Market Volume (K Tons), by Country 2024 & 2032
  5. Figure 5: North America Green Hydrogen Market Revenue Share (%), by Country 2024 & 2032
  6. Figure 6: North America Green Hydrogen Market Volume Share (%), by Country 2024 & 2032
  7. Figure 7: Europe Green Hydrogen Market Revenue (Million), by Country 2024 & 2032
  8. Figure 8: Europe Green Hydrogen Market Volume (K Tons), by Country 2024 & 2032
  9. Figure 9: Europe Green Hydrogen Market Revenue Share (%), by Country 2024 & 2032
  10. Figure 10: Europe Green Hydrogen Market Volume Share (%), by Country 2024 & 2032
  11. Figure 11: Asia Pacific Green Hydrogen Market Revenue (Million), by Country 2024 & 2032
  12. Figure 12: Asia Pacific Green Hydrogen Market Volume (K Tons), by Country 2024 & 2032
  13. Figure 13: Asia Pacific Green Hydrogen Market Revenue Share (%), by Country 2024 & 2032
  14. Figure 14: Asia Pacific Green Hydrogen Market Volume Share (%), by Country 2024 & 2032
  15. Figure 15: South America Green Hydrogen Market Revenue (Million), by Country 2024 & 2032
  16. Figure 16: South America Green Hydrogen Market Volume (K Tons), by Country 2024 & 2032
  17. Figure 17: South America Green Hydrogen Market Revenue Share (%), by Country 2024 & 2032
  18. Figure 18: South America Green Hydrogen Market Volume Share (%), by Country 2024 & 2032
  19. Figure 19: North America Green Hydrogen Market Revenue (Million), by Country 2024 & 2032
  20. Figure 20: North America Green Hydrogen Market Volume (K Tons), by Country 2024 & 2032
  21. Figure 21: North America Green Hydrogen Market Revenue Share (%), by Country 2024 & 2032
  22. Figure 22: North America Green Hydrogen Market Volume Share (%), by Country 2024 & 2032
  23. Figure 23: MEA Green Hydrogen Market Revenue (Million), by Country 2024 & 2032
  24. Figure 24: MEA Green Hydrogen Market Volume (K Tons), by Country 2024 & 2032
  25. Figure 25: MEA Green Hydrogen Market Revenue Share (%), by Country 2024 & 2032
  26. Figure 26: MEA Green Hydrogen Market Volume Share (%), by Country 2024 & 2032
  27. Figure 27: Asia Pacific Green Hydrogen Market Revenue (Million), by End-user Industry 2024 & 2032
  28. Figure 28: Asia Pacific Green Hydrogen Market Volume (K Tons), by End-user Industry 2024 & 2032
  29. Figure 29: Asia Pacific Green Hydrogen Market Revenue Share (%), by End-user Industry 2024 & 2032
  30. Figure 30: Asia Pacific Green Hydrogen Market Volume Share (%), by End-user Industry 2024 & 2032
  31. Figure 31: Asia Pacific Green Hydrogen Market Revenue (Million), by Country 2024 & 2032
  32. Figure 32: Asia Pacific Green Hydrogen Market Volume (K Tons), by Country 2024 & 2032
  33. Figure 33: Asia Pacific Green Hydrogen Market Revenue Share (%), by Country 2024 & 2032
  34. Figure 34: Asia Pacific Green Hydrogen Market Volume Share (%), by Country 2024 & 2032
  35. Figure 35: North America Green Hydrogen Market Revenue (Million), by End-user Industry 2024 & 2032
  36. Figure 36: North America Green Hydrogen Market Volume (K Tons), by End-user Industry 2024 & 2032
  37. Figure 37: North America Green Hydrogen Market Revenue Share (%), by End-user Industry 2024 & 2032
  38. Figure 38: North America Green Hydrogen Market Volume Share (%), by End-user Industry 2024 & 2032
  39. Figure 39: North America Green Hydrogen Market Revenue (Million), by Country 2024 & 2032
  40. Figure 40: North America Green Hydrogen Market Volume (K Tons), by Country 2024 & 2032
  41. Figure 41: North America Green Hydrogen Market Revenue Share (%), by Country 2024 & 2032
  42. Figure 42: North America Green Hydrogen Market Volume Share (%), by Country 2024 & 2032
  43. Figure 43: Europe Green Hydrogen Market Revenue (Million), by End-user Industry 2024 & 2032
  44. Figure 44: Europe Green Hydrogen Market Volume (K Tons), by End-user Industry 2024 & 2032
  45. Figure 45: Europe Green Hydrogen Market Revenue Share (%), by End-user Industry 2024 & 2032
  46. Figure 46: Europe Green Hydrogen Market Volume Share (%), by End-user Industry 2024 & 2032
  47. Figure 47: Europe Green Hydrogen Market Revenue (Million), by Country 2024 & 2032
  48. Figure 48: Europe Green Hydrogen Market Volume (K Tons), by Country 2024 & 2032
  49. Figure 49: Europe Green Hydrogen Market Revenue Share (%), by Country 2024 & 2032
  50. Figure 50: Europe Green Hydrogen Market Volume Share (%), by Country 2024 & 2032
  51. Figure 51: Rest of the World Green Hydrogen Market Revenue (Million), by End-user Industry 2024 & 2032
  52. Figure 52: Rest of the World Green Hydrogen Market Volume (K Tons), by End-user Industry 2024 & 2032
  53. Figure 53: Rest of the World Green Hydrogen Market Revenue Share (%), by End-user Industry 2024 & 2032
  54. Figure 54: Rest of the World Green Hydrogen Market Volume Share (%), by End-user Industry 2024 & 2032
  55. Figure 55: Rest of the World Green Hydrogen Market Revenue (Million), by Country 2024 & 2032
  56. Figure 56: Rest of the World Green Hydrogen Market Volume (K Tons), by Country 2024 & 2032
  57. Figure 57: Rest of the World Green Hydrogen Market Revenue Share (%), by Country 2024 & 2032
  58. Figure 58: Rest of the World Green Hydrogen Market Volume Share (%), by Country 2024 & 2032

List of Tables

  1. Table 1: Global Green Hydrogen Market Revenue Million Forecast, by Region 2019 & 2032
  2. Table 2: Global Green Hydrogen Market Volume K Tons Forecast, by Region 2019 & 2032
  3. Table 3: Global Green Hydrogen Market Revenue Million Forecast, by End-user Industry 2019 & 2032
  4. Table 4: Global Green Hydrogen Market Volume K Tons Forecast, by End-user Industry 2019 & 2032
  5. Table 5: Global Green Hydrogen Market Revenue Million Forecast, by Region 2019 & 2032
  6. Table 6: Global Green Hydrogen Market Volume K Tons Forecast, by Region 2019 & 2032
  7. Table 7: Global Green Hydrogen Market Revenue Million Forecast, by Country 2019 & 2032
  8. Table 8: Global Green Hydrogen Market Volume K Tons Forecast, by Country 2019 & 2032
  9. Table 9: United States Green Hydrogen Market Revenue (Million) Forecast, by Application 2019 & 2032
  10. Table 10: United States Green Hydrogen Market Volume (K Tons) Forecast, by Application 2019 & 2032
  11. Table 11: Canada Green Hydrogen Market Revenue (Million) Forecast, by Application 2019 & 2032
  12. Table 12: Canada Green Hydrogen Market Volume (K Tons) Forecast, by Application 2019 & 2032
  13. Table 13: Mexico Green Hydrogen Market Revenue (Million) Forecast, by Application 2019 & 2032
  14. Table 14: Mexico Green Hydrogen Market Volume (K Tons) Forecast, by Application 2019 & 2032
  15. Table 15: Global Green Hydrogen Market Revenue Million Forecast, by Country 2019 & 2032
  16. Table 16: Global Green Hydrogen Market Volume K Tons Forecast, by Country 2019 & 2032
  17. Table 17: Germany Green Hydrogen Market Revenue (Million) Forecast, by Application 2019 & 2032
  18. Table 18: Germany Green Hydrogen Market Volume (K Tons) Forecast, by Application 2019 & 2032
  19. Table 19: United Kingdom Green Hydrogen Market Revenue (Million) Forecast, by Application 2019 & 2032
  20. Table 20: United Kingdom Green Hydrogen Market Volume (K Tons) Forecast, by Application 2019 & 2032
  21. Table 21: France Green Hydrogen Market Revenue (Million) Forecast, by Application 2019 & 2032
  22. Table 22: France Green Hydrogen Market Volume (K Tons) Forecast, by Application 2019 & 2032
  23. Table 23: Spain Green Hydrogen Market Revenue (Million) Forecast, by Application 2019 & 2032
  24. Table 24: Spain Green Hydrogen Market Volume (K Tons) Forecast, by Application 2019 & 2032
  25. Table 25: Italy Green Hydrogen Market Revenue (Million) Forecast, by Application 2019 & 2032
  26. Table 26: Italy Green Hydrogen Market Volume (K Tons) Forecast, by Application 2019 & 2032
  27. Table 27: Spain Green Hydrogen Market Revenue (Million) Forecast, by Application 2019 & 2032
  28. Table 28: Spain Green Hydrogen Market Volume (K Tons) Forecast, by Application 2019 & 2032
  29. Table 29: Belgium Green Hydrogen Market Revenue (Million) Forecast, by Application 2019 & 2032
  30. Table 30: Belgium Green Hydrogen Market Volume (K Tons) Forecast, by Application 2019 & 2032
  31. Table 31: Netherland Green Hydrogen Market Revenue (Million) Forecast, by Application 2019 & 2032
  32. Table 32: Netherland Green Hydrogen Market Volume (K Tons) Forecast, by Application 2019 & 2032
  33. Table 33: Nordics Green Hydrogen Market Revenue (Million) Forecast, by Application 2019 & 2032
  34. Table 34: Nordics Green Hydrogen Market Volume (K Tons) Forecast, by Application 2019 & 2032
  35. Table 35: Rest of Europe Green Hydrogen Market Revenue (Million) Forecast, by Application 2019 & 2032
  36. Table 36: Rest of Europe Green Hydrogen Market Volume (K Tons) Forecast, by Application 2019 & 2032
  37. Table 37: Global Green Hydrogen Market Revenue Million Forecast, by Country 2019 & 2032
  38. Table 38: Global Green Hydrogen Market Volume K Tons Forecast, by Country 2019 & 2032
  39. Table 39: China Green Hydrogen Market Revenue (Million) Forecast, by Application 2019 & 2032
  40. Table 40: China Green Hydrogen Market Volume (K Tons) Forecast, by Application 2019 & 2032
  41. Table 41: Japan Green Hydrogen Market Revenue (Million) Forecast, by Application 2019 & 2032
  42. Table 42: Japan Green Hydrogen Market Volume (K Tons) Forecast, by Application 2019 & 2032
  43. Table 43: India Green Hydrogen Market Revenue (Million) Forecast, by Application 2019 & 2032
  44. Table 44: India Green Hydrogen Market Volume (K Tons) Forecast, by Application 2019 & 2032
  45. Table 45: South Korea Green Hydrogen Market Revenue (Million) Forecast, by Application 2019 & 2032
  46. Table 46: South Korea Green Hydrogen Market Volume (K Tons) Forecast, by Application 2019 & 2032
  47. Table 47: Southeast Asia Green Hydrogen Market Revenue (Million) Forecast, by Application 2019 & 2032
  48. Table 48: Southeast Asia Green Hydrogen Market Volume (K Tons) Forecast, by Application 2019 & 2032
  49. Table 49: Australia Green Hydrogen Market Revenue (Million) Forecast, by Application 2019 & 2032
  50. Table 50: Australia Green Hydrogen Market Volume (K Tons) Forecast, by Application 2019 & 2032
  51. Table 51: Indonesia Green Hydrogen Market Revenue (Million) Forecast, by Application 2019 & 2032
  52. Table 52: Indonesia Green Hydrogen Market Volume (K Tons) Forecast, by Application 2019 & 2032
  53. Table 53: Phillipes Green Hydrogen Market Revenue (Million) Forecast, by Application 2019 & 2032
  54. Table 54: Phillipes Green Hydrogen Market Volume (K Tons) Forecast, by Application 2019 & 2032
  55. Table 55: Singapore Green Hydrogen Market Revenue (Million) Forecast, by Application 2019 & 2032
  56. Table 56: Singapore Green Hydrogen Market Volume (K Tons) Forecast, by Application 2019 & 2032
  57. Table 57: Thailandc Green Hydrogen Market Revenue (Million) Forecast, by Application 2019 & 2032
  58. Table 58: Thailandc Green Hydrogen Market Volume (K Tons) Forecast, by Application 2019 & 2032
  59. Table 59: Rest of Asia Pacific Green Hydrogen Market Revenue (Million) Forecast, by Application 2019 & 2032
  60. Table 60: Rest of Asia Pacific Green Hydrogen Market Volume (K Tons) Forecast, by Application 2019 & 2032
  61. Table 61: Global Green Hydrogen Market Revenue Million Forecast, by Country 2019 & 2032
  62. Table 62: Global Green Hydrogen Market Volume K Tons Forecast, by Country 2019 & 2032
  63. Table 63: Brazil Green Hydrogen Market Revenue (Million) Forecast, by Application 2019 & 2032
  64. Table 64: Brazil Green Hydrogen Market Volume (K Tons) Forecast, by Application 2019 & 2032
  65. Table 65: Argentina Green Hydrogen Market Revenue (Million) Forecast, by Application 2019 & 2032
  66. Table 66: Argentina Green Hydrogen Market Volume (K Tons) Forecast, by Application 2019 & 2032
  67. Table 67: Peru Green Hydrogen Market Revenue (Million) Forecast, by Application 2019 & 2032
  68. Table 68: Peru Green Hydrogen Market Volume (K Tons) Forecast, by Application 2019 & 2032
  69. Table 69: Chile Green Hydrogen Market Revenue (Million) Forecast, by Application 2019 & 2032
  70. Table 70: Chile Green Hydrogen Market Volume (K Tons) Forecast, by Application 2019 & 2032
  71. Table 71: Colombia Green Hydrogen Market Revenue (Million) Forecast, by Application 2019 & 2032
  72. Table 72: Colombia Green Hydrogen Market Volume (K Tons) Forecast, by Application 2019 & 2032
  73. Table 73: Ecuador Green Hydrogen Market Revenue (Million) Forecast, by Application 2019 & 2032
  74. Table 74: Ecuador Green Hydrogen Market Volume (K Tons) Forecast, by Application 2019 & 2032
  75. Table 75: Venezuela Green Hydrogen Market Revenue (Million) Forecast, by Application 2019 & 2032
  76. Table 76: Venezuela Green Hydrogen Market Volume (K Tons) Forecast, by Application 2019 & 2032
  77. Table 77: Rest of South America Green Hydrogen Market Revenue (Million) Forecast, by Application 2019 & 2032
  78. Table 78: Rest of South America Green Hydrogen Market Volume (K Tons) Forecast, by Application 2019 & 2032
  79. Table 79: Global Green Hydrogen Market Revenue Million Forecast, by Country 2019 & 2032
  80. Table 80: Global Green Hydrogen Market Volume K Tons Forecast, by Country 2019 & 2032
  81. Table 81: United States Green Hydrogen Market Revenue (Million) Forecast, by Application 2019 & 2032
  82. Table 82: United States Green Hydrogen Market Volume (K Tons) Forecast, by Application 2019 & 2032
  83. Table 83: Canada Green Hydrogen Market Revenue (Million) Forecast, by Application 2019 & 2032
  84. Table 84: Canada Green Hydrogen Market Volume (K Tons) Forecast, by Application 2019 & 2032
  85. Table 85: Mexico Green Hydrogen Market Revenue (Million) Forecast, by Application 2019 & 2032
  86. Table 86: Mexico Green Hydrogen Market Volume (K Tons) Forecast, by Application 2019 & 2032
  87. Table 87: Global Green Hydrogen Market Revenue Million Forecast, by Country 2019 & 2032
  88. Table 88: Global Green Hydrogen Market Volume K Tons Forecast, by Country 2019 & 2032
  89. Table 89: United Arab Emirates Green Hydrogen Market Revenue (Million) Forecast, by Application 2019 & 2032
  90. Table 90: United Arab Emirates Green Hydrogen Market Volume (K Tons) Forecast, by Application 2019 & 2032
  91. Table 91: Saudi Arabia Green Hydrogen Market Revenue (Million) Forecast, by Application 2019 & 2032
  92. Table 92: Saudi Arabia Green Hydrogen Market Volume (K Tons) Forecast, by Application 2019 & 2032
  93. Table 93: South Africa Green Hydrogen Market Revenue (Million) Forecast, by Application 2019 & 2032
  94. Table 94: South Africa Green Hydrogen Market Volume (K Tons) Forecast, by Application 2019 & 2032
  95. Table 95: Rest of Middle East and Africa Green Hydrogen Market Revenue (Million) Forecast, by Application 2019 & 2032
  96. Table 96: Rest of Middle East and Africa Green Hydrogen Market Volume (K Tons) Forecast, by Application 2019 & 2032
  97. Table 97: Global Green Hydrogen Market Revenue Million Forecast, by End-user Industry 2019 & 2032
  98. Table 98: Global Green Hydrogen Market Volume K Tons Forecast, by End-user Industry 2019 & 2032
  99. Table 99: Global Green Hydrogen Market Revenue Million Forecast, by Country 2019 & 2032
  100. Table 100: Global Green Hydrogen Market Volume K Tons Forecast, by Country 2019 & 2032
  101. Table 101: China Green Hydrogen Market Revenue (Million) Forecast, by Application 2019 & 2032
  102. Table 102: China Green Hydrogen Market Volume (K Tons) Forecast, by Application 2019 & 2032
  103. Table 103: India Green Hydrogen Market Revenue (Million) Forecast, by Application 2019 & 2032
  104. Table 104: India Green Hydrogen Market Volume (K Tons) Forecast, by Application 2019 & 2032
  105. Table 105: Japan Green Hydrogen Market Revenue (Million) Forecast, by Application 2019 & 2032
  106. Table 106: Japan Green Hydrogen Market Volume (K Tons) Forecast, by Application 2019 & 2032
  107. Table 107: South Korea Green Hydrogen Market Revenue (Million) Forecast, by Application 2019 & 2032
  108. Table 108: South Korea Green Hydrogen Market Volume (K Tons) Forecast, by Application 2019 & 2032
  109. Table 109: Rest of Asia Pacific Green Hydrogen Market Revenue (Million) Forecast, by Application 2019 & 2032
  110. Table 110: Rest of Asia Pacific Green Hydrogen Market Volume (K Tons) Forecast, by Application 2019 & 2032
  111. Table 111: Global Green Hydrogen Market Revenue Million Forecast, by End-user Industry 2019 & 2032
  112. Table 112: Global Green Hydrogen Market Volume K Tons Forecast, by End-user Industry 2019 & 2032
  113. Table 113: Global Green Hydrogen Market Revenue Million Forecast, by Country 2019 & 2032
  114. Table 114: Global Green Hydrogen Market Volume K Tons Forecast, by Country 2019 & 2032
  115. Table 115: United States Green Hydrogen Market Revenue (Million) Forecast, by Application 2019 & 2032
  116. Table 116: United States Green Hydrogen Market Volume (K Tons) Forecast, by Application 2019 & 2032
  117. Table 117: Canada Green Hydrogen Market Revenue (Million) Forecast, by Application 2019 & 2032
  118. Table 118: Canada Green Hydrogen Market Volume (K Tons) Forecast, by Application 2019 & 2032
  119. Table 119: Mexico Green Hydrogen Market Revenue (Million) Forecast, by Application 2019 & 2032
  120. Table 120: Mexico Green Hydrogen Market Volume (K Tons) Forecast, by Application 2019 & 2032
  121. Table 121: Global Green Hydrogen Market Revenue Million Forecast, by End-user Industry 2019 & 2032
  122. Table 122: Global Green Hydrogen Market Volume K Tons Forecast, by End-user Industry 2019 & 2032
  123. Table 123: Global Green Hydrogen Market Revenue Million Forecast, by Country 2019 & 2032
  124. Table 124: Global Green Hydrogen Market Volume K Tons Forecast, by Country 2019 & 2032
  125. Table 125: Germany Green Hydrogen Market Revenue (Million) Forecast, by Application 2019 & 2032
  126. Table 126: Germany Green Hydrogen Market Volume (K Tons) Forecast, by Application 2019 & 2032
  127. Table 127: United Kingdom Green Hydrogen Market Revenue (Million) Forecast, by Application 2019 & 2032
  128. Table 128: United Kingdom Green Hydrogen Market Volume (K Tons) Forecast, by Application 2019 & 2032
  129. Table 129: France Green Hydrogen Market Revenue (Million) Forecast, by Application 2019 & 2032
  130. Table 130: France Green Hydrogen Market Volume (K Tons) Forecast, by Application 2019 & 2032
  131. Table 131: Italy Green Hydrogen Market Revenue (Million) Forecast, by Application 2019 & 2032
  132. Table 132: Italy Green Hydrogen Market Volume (K Tons) Forecast, by Application 2019 & 2032
  133. Table 133: Rest of Europe Green Hydrogen Market Revenue (Million) Forecast, by Application 2019 & 2032
  134. Table 134: Rest of Europe Green Hydrogen Market Volume (K Tons) Forecast, by Application 2019 & 2032
  135. Table 135: Global Green Hydrogen Market Revenue Million Forecast, by End-user Industry 2019 & 2032
  136. Table 136: Global Green Hydrogen Market Volume K Tons Forecast, by End-user Industry 2019 & 2032
  137. Table 137: Global Green Hydrogen Market Revenue Million Forecast, by Country 2019 & 2032
  138. Table 138: Global Green Hydrogen Market Volume K Tons Forecast, by Country 2019 & 2032
  139. Table 139: South America Green Hydrogen Market Revenue (Million) Forecast, by Application 2019 & 2032
  140. Table 140: South America Green Hydrogen Market Volume (K Tons) Forecast, by Application 2019 & 2032
  141. Table 141: Middle East and Africa Green Hydrogen Market Revenue (Million) Forecast, by Application 2019 & 2032
  142. Table 142: Middle East and Africa Green Hydrogen Market Volume (K Tons) Forecast, by Application 2019 & 2032


Frequently Asked Questions

1. What is the projected Compound Annual Growth Rate (CAGR) of the Green Hydrogen Market?

The projected CAGR is approximately > 60.00%.

2. Which companies are prominent players in the Green Hydrogen Market?

Key companies in the market include Uniper SE, Toshiba Energy Systems & Solutions Corporation, Iberdrola, Air Products Inc, Engie, Yara International*List Not Exhaustive, Lhyfe, Linde plc, Cummins Inc, Siemens Energy, Air Liquide, Nel ASA, Bloom Energy.

3. What are the main segments of the Green Hydrogen Market?

The market segments include End-user Industry.

4. Can you provide details about the market size?

The market size is estimated to be USD 3.28 Million as of 2022.

5. What are some drivers contributing to market growth?

Surging Demand in the Chemical Industry; Growing Environmental Concerns Regarding Carbon Emissions.

6. What are the notable trends driving market growth?

Surging Demand in the Chemical Industry.

7. Are there any restraints impacting market growth?

High Cost of Green Hydrogen; Other Market Restraints.

8. Can you provide examples of recent developments in the market?

January 2023: Nel and Statkraft, Europe's largest supplier of renewable energy, signed a contract for delivery of 40 MW electrolyzers and will thus collaborate to create a strong value chain for the production of green hydrogen in Norway.

9. What pricing options are available for accessing the report?

Pricing options include single-user, multi-user, and enterprise licenses priced at USD 4750, USD 5250, and USD 8750 respectively.

10. Is the market size provided in terms of value or volume?

The market size is provided in terms of value, measured in Million and volume, measured in K Tons.

11. Are there any specific market keywords associated with the report?

Yes, the market keyword associated with the report is "Green Hydrogen Market," which aids in identifying and referencing the specific market segment covered.

12. How do I determine which pricing option suits my needs best?

The pricing options vary based on user requirements and access needs. Individual users may opt for single-user licenses, while businesses requiring broader access may choose multi-user or enterprise licenses for cost-effective access to the report.

13. Are there any additional resources or data provided in the Green Hydrogen Market report?

While the report offers comprehensive insights, it's advisable to review the specific contents or supplementary materials provided to ascertain if additional resources or data are available.

14. How can I stay updated on further developments or reports in the Green Hydrogen Market?

To stay informed about further developments, trends, and reports in the Green Hydrogen Market, consider subscribing to industry newsletters, following relevant companies and organizations, or regularly checking reputable industry news sources and publications.


Methodology

Step 1 - Identification of Relevant Samples Size from Population Database

Step Chart
Bar Chart
Method Chart

Step 2 - Approaches for Defining Global Market Size (Value, Volume* & Price*)

Approach Chart
Top-down and bottom-up approaches are used to validate the global market size and estimate the market size for manufactures, regional segments, product, and application.

Note*: In applicable scenarios

Step 3 - Data Sources

Primary Research

  • Web Analytics
  • Survey Reports
  • Research Institute
  • Latest Research Reports
  • Opinion Leaders

Secondary Research

  • Annual Reports
  • White Paper
  • Latest Press Release
  • Industry Association
  • Paid Database
  • Investor Presentations
Analyst Chart

Step 4 - Data Triangulation

Involves using different sources of information in order to increase the validity of a study

These sources are likely to be stakeholders in a program - participants, other researchers, program staff, other community members, and so on.

Then we put all data in single framework & apply various statistical tools to find out the dynamic on the market.

During the analysis stage, feedback from the stakeholder groups would be compared to determine areas of agreement as well as areas of divergence

Additionally, after gathering mixed and scattered data from a wide range of sources, data is triangulated and correlated to come up with estimated figures which are further validated through primary mediums or industry experts, opinion leaders.

About Report Pinnacle

Report Pinnacle provides top-tier market research, industry intelligence, and actionable insights for finance, technology, healthcare, and consumer sectors. Our reports empower you to make informed decisions and achieve business success.

Our expert team combines primary research, data analytics, and industry knowledge to deliver insights you can trust. We offer syndicated reports, custom research, and consulting services tailored to your unique business needs.

At Report Pinnacle, we are committed to quality, transparency, and client satisfaction. Every report is rigorously validated to ensure accuracy and relevance. Our global perspective and local expertise help you understand both broad trends and detailed market shifts.

Stay ahead with Report Pinnacle. Subscribe to our newsletter for the latest insights and research highlights, and follow us on social media for real-time updates.

Report Pinnacle – Your Partner for Reaching the Top in Market Intelligence.

artwork spiralartwork spiralRelated Reports
artwork underline

Opportunities in Ion Exchange Membrane Market Market 2025-2033

The global ion exchange membrane market is booming, driven by water treatment, renewable energy, and battery technology advancements. Explore market size, CAGR, key players, and regional trends in this comprehensive analysis projecting to 2033. Discover lucrative investment opportunities in this rapidly expanding sector.

September 2025
Base Year: 2024
No Of Pages: 150
Price: $4750

Unlocking the Future of APAC Paints & Coatings Additives Industry: Growth and Trends 2025-2033

Discover the booming APAC paints & coatings additives market! This in-depth analysis reveals a CAGR exceeding 6%, driven by construction, automotive, and sustainability trends. Learn about key players, regional breakdowns (China, India, Japan, etc.), and future growth projections to 2033.

September 2025
Base Year: 2024
No Of Pages: 180
Price: $4750

C9 Resin Market CAGR Growth Drivers and Trends: Forecasts 2025-2033

Discover the booming C9 resin market! Explore our comprehensive analysis projecting significant growth through 2033, driven by key applications and technological advancements. Learn about market size, CAGR, and regional trends in this detailed report.

September 2025
Base Year: 2024
No Of Pages: 180
Price: $4750

Analyzing Competitor Moves: Brazil Bioplastics Market Growth Outlook 2025-2033

Discover the booming Brazil bioplastics market! This comprehensive analysis reveals a CAGR of 12.80%, driven by sustainability concerns and government initiatives. Explore market size, key players (Novamont, Arkema, Braskem), segments, and future trends in bio-based biodegradable and non-biodegradable plastics in Brazil (2019-2033).

September 2025
Base Year: 2024
No Of Pages: 120
Price: $3800

Dry Mix Mortar Additives and Chemicals Market Industry Growth Trends and Analysis

Discover the booming Dry Mix Mortar Additives & Chemicals market! This comprehensive analysis reveals a CAGR of 4.52%, driven by construction growth and sustainable building trends. Explore market segmentation, key players (Nouryon, BASF, Sika), and regional insights (Asia-Pacific leading). Project your business strategy with our detailed forecast to 2033.

September 2025
Base Year: 2024
No Of Pages: 150
Price: $4750

Market Deep Dive: Exploring Betaine Market Trends 2025-2033

Discover the booming Betaine Market analysis! Explore key trends, drivers, and restraints impacting this $XX million industry, featuring insights on Betaine Anhydrous, Monohydrate, and HCl forms, across food, animal feed, and personal care applications. Growth projections to 2033 reveal lucrative investment opportunities.

August 2025
Base Year: 2024
No Of Pages: 150
Price: $4750

Acetylene Industry Market Report: Trends and Growth

Discover the latest insights into the $11.38B Acetylene market. Explore growth drivers, regional trends (Asia Pacific leading), key players (Linde, Air Products), and future forecasts (2.54% CAGR) to 2033. Understand the impact of metal working, chemical applications, and emerging technologies on this vital industry.

August 2025
Base Year: 2024
No Of Pages: 180
Price: $4750

Norway Lubricants Market in Developing Economies: Trends and Growth Analysis 2025-2033

Discover the latest insights into the Norway lubricants market. This comprehensive analysis reveals steady growth driven by automotive, marine, and industrial sectors, alongside market trends, key players (BP Castrol, ExxonMobil, Shell), and future projections to 2033. Explore market size, CAGR, and regional dynamics.

August 2025
Base Year: 2024
No Of Pages: 197
Price: $3800

South Korea Passenger Vehicles Lubricants Market Market’s Tech Revolution: Projections to 2033

Discover the booming South Korea passenger vehicle lubricants market! This in-depth analysis reveals a $250 million market in 2025, projected to reach over $350 million by 2033, driven by increasing vehicle numbers and demand for high-performance lubricants. Explore market trends, key players (ExxonMobil, Shell, Castrol, GS Caltex), and growth opportunities.

August 2025
Base Year: 2024
No Of Pages: 180
Price: $3800

Isophthalic Acid Industry Market Report: Trends and Growth

Discover the booming Isophthalic Acid market! This comprehensive analysis reveals a CAGR exceeding 4%, driven by PET packaging, construction, and technological advancements. Explore regional trends, key players (Shell, Honeywell, etc.), and future growth projections for the period 2025-2033. Get insights into market segmentation and key challenges.

August 2025
Base Year: 2024
No Of Pages: 180
Price: $4750

Ferroboron Market Charting Growth Trajectories 2025-2033: Strategic Insights and Forecasts

The Ferroboron Market is booming, with a CAGR exceeding 5.50% through 2033. Driven by automotive, construction, and steel advancements, this report analyzes market size, regional shares (North America, Europe, Asia-Pacific), key players (AMPERRE alloys, CRONIMET), and future trends. Discover insights into this high-growth sector.

August 2025
Base Year: 2024
No Of Pages: 234
Price: $4750

Unlocking Insights for Green Hydrogen Market Growth Strategies

The green hydrogen market is booming, with a CAGR exceeding 60% and a projected value of $3.28 billion in 2025. Learn about key drivers, trends, restraints, and regional market share in this comprehensive analysis, covering major players and future forecasts to 2033. Discover the opportunities and challenges in this rapidly expanding sector of the renewable energy market.

August 2025
Base Year: 2024
No Of Pages: 180
Price: $4750

Carbon Fiber Market Market Analysis and Forecasts

The global carbon fiber market is booming, projected to reach $42.9 Billion by 2033 with a 10.05% CAGR. Driven by aerospace, renewable energy, and automotive sectors, this detailed market analysis explores key trends, restraints, and leading companies shaping this high-growth industry.

August 2025
Base Year: 2024
No Of Pages: 234
Price: $4750

Deep Dive into Bromine Industry: Comprehensive Growth Analysis 2025-2033

Discover the booming bromine market forecast to 2033! This in-depth analysis reveals a CAGR of 5%, driven by flame retardants, biocides, and energy storage. Explore key players, regional trends, and market segmentation for organobromines, bromide salts, and more. Get your free market report now!

August 2025
Base Year: 2024
No Of Pages: 180
Price: $3,950

Future Trends Shaping Viscosity Reducing Agents Market Growth

Discover the booming viscosity reducing agents market! Our comprehensive analysis reveals a CAGR of 5.68% to 2033, driven by oil & gas, paints & coatings, and plastics industries. Explore key players, regional trends, and future growth projections in this detailed market report.

August 2025
Base Year: 2024
No Of Pages: 180
Price: $3,950

Europe Protective Coatings Market Projected to Grow at XX CAGR: Insights and Forecasts 2025-2033

The European Protective Coatings Market is booming, projected to surpass €20 billion by 2033, driven by infrastructure growth and eco-friendly regulations. Explore market trends, key players (Akzo Nobel, BASF, PPG), and regional analysis in this comprehensive report.

August 2025
Base Year: 2024
No Of Pages: 180
Price: $4750

Emerging Markets for Indonesia Lubricant Market Industry

Discover the booming Indonesian lubricant market forecast to 2033! This in-depth analysis reveals market size, CAGR, key drivers, trends, restraints, and leading companies like Castrol and Shell. Explore regional breakdowns and future growth opportunities in this dynamic sector.

August 2025
Base Year: 2024
No Of Pages: 197
Price: $3800

Exploring Ethyl Levulinate Market Market Ecosystem: Insights to 2033

Discover the booming Ethyl Levulinate market! This comprehensive analysis reveals a CAGR exceeding 3%, driven by soaring demand in food, fragrance, and pharmaceutical applications. Explore market size, key players, regional trends, and future growth projections from 2025-2033.

August 2025
Base Year: 2024
No Of Pages: 234
Price: $4750

Aramid Fiber Market Market Report: Trends and Growth

Discover the booming aramid fiber market! This comprehensive analysis reveals a CAGR exceeding 4%, driven by aerospace, automotive, and construction sectors. Explore market trends, key players (DuPont, Teijin, Kolon), and future growth projections for 2025-2033. Learn about regional market shares and emerging opportunities in this high-growth industry.

August 2025
Base Year: 2024
No Of Pages: 234
Price: $4750

Diamond Wire Market Future-Proof Strategies: Market Trends 2025-2033

Discover the booming diamond wire market! This comprehensive analysis reveals a CAGR exceeding 10%, driven by solar, semiconductor, and construction applications. Explore market trends, key players (Dellas S p A, Logomatic GmbH, etc.), and regional insights (Asia Pacific leading) for the period 2019-2033. Get your free report now!

August 2025
Base Year: 2024
No Of Pages: 234
Price: $4750

Europe Automotive Coatings Market Market’s Decade-Long Growth Trends and Future Projections 2025-2033

Discover the latest insights into the booming European automotive coatings market. This comprehensive analysis reveals a €4.96 billion market in 2025, projected to grow at a 3% CAGR until 2033, driven by factors like increasing vehicle production and demand for sustainable coatings. Explore market trends, key players (Sherwin-Williams, PPG, BASF), and regional variations impacting this dynamic sector.

August 2025
Base Year: 2024
No Of Pages: 180
Price: $4750

Emerging Markets Driving Bulgaria Passenger Vehicles Lubricants Market Growth

Discover the growth potential of the Bulgarian passenger vehicle lubricants market. This comprehensive analysis reveals market size, CAGR, key players (ExxonMobil, Shell, Castrol, Motul etc.), market trends, and future projections through 2033. Learn about the leading segments (engine oils, greases, etc.) and unlock valuable insights for investment and business strategies.

August 2025
Base Year: 2024
No Of Pages: 180
Price: $3800

Opacifiers Market Market Growth Fueled by CAGR to XXX Million by 2033

Discover the booming opacifiers market! This in-depth analysis reveals a $XX million market with a 4%+ CAGR, driven by construction, paints & coatings, and personal care. Explore key trends, regional insights, and leading companies like Tronox and Kronos.

August 2025
Base Year: 2024
No Of Pages: 150
Price: $4750

Brazil Lubricants Industry 2025-2033 Trends and Competitor Dynamics: Unlocking Growth Opportunities

Discover the dynamic Brazil lubricants market. This in-depth analysis reveals key trends, growth drivers, and challenges for 2025-2033, highlighting leading companies and regional market share. Explore the opportunities and risks in this expanding $5 billion market.

August 2025
Base Year: 2024
No Of Pages: 197
Price: $3800

Europe Surface Treatment Chemicals Market Future-Proof Strategies: Market Trends 2025-2033

Discover the booming Europe Surface Treatment Chemicals market! This in-depth analysis reveals a CAGR exceeding 5%, driven by environmental regulations and industry demand. Explore market size projections, key players (Chemetall, Henkel, Oerlikon), and future trends impacting this €3.5 Billion+ market.

August 2025
Base Year: 2024
No Of Pages: 234
Price: $4750

Plastic Packaging Industry in Vietnam Industry Growth Trends and Analysis

Discover the booming Vietnamese plastic packaging market! Explore its $10B+ valuation, 8.44% CAGR, key drivers, and major players. Learn about market segmentation, growth trends, and the rise of sustainable packaging alternatives in this comprehensive analysis (2019-2033).

August 2025
Base Year: 2024
No Of Pages: 180
Price: $3800

Europe Elastic Adhesive Market Insights: Market Size Analysis to 2033

Discover the booming European elastic adhesive market! This in-depth analysis reveals key trends, growth drivers, and future projections for 2025-2033. Learn about market size, CAGR, and regional shares. Invest wisely in this expanding sector.

August 2025
Base Year: 2024
No Of Pages: 234
Price: $4750

Amorphous Polyethylene Terephthalate Market Industry’s Future Growth Prospects

Discover the booming Amorphous Polyethylene Terephthalate (APET) market! This comprehensive analysis reveals key trends, growth drivers, and regional market shares from 2019-2033, highlighting leading companies and projected CAGR. Learn about the future of APET in packaging and beyond.

August 2025
Base Year: 2024
No Of Pages: 180
Price: $4750

High-Temperature Grease Market Decoded: Comprehensive Analysis and Forecasts 2025-2033

The high-temperature grease market is booming, projected to reach $XX million by 2033, driven by automotive, aerospace, and manufacturing demands. Explore market trends, key players (BP, Chevron, ExxonMobil), and regional growth forecasts in this comprehensive analysis. Discover the challenges and opportunities shaping this lucrative sector.

August 2025
Base Year: 2024
No Of Pages: 234
Price: $4750

Exploring Africa Lubricants Industry’s Market Size Dynamics 2025-2033

Discover the booming African lubricants market! This in-depth analysis reveals a projected CAGR of 3.32% to 2033, driven by automotive growth and infrastructure development. Learn about key players, market segmentation, and challenges impacting engine oils, greases, and more in this comprehensive report.

August 2025
Base Year: 2024
No Of Pages: 197
Price: $3800

Automotive Lubricants Market XX CAGR Growth to Drive Market Size to XXX Million by 2033

Discover the latest trends and insights into the booming automotive lubricants market. Learn about its $50 billion valuation, 3.13% CAGR, key players, and regional growth projections to 2033. Explore the impact of EV adoption and sustainability initiatives on this dynamic sector.

August 2025
Base Year: 2024
No Of Pages: 197
Price: $3800

Exploring Silane Coupling Agent Market’s Market Size Dynamics 2025-2033

Discover the booming silane coupling agent market! This comprehensive analysis reveals key trends, drivers, and restraints shaping this $XX million industry (estimated) with a CAGR exceeding 3%. Explore regional market share, leading companies, and future growth projections through 2033.

August 2025
Base Year: 2024
No Of Pages: 150
Price: $4750

Analyzing Competitor Moves: Hydrocolloid Industry Growth Outlook 2025-2033

Discover the booming hydrocolloid market! Explore detailed analysis of market size, CAGR, key drivers (food processing, consumer trends), restraints, and regional trends (Asia Pacific, North America, Europe) until 2033. Learn about leading companies like ADM, Cargill, and Ingredion. Invest wisely with our comprehensive market report.

August 2025
Base Year: 2024
No Of Pages: 234
Price: $4750

Comprehensive Review of Stainless Steel Plumbing Pipes & Fittings Market Growth Potential

Discover the booming stainless steel plumbing pipes & fittings market! This comprehensive analysis reveals key trends, growth drivers, and regional insights for 2025-2033, including projections for CAGR, market segmentation, and competitive landscape. Learn about top players and investment opportunities in this expanding sector.

August 2025
Base Year: 2024
No Of Pages: 180
Price: $4750

Flotation Reagent Market Future-Proof Strategies: Market Trends 2025-2033

The global flotation reagent market is booming, with a CAGR exceeding 4% through 2033. Driven by mining, construction, and water treatment needs, this market analysis reveals key trends, restraints, and leading companies like Clariant and Solvay. Explore regional breakdowns and future growth projections.

August 2025
Base Year: 2024
No Of Pages: 180
Price: $4750

Benzoe Siam Market Market Analysis and Forecasts

Discover the booming Benzoin Siam market! This comprehensive analysis reveals key trends, drivers, and restraints influencing growth through 2033. Explore regional market share, leading companies, and future projections for this valuable natural ingredient used in fragrance, personal care, and more.

August 2025
Base Year: 2024
No Of Pages: 234
Price: $4750

Innovations Driving Pour Point Depressants Market Market 2025-2033

The Pour Point Depressants Market is booming, projected to reach $3440 million by 2033. Explore market trends, CAGR analysis, and regional insights for this crucial fuel additive segment. Discover how increasing fuel demands and environmental regulations drive market growth.

August 2025
Base Year: 2024
No Of Pages: 180
Price: $4750

Exploring Key Dynamics of Silicon Carbide Market Industry

The Silicon Carbide (SiC) market is booming, projected to reach $3.3 billion by 2025 and grow at a CAGR exceeding 10% through 2033. Driven by EV adoption and renewable energy, this report analyzes market trends, key players (Saint Gobain, Imerys, Morgan Advanced Materials), and regional growth, offering valuable insights for investors and industry professionals.

August 2025
Base Year: 2024
No Of Pages: 234
Price: $4750

South Africa Car Lubricants Market Market’s Drivers and Challenges: Strategic Overview 2025-2033

Discover the latest insights into the thriving South Africa car lubricants market. This comprehensive analysis reveals a market projected to reach $XXX million by 2025, growing at a CAGR of 3.82% through 2033. Explore key drivers, trends, restraints, and regional market share data for engine oils, greases, and more. Learn how top players like Shell and ExxonMobil are competing in this dynamic sector.

August 2025
Base Year: 2024
No Of Pages: 120
Price: $3800

Asia Pacific Green Cement Market Market Drivers and Challenges: Trends 2025-2033

The Asia Pacific green cement market is booming, projected to surpass $XX million by 2033, driven by eco-conscious construction and government regulations. Explore market trends, key players (like Holcim, CEMEX, and UltraTech), and growth forecasts in our comprehensive analysis.

August 2025
Base Year: 2024
No Of Pages: 234
Price: $4750

Bio-based 1,4-Butanediol Market Market Overview: Trends and Strategic Forecasts 2025-2033

Discover the booming bio-based 1,4-Butanediol (BDO) market! Explore its 9.45% CAGR, key drivers, restraints, and regional insights. Learn about leading companies and applications like PBT, THF, and PU. Get the forecast for 2025-2033 and understand the future of sustainable chemicals.

August 2025
Base Year: 2024
No Of Pages: 180
Price: $4750

Recovered Carbon Black Market Analysis Report 2025: Market to Grow by a CAGR of XX to 2033, Driven by Government Incentives, Popularity of Virtual Assistants, and Strategic Partnerships

Discover the booming Recovered Carbon Black market! Explore its projected growth (CAGR 2.00%), key drivers, restraints, and regional analysis (North America, Europe, Asia-Pacific). Learn about top companies and applications like tires, plastics, and more. Invest in sustainable solutions – get your insights now!

August 2025
Base Year: 2024
No Of Pages: 234
Price: $4750

Mechanical Seals Market Market’s Consumer Landscape: Insights and Trends 2025-2033

The global mechanical seals market is booming, with a CAGR exceeding 3.50% through 2033. Driven by energy efficiency demands and technological advancements, this market is segmented by seal type (pump, compressor, mixer) and end-user industry (power, oil & gas). Discover key trends, leading companies, and regional insights in this comprehensive market analysis.

August 2025
Base Year: 2024
No Of Pages: 234
Price: $4750

North America Anchors and Grouts Market Market Consumption Trends: Growth Analysis 2025-2033

Discover the booming North America anchors and grouts market, projected to reach significant value by 2033. This comprehensive analysis reveals key drivers, trends, and restraints shaping this dynamic industry. Explore market segmentation, leading companies, and regional insights.

August 2025
Base Year: 2024
No Of Pages: 234
Price: $4750

Strategic Trends in Quartz Crystal Industry Market 2025-2033

Discover the booming quartz crystal market! Explore a $7.31 billion industry with a 4.19% CAGR, driven by electronics, solar, and construction. Learn about key players, regional trends, and future growth projections in this comprehensive market analysis.

August 2025
Base Year: 2024
No Of Pages: 150
Price: $4750

Latin America Paints And Coatings Market in Focus: Growth Trajectories and Strategic Insights 2025-2033

Discover the booming Latin American paints and coatings market! This in-depth analysis reveals an $8.32B market in 2025, projected for >5% CAGR growth through 2033, driven by infrastructure development and a rising middle class. Explore key trends, segments (acrylics, water-borne, architectural), and leading companies.

August 2025
Base Year: 2024
No Of Pages: 180
Price: $4750

Glyoxal Industry Analysis Report 2025: Market to Grow by a CAGR of XX to 2033, Driven by Government Incentives, Popularity of Virtual Assistants, and Strategic Partnerships

Discover the booming glyoxal market! This comprehensive analysis reveals a $308.12 million market in 2025, projected to grow at a 5.8% CAGR through 2033, driven by adhesives, textiles, and resins. Explore key trends, restraints, regional insights, and leading companies shaping this dynamic industry.

August 2025
Base Year: 2024
No Of Pages: 180
Price: $4750

Malaysia Architectural Coatings Market Market Disruption: Competitor Insights and Trends 2025-2033

Discover the booming Malaysian architectural coatings market! This in-depth analysis reveals a CAGR exceeding 4%, driven by construction growth and demand for eco-friendly waterborne paints. Learn about key players, market segments (residential, commercial, resin types), and future trends impacting this RM 2 billion market.

August 2025
Base Year: 2024
No Of Pages: 180
Price: $3800

Europe Biochar Market Analysis 2025-2033: Unlocking Competitive Opportunities

The European biochar market is booming, with a projected CAGR of 24.03% (2019-2025). Discover key drivers, trends, and leading companies shaping this sustainable industry. Explore market size, segmentation, and regional analysis for informed investment decisions. Learn more about the environmental benefits and applications of biochar in agriculture, carbon sequestration, and more.

August 2025
Base Year: 2024
No Of Pages: 234
Price: $4750

Hydroxypropionic Acid Industry in Emerging Markets: Analysis and Projections 2025-2033

The Hydroxypropionic Acid market is booming, projected to reach [estimated 2033 value based on CAGR] by 2033, driven by strong demand in paints & coatings, polymers, and adhesives. Explore market trends, key players (Novozymes, Sigma-Aldrich, etc.), and regional growth forecasts in this comprehensive analysis.

August 2025
Base Year: 2024
No Of Pages: 180
Price: $4750
  • Home
  • About Us
  • Industries
    • Aerospace & Defense
    • Agriculture
    • Animal Nutrition & Wellness
    • Automotive
    • Chemicals & Materials
    • Consumer Goods and Services
    • Energy & Power
    • Financial Services and Investment Intelligence
    • Food & Beverage
    • Home and Property Improvement
    • Hospitality and Tourism
    • Logistics
    • Manufacturing Products and Services
    • Packaging
    • Professional and Commercial Services
    • Real Estate and Construction
    • Retail
    • Technology, Media and Telecom
    • Healthcare
  • Services
  • Contact
Main Logo
  • Home
  • About Us
  • Industries
    • Aerospace & Defense
    • Agriculture
    • Animal Nutrition & Wellness
    • Automotive
    • Chemicals & Materials
    • Consumer Goods and Services
    • Energy & Power
    • Financial Services and Investment Intelligence
    • Food & Beverage
    • Home and Property Improvement
    • Hospitality and Tourism
    • Logistics
    • Manufacturing Products and Services
    • Packaging
    • Professional and Commercial Services
    • Real Estate and Construction
    • Retail
    • Technology, Media and Telecom
    • Healthcare
  • Services
  • Contact
+17162654855
[email protected]

+17162654855

[email protected]

Business Address

Head Office

Ansec House 3 rd floor Tank Road, Yerwada, Pune, Maharashtra 411014

Contact Information

Craig Francis

Business Development Head

+17162654855

[email protected]

Secure Payment Partners

payment image
RetailLogisticsPackagingAutomotiveHealthcareAgricultureEnergy & PowerFood & BeverageAerospace & DefenseChemicals & MaterialsHospitality and TourismAnimal Nutrition & WellnessConsumer Goods and ServicesReal Estate and ConstructionHome and Property ImprovementTechnology, Media and TelecomManufacturing Products and ServicesFinancial Services and Investment Intelligence

© 2025 PRDUA Research & Media Private Limited, All rights reserved

Privacy Policy
Terms and Conditions
FAQ