

Key Insights
The global Guar Gum market is poised for substantial growth, projected to reach an estimated $3098 million by 2025, with a robust Compound Annual Growth Rate (CAGR) of 4.3% during the forecast period of 2025-2033. This expansion is fueled by the versatile applications of guar gum across a multitude of industries, driven by its unique properties as a thickener, stabilizer, emulsifier, and binder. The food industry remains a dominant consumer, leveraging guar gum for its ability to improve texture, mouthfeel, and shelf-life in products ranging from dairy and bakery to sauces and beverages. Emerging applications in oil and gas, particularly in hydraulic fracturing, and its increasing use in pharmaceuticals, cosmetics, and personal care products are also significant growth catalysts. The demand for natural and sustainable ingredients further bolsters the market, as guar gum is derived from the guar bean, a renewable resource.
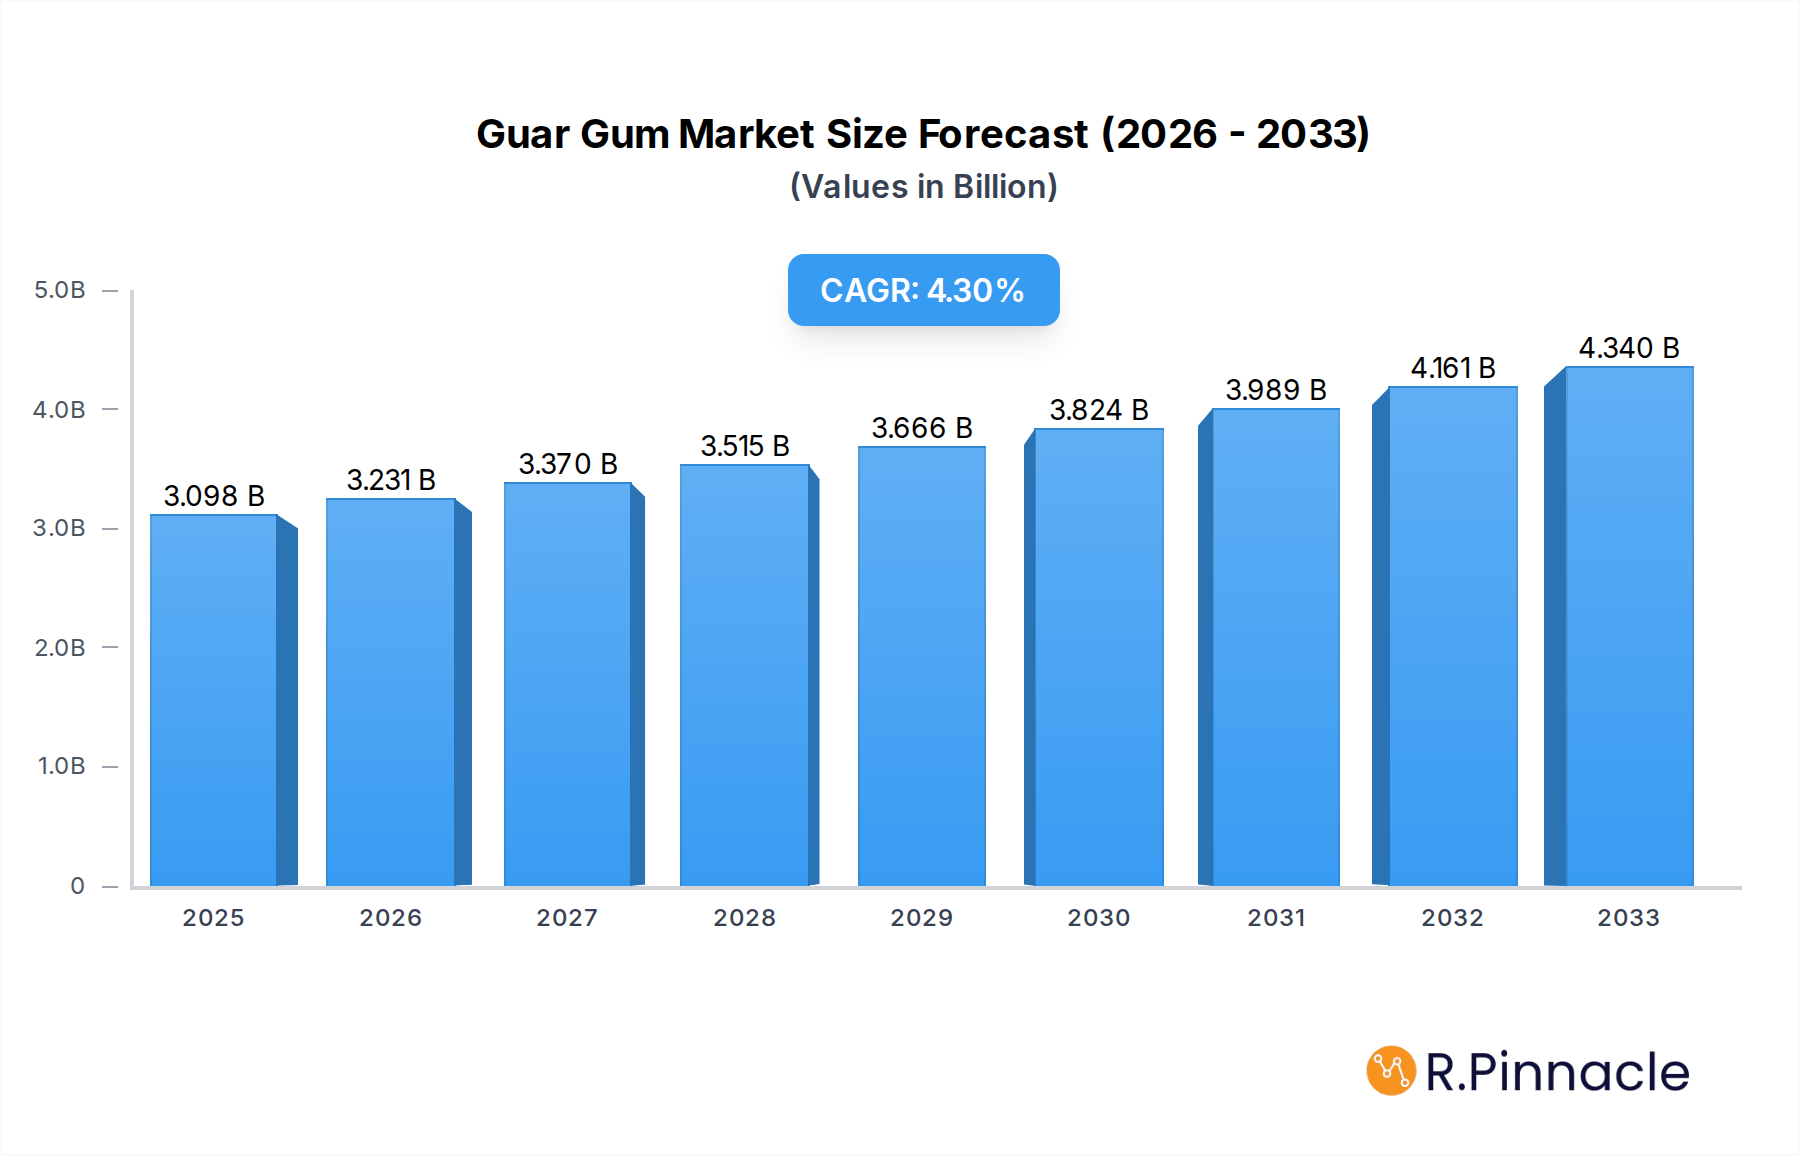
Guar Gum Market Size (In Billion)
The market's upward trajectory is further supported by ongoing advancements in processing technologies, leading to the development of specialized guar gum derivatives with enhanced functionalities tailored for specific industrial needs. North America and Asia Pacific are anticipated to be key growth regions, driven by strong industrial bases and burgeoning consumer markets. While the market enjoys a positive outlook, potential challenges such as price volatility due to crop yields and geopolitical factors, coupled with the development of synthetic alternatives in some applications, warrant close monitoring. However, the inherent benefits of guar gum, including its cost-effectiveness and environmental profile, are expected to sustain its market dominance. Key players are focusing on strategic collaborations, capacity expansions, and product innovation to capitalize on these growth opportunities and maintain a competitive edge in this dynamic market.

Guar Gum Company Market Share
Unlocking the Potential: A Comprehensive Analysis of the Global Guar Gum Market (2019–2033)
Gain unparalleled insights into the dynamic global guar gum market with this definitive report. Covering the historical period of 2019–2024, the base year of 2025, and an extensive forecast period through 2033, this analysis delves into market structure, dynamics, regional dominance, and future potential. Discover key innovation trends, growth drivers, challenges, and emerging opportunities shaping this vital industry.
Guar Gum Market Structure & Innovation Trends
The global guar gum market exhibits a moderate to high concentration, with leading players such as Hindustan Gum, Vikas WSP, and Sunita Hydrocolloids holding significant market share, estimated to be over 20% collectively. Innovation drivers are primarily centered around enhancing product functionality, developing specialized grades for niche applications, and improving extraction and processing efficiency to reduce costs and environmental impact. Regulatory frameworks, particularly for food-grade guar gum, are stringent, emphasizing safety and quality standards. Product substitutes, including xanthan gum and cellulose derivatives, present a competitive challenge, necessitating continuous innovation and cost-effectiveness. End-user demographics are diverse, ranging from large food and beverage manufacturers to oil and gas exploration companies. Mergers and acquisitions (M&A) activities are sporadic but strategically important for expanding product portfolios and market reach, with estimated deal values in the tens of millions of dollars. Key M&A activities focus on integrating upstream raw material sourcing or acquiring advanced processing technologies.
- Market Concentration: Moderate to High
- Key Innovation Drivers: Enhanced functionality, specialized grades, processing efficiency, sustainability
- Regulatory Influence: Stringent for food-grade applications
- Competitive Substitutes: Xanthan gum, cellulose derivatives
- M&A Focus: Portfolio expansion, technology acquisition
- Estimated M&A Deal Value Range: Millions of USD
Guar Gum Market Dynamics & Trends
The global guar gum market is poised for robust growth, driven by increasing demand across its diverse applications. The food industry remains a primary consumer, leveraging guar gum’s exceptional thickening, stabilizing, and emulsifying properties in a wide array of products, from baked goods and dairy to sauces and dressings. The projected Compound Annual Growth Rate (CAGR) for the food segment is estimated at 5.5%. Beyond food, the oil and gas sector is a significant driver, particularly in hydraulic fracturing operations, where guar gum derivatives are crucial for viscosity control and proppant transport. Despite fluctuations in oil prices, the essential nature of guar gum in efficient extraction continues to fuel demand, with an estimated market penetration of over 70% in this sector for relevant applications. The paper and textile industries also utilize guar gum for sizing and finishing, contributing to improved paper strength and fabric feel. Emerging applications in daily chemicals and personal care are also gaining traction, with guar gum’s moisturizing and thickening capabilities finding use in cosmetics, shampoos, and lotions. Technological disruptions, such as advancements in guar gum processing to create more refined and functional grades, are enhancing its market appeal. Consumer preferences are increasingly leaning towards natural and plant-based ingredients, a trend that strongly favors guar gum. Competitive dynamics are characterized by a mix of large, established players and smaller, specialized manufacturers, leading to price sensitivity and a focus on product differentiation. The overall market penetration for guar gum is estimated to be over 60% across all its major applications, with a projected CAGR of approximately 5.2% for the forecast period.
Dominant Regions & Segments in Guar Gum
The Food Industry segment is a dominant force within the global guar gum market, projected to continue its lead throughout the forecast period. This dominance is fueled by evolving consumer lifestyles, a rising global population, and an increasing demand for processed and convenience foods that rely on guar gum for texture, stability, and shelf-life extension. Key drivers for this segment’s strength include the growing middle class in emerging economies, a surge in demand for gluten-free and plant-based food alternatives, and stricter regulations in developed markets that necessitate high-quality food additives. India, as the world's largest producer of guar beans, plays a pivotal role in supplying the raw material for this segment, significantly influencing global prices and availability.
Within the broader guar gum market, the Industrial Grade type commands a substantial share, primarily driven by its extensive use in the oil and gas sector. The demand for industrial-grade guar gum is intricately linked to exploration and production activities worldwide. While renewable energy sources are gaining traction, conventional energy sources still require significant investment, ensuring continued demand for guar gum in hydraulic fracturing and other drilling applications. Economic policies that encourage energy exploration, coupled with advancements in extraction technologies that necessitate higher-performing viscosifiers, are key growth enablers. The estimated market size for industrial-grade guar gum is in the range of 1.5 million tons annually.
The Food Industry segment's dominance is further reinforced by its consistent growth trajectory and high value addition. The increasing focus on product innovation within the food sector, including the development of specialized guar gum formulations for specific culinary applications, is a testament to its ongoing importance. This segment is projected to account for over 40% of the total global guar gum market value by 2033.
The Oil and Chemical segment, while subject to market volatility in commodity prices, remains a critical consumer. Its significance is amplified by its use in enhanced oil recovery (EOR) techniques, which are becoming increasingly important as conventional reserves deplete. Infrastructure development and technological advancements in extraction processes are directly proportional to the demand for industrial-grade guar gum.
In terms of regional dominance, Asia Pacific, particularly India, is the epicenter of guar gum production and a major consumer due to its burgeoning food processing industry and significant agricultural sector. However, North America, driven by its extensive oil and gas reserves and sophisticated food industry, also represents a substantial market.
Guar Gum Product Innovations
Guar gum product innovations are focused on enhancing its functional properties for diverse applications. Developments include the creation of highly purified food-grade guar gums with superior viscosity and clarity, catering to premium food products. Modified guar gums with improved solubility, heat stability, and shear resistance are being engineered for the demanding oil and gas sector. Innovations also extend to developing specialty grades for the paper industry, improving paper strength and printability, and for the personal care sector, offering enhanced moisturizing and thickening benefits. Competitive advantages are being gained through advanced processing techniques that yield higher purity and specific rheological profiles, meeting evolving industry demands and creating value-added solutions.
Report Scope & Segmentation Analysis
This report provides a granular analysis of the global guar gum market, segmented by Application and Type. The Food Industry segment is projected to witness a CAGR of approximately 5.5% and is expected to hold a market share of over 40% by 2033, driven by convenience food growth and demand for natural thickeners. The Oil and Chemical segment, while experiencing some volatility, is estimated to maintain a significant market share of over 25%, with an anticipated CAGR of 4.8%, bolstered by exploration activities. The Paper and Textile segment is expected to grow at a CAGR of around 4.0%, contributing to market diversification. The Daily Chemicals and Personal Care segment, though smaller, is projected to exhibit the highest growth rate at approximately 6.5% CAGR, reflecting rising consumer demand for natural ingredients. The Other applications segment is expected to grow at a CAGR of 4.5%.
By Type, Industrial Grade guar gum is expected to account for the largest market share, around 50%, with a CAGR of 5.0%, driven by its extensive use in oilfield services. Food Grade guar gum, with its expanding applications in processed foods and beverages, is projected to grow at a CAGR of 5.5%, capturing a market share of approximately 40%. Others types are expected to grow at a CAGR of 4.0%.
Key Drivers of Guar Gum Growth
Several key factors are driving the growth of the global guar gum market. Technologically, advancements in processing techniques allow for the production of specialized guar gum derivatives with tailored functionalities, meeting the precise needs of various industries. Economically, the increasing global population and the subsequent rise in demand for processed foods and beverages are significant growth accelerators. The expanding middle class in emerging economies further fuels this demand. Regulatory factors, particularly the growing consumer preference for natural and plant-based ingredients in food and personal care products, also favor guar gum, which is perceived as a natural thickener and stabilizer. The sustained demand from the oil and gas industry for efficient hydraulic fracturing fluids continues to be a major economic driver.
- Technological Advancements: Enhanced processing for specialized functionalities.
- Economic Growth: Rising global population and middle class.
- Consumer Preference for Natural Ingredients: Favorable perception in food and personal care.
- Oil and Gas Sector Demand: Continued need for hydraulic fracturing fluids.
Challenges in the Guar Gum Sector
The guar gum sector faces several challenges that could impede its growth. Regulatory hurdles, particularly concerning the approval and standardization of new guar gum derivatives for specific food applications in various regions, can slow down market penetration. Supply chain issues, including the dependence on agricultural output subject to weather conditions and geopolitical factors impacting trade routes, can lead to price volatility and availability concerns. Competitive pressures from established and emerging substitutes like xanthan gum and synthetic polymers, offering similar functionalities at competitive prices, pose a constant threat. Furthermore, the environmental impact associated with water usage in guar cultivation and processing is an increasing concern that necessitates sustainable practices. The estimated impact of these challenges could lead to a 5-10% slowdown in projected growth rates if not effectively managed.
- Regulatory Approvals: Slowdown in new product introductions.
- Supply Chain Volatility: Price fluctuations and availability concerns.
- Substitute Competition: Price wars and market share erosion.
- Environmental Sustainability: Water usage and processing footprint.
Emerging Opportunities in Guar Gum
Emerging opportunities in the guar gum market are diverse and promising. The increasing demand for plant-based and clean-label ingredients across food, beverage, and personal care industries presents a significant avenue for growth, as guar gum aligns perfectly with these consumer preferences. Innovations in bio-based polymers and bioplastics are creating new applications for guar gum as a sustainable additive. The pharmaceutical industry is exploring guar gum's potential in drug delivery systems and as an excipient due to its biocompatibility and gelling properties. Furthermore, advancements in food technology, such as the development of novel food structures and textures, offer opportunities for customized guar gum solutions. The growing focus on sustainable agriculture and resource management also opens avenues for developing more efficient and environmentally friendly guar cultivation and processing methods.
- Plant-Based & Clean-Label Demand: Growing market for natural ingredients.
- Bioplastics and Bio-polymers: Sustainable additive opportunities.
- Pharmaceutical Applications: Drug delivery and excipient potential.
- Food Technology Advancements: Novel food structure applications.
Leading Players in the Guar Gum Market
- Hindustan Gum
- Neelkanth Polymers
- Vikas WSP
- Sunita Hydrocolloids
- Lotus
- Shree Ram
- Jai Bharat
- Rama Industries
- Adarsh Group
- Pakistan Gum & Chemicals
- Global Gums & Chemicals
- Supreme Gums
- Raj Gums (Rajasthan Gum Industries)
- Jingkun Chemistry Company
- Guangrao Liuhe Chemical
- Wuxi Jinxin
- Shandong Dongda Commerce
Key Developments in Guar Gum Industry
- 2023: Launch of specialized food-grade guar gum variants with enhanced cold-water solubility, improving ease of use for manufacturers.
- 2023: Significant investment in R&D for bio-based guar gum derivatives with improved biodegradability.
- 2022: Major Indian producer announces expansion of production capacity to meet growing global demand, estimated at over 50 million USD.
- 2022: A key player in the oilfield services sector reports increased utilization of guar gum in unconventional resource extraction.
- 2021: Introduction of modified guar gums with superior shear stability for advanced industrial applications.
- 2020: Several companies focus on sustainable sourcing and processing of guar beans, responding to environmental concerns.
- 2019: Merger between two mid-sized players to create a stronger entity with a broader product portfolio, valued in the tens of millions of USD.
Future Outlook for Guar Gum Market
The future outlook for the global guar gum market remains highly positive, driven by persistent demand from its core applications and the emergence of new growth avenues. The increasing global emphasis on natural, sustainable, and plant-based ingredients will continue to fuel demand in the food, beverage, and personal care sectors. Advancements in processing technologies will enable the development of higher-value, specialized guar gum products catering to niche markets and complex industrial requirements. The oil and gas sector's reliance on guar gum for efficient extraction, coupled with potential applications in enhanced oil recovery, will provide a stable demand base. Strategic investments in research and development, sustainable sourcing practices, and market expansion in emerging economies will be crucial for players to capitalize on the projected growth and navigate the evolving competitive landscape, leading to an estimated market valuation in the billions of USD by 2033.
Guar Gum Segmentation
-
1. Application
- 1.1. Food Industry
- 1.2. Oil and Chemical
- 1.3. Paper and Textile
- 1.4. Daily Chemicals and Personal Care
- 1.5. Other
-
2. Types
- 2.1. Industrial Grade
- 2.2. Food Grade
- 2.3. Others
Guar Gum Segmentation By Geography
-
1. North America
- 1.1. United States
- 1.2. Canada
- 1.3. Mexico
-
2. South America
- 2.1. Brazil
- 2.2. Argentina
- 2.3. Rest of South America
-
3. Europe
- 3.1. United Kingdom
- 3.2. Germany
- 3.3. France
- 3.4. Italy
- 3.5. Spain
- 3.6. Russia
- 3.7. Benelux
- 3.8. Nordics
- 3.9. Rest of Europe
-
4. Middle East & Africa
- 4.1. Turkey
- 4.2. Israel
- 4.3. GCC
- 4.4. North Africa
- 4.5. South Africa
- 4.6. Rest of Middle East & Africa
-
5. Asia Pacific
- 5.1. China
- 5.2. India
- 5.3. Japan
- 5.4. South Korea
- 5.5. ASEAN
- 5.6. Oceania
- 5.7. Rest of Asia Pacific
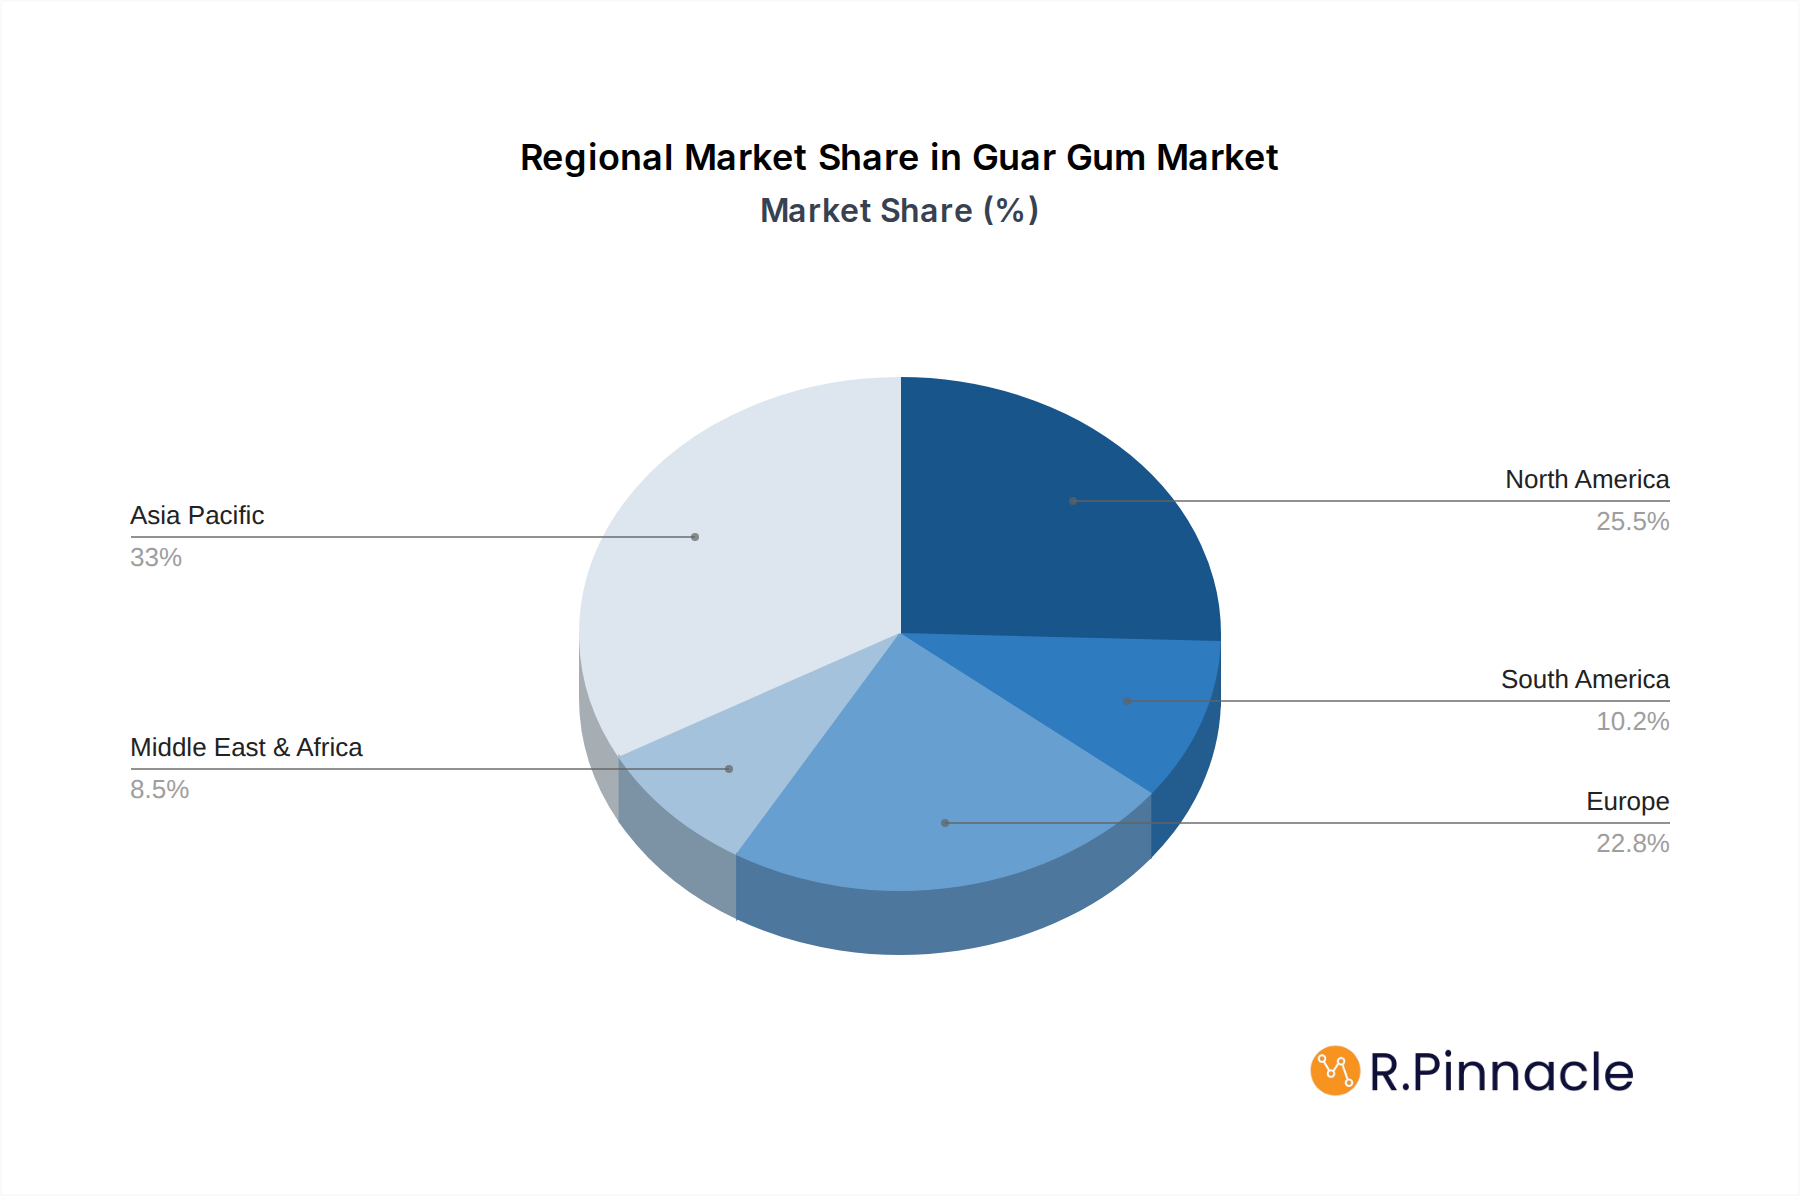
Guar Gum Regional Market Share
Geographic Coverage of Guar Gum
Guar Gum REPORT HIGHLIGHTS
| Aspects | Details |
|---|---|
| Study Period | 2020-2034 |
| Base Year | 2025 |
| Estimated Year | 2026 |
| Forecast Period | 2026-2034 |
| Historical Period | 2020-2025 |
| Growth Rate | CAGR of 4.3% from 2020-2034 |
| Segmentation |
|
Table of Contents
- 1. Introduction
- 1.1. Research Scope
- 1.2. Market Segmentation
- 1.3. Research Methodology
- 1.4. Definitions and Assumptions
- 2. Executive Summary
- 2.1. Introduction
- 3. Market Dynamics
- 3.1. Introduction
- 3.2. Market Drivers
- 3.3. Market Restrains
- 3.4. Market Trends
- 4. Market Factor Analysis
- 4.1. Porters Five Forces
- 4.2. Supply/Value Chain
- 4.3. PESTEL analysis
- 4.4. Market Entropy
- 4.5. Patent/Trademark Analysis
- 5. Global Guar Gum Analysis, Insights and Forecast, 2020-2032
- 5.1. Market Analysis, Insights and Forecast - by Application
- 5.1.1. Food Industry
- 5.1.2. Oil and Chemical
- 5.1.3. Paper and Textile
- 5.1.4. Daily Chemicals and Personal Care
- 5.1.5. Other
- 5.2. Market Analysis, Insights and Forecast - by Types
- 5.2.1. Industrial Grade
- 5.2.2. Food Grade
- 5.2.3. Others
- 5.3. Market Analysis, Insights and Forecast - by Region
- 5.3.1. North America
- 5.3.2. South America
- 5.3.3. Europe
- 5.3.4. Middle East & Africa
- 5.3.5. Asia Pacific
- 5.1. Market Analysis, Insights and Forecast - by Application
- 6. North America Guar Gum Analysis, Insights and Forecast, 2020-2032
- 6.1. Market Analysis, Insights and Forecast - by Application
- 6.1.1. Food Industry
- 6.1.2. Oil and Chemical
- 6.1.3. Paper and Textile
- 6.1.4. Daily Chemicals and Personal Care
- 6.1.5. Other
- 6.2. Market Analysis, Insights and Forecast - by Types
- 6.2.1. Industrial Grade
- 6.2.2. Food Grade
- 6.2.3. Others
- 6.1. Market Analysis, Insights and Forecast - by Application
- 7. South America Guar Gum Analysis, Insights and Forecast, 2020-2032
- 7.1. Market Analysis, Insights and Forecast - by Application
- 7.1.1. Food Industry
- 7.1.2. Oil and Chemical
- 7.1.3. Paper and Textile
- 7.1.4. Daily Chemicals and Personal Care
- 7.1.5. Other
- 7.2. Market Analysis, Insights and Forecast - by Types
- 7.2.1. Industrial Grade
- 7.2.2. Food Grade
- 7.2.3. Others
- 7.1. Market Analysis, Insights and Forecast - by Application
- 8. Europe Guar Gum Analysis, Insights and Forecast, 2020-2032
- 8.1. Market Analysis, Insights and Forecast - by Application
- 8.1.1. Food Industry
- 8.1.2. Oil and Chemical
- 8.1.3. Paper and Textile
- 8.1.4. Daily Chemicals and Personal Care
- 8.1.5. Other
- 8.2. Market Analysis, Insights and Forecast - by Types
- 8.2.1. Industrial Grade
- 8.2.2. Food Grade
- 8.2.3. Others
- 8.1. Market Analysis, Insights and Forecast - by Application
- 9. Middle East & Africa Guar Gum Analysis, Insights and Forecast, 2020-2032
- 9.1. Market Analysis, Insights and Forecast - by Application
- 9.1.1. Food Industry
- 9.1.2. Oil and Chemical
- 9.1.3. Paper and Textile
- 9.1.4. Daily Chemicals and Personal Care
- 9.1.5. Other
- 9.2. Market Analysis, Insights and Forecast - by Types
- 9.2.1. Industrial Grade
- 9.2.2. Food Grade
- 9.2.3. Others
- 9.1. Market Analysis, Insights and Forecast - by Application
- 10. Asia Pacific Guar Gum Analysis, Insights and Forecast, 2020-2032
- 10.1. Market Analysis, Insights and Forecast - by Application
- 10.1.1. Food Industry
- 10.1.2. Oil and Chemical
- 10.1.3. Paper and Textile
- 10.1.4. Daily Chemicals and Personal Care
- 10.1.5. Other
- 10.2. Market Analysis, Insights and Forecast - by Types
- 10.2.1. Industrial Grade
- 10.2.2. Food Grade
- 10.2.3. Others
- 10.1. Market Analysis, Insights and Forecast - by Application
- 11. Competitive Analysis
- 11.1. Global Market Share Analysis 2025
- 11.2. Company Profiles
- 11.2.1 Hindustan Gum
- 11.2.1.1. Overview
- 11.2.1.2. Products
- 11.2.1.3. SWOT Analysis
- 11.2.1.4. Recent Developments
- 11.2.1.5. Financials (Based on Availability)
- 11.2.2 Neelkanth Polymers
- 11.2.2.1. Overview
- 11.2.2.2. Products
- 11.2.2.3. SWOT Analysis
- 11.2.2.4. Recent Developments
- 11.2.2.5. Financials (Based on Availability)
- 11.2.3 Vikas WSP
- 11.2.3.1. Overview
- 11.2.3.2. Products
- 11.2.3.3. SWOT Analysis
- 11.2.3.4. Recent Developments
- 11.2.3.5. Financials (Based on Availability)
- 11.2.4 Sunita Hydrocolloids
- 11.2.4.1. Overview
- 11.2.4.2. Products
- 11.2.4.3. SWOT Analysis
- 11.2.4.4. Recent Developments
- 11.2.4.5. Financials (Based on Availability)
- 11.2.5 Lotus
- 11.2.5.1. Overview
- 11.2.5.2. Products
- 11.2.5.3. SWOT Analysis
- 11.2.5.4. Recent Developments
- 11.2.5.5. Financials (Based on Availability)
- 11.2.6 Shree Ram
- 11.2.6.1. Overview
- 11.2.6.2. Products
- 11.2.6.3. SWOT Analysis
- 11.2.6.4. Recent Developments
- 11.2.6.5. Financials (Based on Availability)
- 11.2.7 Jai Bharat
- 11.2.7.1. Overview
- 11.2.7.2. Products
- 11.2.7.3. SWOT Analysis
- 11.2.7.4. Recent Developments
- 11.2.7.5. Financials (Based on Availability)
- 11.2.8 Rama Industries
- 11.2.8.1. Overview
- 11.2.8.2. Products
- 11.2.8.3. SWOT Analysis
- 11.2.8.4. Recent Developments
- 11.2.8.5. Financials (Based on Availability)
- 11.2.9 Adarsh Group
- 11.2.9.1. Overview
- 11.2.9.2. Products
- 11.2.9.3. SWOT Analysis
- 11.2.9.4. Recent Developments
- 11.2.9.5. Financials (Based on Availability)
- 11.2.10 Pakistan Gum & Chemicals
- 11.2.10.1. Overview
- 11.2.10.2. Products
- 11.2.10.3. SWOT Analysis
- 11.2.10.4. Recent Developments
- 11.2.10.5. Financials (Based on Availability)
- 11.2.11 Global Gums & Chemicals
- 11.2.11.1. Overview
- 11.2.11.2. Products
- 11.2.11.3. SWOT Analysis
- 11.2.11.4. Recent Developments
- 11.2.11.5. Financials (Based on Availability)
- 11.2.12 Supreme Gums
- 11.2.12.1. Overview
- 11.2.12.2. Products
- 11.2.12.3. SWOT Analysis
- 11.2.12.4. Recent Developments
- 11.2.12.5. Financials (Based on Availability)
- 11.2.13 Raj Gums (Rajasthan Gum Industries)
- 11.2.13.1. Overview
- 11.2.13.2. Products
- 11.2.13.3. SWOT Analysis
- 11.2.13.4. Recent Developments
- 11.2.13.5. Financials (Based on Availability)
- 11.2.14 Jingkun Chemistry Company
- 11.2.14.1. Overview
- 11.2.14.2. Products
- 11.2.14.3. SWOT Analysis
- 11.2.14.4. Recent Developments
- 11.2.14.5. Financials (Based on Availability)
- 11.2.15 Guangrao Liuhe Chemical
- 11.2.15.1. Overview
- 11.2.15.2. Products
- 11.2.15.3. SWOT Analysis
- 11.2.15.4. Recent Developments
- 11.2.15.5. Financials (Based on Availability)
- 11.2.16 Wuxi Jinxin
- 11.2.16.1. Overview
- 11.2.16.2. Products
- 11.2.16.3. SWOT Analysis
- 11.2.16.4. Recent Developments
- 11.2.16.5. Financials (Based on Availability)
- 11.2.17 Shandong Dongda Commerce
- 11.2.17.1. Overview
- 11.2.17.2. Products
- 11.2.17.3. SWOT Analysis
- 11.2.17.4. Recent Developments
- 11.2.17.5. Financials (Based on Availability)
- 11.2.1 Hindustan Gum
List of Figures
- Figure 1: Global Guar Gum Revenue Breakdown (million, %) by Region 2025 & 2033
- Figure 2: North America Guar Gum Revenue (million), by Application 2025 & 2033
- Figure 3: North America Guar Gum Revenue Share (%), by Application 2025 & 2033
- Figure 4: North America Guar Gum Revenue (million), by Types 2025 & 2033
- Figure 5: North America Guar Gum Revenue Share (%), by Types 2025 & 2033
- Figure 6: North America Guar Gum Revenue (million), by Country 2025 & 2033
- Figure 7: North America Guar Gum Revenue Share (%), by Country 2025 & 2033
- Figure 8: South America Guar Gum Revenue (million), by Application 2025 & 2033
- Figure 9: South America Guar Gum Revenue Share (%), by Application 2025 & 2033
- Figure 10: South America Guar Gum Revenue (million), by Types 2025 & 2033
- Figure 11: South America Guar Gum Revenue Share (%), by Types 2025 & 2033
- Figure 12: South America Guar Gum Revenue (million), by Country 2025 & 2033
- Figure 13: South America Guar Gum Revenue Share (%), by Country 2025 & 2033
- Figure 14: Europe Guar Gum Revenue (million), by Application 2025 & 2033
- Figure 15: Europe Guar Gum Revenue Share (%), by Application 2025 & 2033
- Figure 16: Europe Guar Gum Revenue (million), by Types 2025 & 2033
- Figure 17: Europe Guar Gum Revenue Share (%), by Types 2025 & 2033
- Figure 18: Europe Guar Gum Revenue (million), by Country 2025 & 2033
- Figure 19: Europe Guar Gum Revenue Share (%), by Country 2025 & 2033
- Figure 20: Middle East & Africa Guar Gum Revenue (million), by Application 2025 & 2033
- Figure 21: Middle East & Africa Guar Gum Revenue Share (%), by Application 2025 & 2033
- Figure 22: Middle East & Africa Guar Gum Revenue (million), by Types 2025 & 2033
- Figure 23: Middle East & Africa Guar Gum Revenue Share (%), by Types 2025 & 2033
- Figure 24: Middle East & Africa Guar Gum Revenue (million), by Country 2025 & 2033
- Figure 25: Middle East & Africa Guar Gum Revenue Share (%), by Country 2025 & 2033
- Figure 26: Asia Pacific Guar Gum Revenue (million), by Application 2025 & 2033
- Figure 27: Asia Pacific Guar Gum Revenue Share (%), by Application 2025 & 2033
- Figure 28: Asia Pacific Guar Gum Revenue (million), by Types 2025 & 2033
- Figure 29: Asia Pacific Guar Gum Revenue Share (%), by Types 2025 & 2033
- Figure 30: Asia Pacific Guar Gum Revenue (million), by Country 2025 & 2033
- Figure 31: Asia Pacific Guar Gum Revenue Share (%), by Country 2025 & 2033
List of Tables
- Table 1: Global Guar Gum Revenue million Forecast, by Application 2020 & 2033
- Table 2: Global Guar Gum Revenue million Forecast, by Types 2020 & 2033
- Table 3: Global Guar Gum Revenue million Forecast, by Region 2020 & 2033
- Table 4: Global Guar Gum Revenue million Forecast, by Application 2020 & 2033
- Table 5: Global Guar Gum Revenue million Forecast, by Types 2020 & 2033
- Table 6: Global Guar Gum Revenue million Forecast, by Country 2020 & 2033
- Table 7: United States Guar Gum Revenue (million) Forecast, by Application 2020 & 2033
- Table 8: Canada Guar Gum Revenue (million) Forecast, by Application 2020 & 2033
- Table 9: Mexico Guar Gum Revenue (million) Forecast, by Application 2020 & 2033
- Table 10: Global Guar Gum Revenue million Forecast, by Application 2020 & 2033
- Table 11: Global Guar Gum Revenue million Forecast, by Types 2020 & 2033
- Table 12: Global Guar Gum Revenue million Forecast, by Country 2020 & 2033
- Table 13: Brazil Guar Gum Revenue (million) Forecast, by Application 2020 & 2033
- Table 14: Argentina Guar Gum Revenue (million) Forecast, by Application 2020 & 2033
- Table 15: Rest of South America Guar Gum Revenue (million) Forecast, by Application 2020 & 2033
- Table 16: Global Guar Gum Revenue million Forecast, by Application 2020 & 2033
- Table 17: Global Guar Gum Revenue million Forecast, by Types 2020 & 2033
- Table 18: Global Guar Gum Revenue million Forecast, by Country 2020 & 2033
- Table 19: United Kingdom Guar Gum Revenue (million) Forecast, by Application 2020 & 2033
- Table 20: Germany Guar Gum Revenue (million) Forecast, by Application 2020 & 2033
- Table 21: France Guar Gum Revenue (million) Forecast, by Application 2020 & 2033
- Table 22: Italy Guar Gum Revenue (million) Forecast, by Application 2020 & 2033
- Table 23: Spain Guar Gum Revenue (million) Forecast, by Application 2020 & 2033
- Table 24: Russia Guar Gum Revenue (million) Forecast, by Application 2020 & 2033
- Table 25: Benelux Guar Gum Revenue (million) Forecast, by Application 2020 & 2033
- Table 26: Nordics Guar Gum Revenue (million) Forecast, by Application 2020 & 2033
- Table 27: Rest of Europe Guar Gum Revenue (million) Forecast, by Application 2020 & 2033
- Table 28: Global Guar Gum Revenue million Forecast, by Application 2020 & 2033
- Table 29: Global Guar Gum Revenue million Forecast, by Types 2020 & 2033
- Table 30: Global Guar Gum Revenue million Forecast, by Country 2020 & 2033
- Table 31: Turkey Guar Gum Revenue (million) Forecast, by Application 2020 & 2033
- Table 32: Israel Guar Gum Revenue (million) Forecast, by Application 2020 & 2033
- Table 33: GCC Guar Gum Revenue (million) Forecast, by Application 2020 & 2033
- Table 34: North Africa Guar Gum Revenue (million) Forecast, by Application 2020 & 2033
- Table 35: South Africa Guar Gum Revenue (million) Forecast, by Application 2020 & 2033
- Table 36: Rest of Middle East & Africa Guar Gum Revenue (million) Forecast, by Application 2020 & 2033
- Table 37: Global Guar Gum Revenue million Forecast, by Application 2020 & 2033
- Table 38: Global Guar Gum Revenue million Forecast, by Types 2020 & 2033
- Table 39: Global Guar Gum Revenue million Forecast, by Country 2020 & 2033
- Table 40: China Guar Gum Revenue (million) Forecast, by Application 2020 & 2033
- Table 41: India Guar Gum Revenue (million) Forecast, by Application 2020 & 2033
- Table 42: Japan Guar Gum Revenue (million) Forecast, by Application 2020 & 2033
- Table 43: South Korea Guar Gum Revenue (million) Forecast, by Application 2020 & 2033
- Table 44: ASEAN Guar Gum Revenue (million) Forecast, by Application 2020 & 2033
- Table 45: Oceania Guar Gum Revenue (million) Forecast, by Application 2020 & 2033
- Table 46: Rest of Asia Pacific Guar Gum Revenue (million) Forecast, by Application 2020 & 2033
Frequently Asked Questions
1. What is the projected Compound Annual Growth Rate (CAGR) of the Guar Gum?
The projected CAGR is approximately 4.3%.
2. Which companies are prominent players in the Guar Gum?
Key companies in the market include Hindustan Gum, Neelkanth Polymers, Vikas WSP, Sunita Hydrocolloids, Lotus, Shree Ram, Jai Bharat, Rama Industries, Adarsh Group, Pakistan Gum & Chemicals, Global Gums & Chemicals, Supreme Gums, Raj Gums (Rajasthan Gum Industries), Jingkun Chemistry Company, Guangrao Liuhe Chemical, Wuxi Jinxin, Shandong Dongda Commerce.
3. What are the main segments of the Guar Gum?
The market segments include Application, Types.
4. Can you provide details about the market size?
The market size is estimated to be USD 3098 million as of 2022.
5. What are some drivers contributing to market growth?
N/A
6. What are the notable trends driving market growth?
N/A
7. Are there any restraints impacting market growth?
N/A
8. Can you provide examples of recent developments in the market?
N/A
9. What pricing options are available for accessing the report?
Pricing options include single-user, multi-user, and enterprise licenses priced at USD 2900.00, USD 4350.00, and USD 5800.00 respectively.
10. Is the market size provided in terms of value or volume?
The market size is provided in terms of value, measured in million.
11. Are there any specific market keywords associated with the report?
Yes, the market keyword associated with the report is "Guar Gum," which aids in identifying and referencing the specific market segment covered.
12. How do I determine which pricing option suits my needs best?
The pricing options vary based on user requirements and access needs. Individual users may opt for single-user licenses, while businesses requiring broader access may choose multi-user or enterprise licenses for cost-effective access to the report.
13. Are there any additional resources or data provided in the Guar Gum report?
While the report offers comprehensive insights, it's advisable to review the specific contents or supplementary materials provided to ascertain if additional resources or data are available.
14. How can I stay updated on further developments or reports in the Guar Gum?
To stay informed about further developments, trends, and reports in the Guar Gum, consider subscribing to industry newsletters, following relevant companies and organizations, or regularly checking reputable industry news sources and publications.
Methodology
Step 1 - Identification of Relevant Samples Size from Population Database


Step 2 - Approaches for Defining Global Market Size (Value, Volume* & Price*)

Note*: In applicable scenarios
Step 3 - Data Sources
Primary Research
- Web Analytics
- Survey Reports
- Research Institute
- Latest Research Reports
- Opinion Leaders
Secondary Research
- Annual Reports
- White Paper
- Latest Press Release
- Industry Association
- Paid Database
- Investor Presentations

Step 4 - Data Triangulation
Involves using different sources of information in order to increase the validity of a study
These sources are likely to be stakeholders in a program - participants, other researchers, program staff, other community members, and so on.
Then we put all data in single framework & apply various statistical tools to find out the dynamic on the market.
During the analysis stage, feedback from the stakeholder groups would be compared to determine areas of agreement as well as areas of divergence