

Key Insights
The Gulf of Mexico Oil & Gas Decommissioning market is poised for significant growth, fueled by aging offshore infrastructure and escalating regulatory demands for responsible decommissioning. The historical period (2019-2024) saw moderate expansion, influenced by oil price volatility and operational challenges. The forecast period (2025-2033) anticipates substantial market expansion due to a growing number of aging platforms nearing their end-of-life, increasingly stringent environmental regulations, and advancements in efficient, cost-effective decommissioning technologies. Government initiatives promoting environmental protection and sustainability will further accelerate market growth.
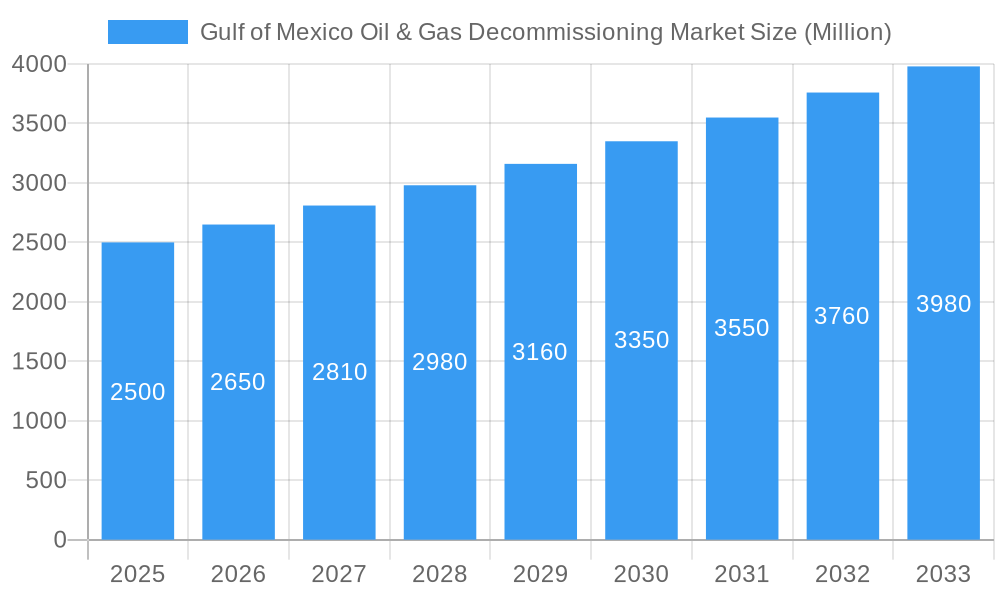
Gulf of Mexico Oil & Gas Decommissioning Market Market Size (In Billion)
The projected market size for 2025 is estimated at $11.1 billion, with a compound annual growth rate (CAGR) of 6.5% anticipated over the forecast period (2025-2033). This growth will be driven by substantial investments from major oil and gas companies in the Gulf of Mexico to ensure regulatory compliance and mitigate penalties. This demand will foster innovation and competition, leading to the development of advanced technologies and optimized processes within the decommissioning sector. Specialized contractors and subsea engineering firms will play a vital role, contributing to regional job creation and economic activity. Key influencing factors for this market's trajectory include oil price fluctuations, evolving government policies, and technological breakthroughs in decommissioning. A comprehensive service offering, encompassing well plugging and abandonment, platform removal, and site restoration, will be critical for market success.
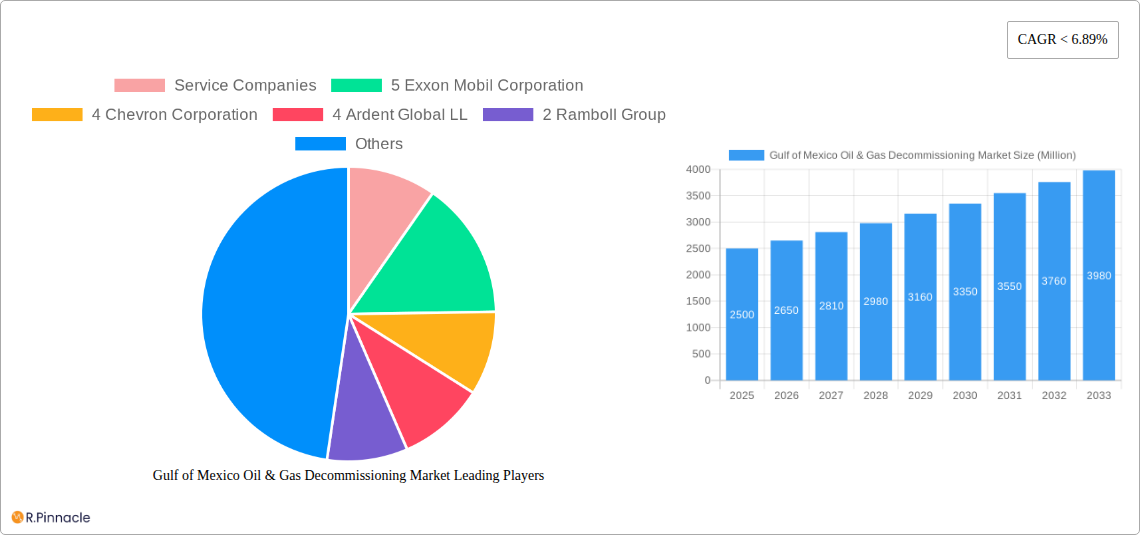
Gulf of Mexico Oil & Gas Decommissioning Market Company Market Share
Gulf of Mexico Oil & Gas Decommissioning Market Report: 2019-2033
This comprehensive report provides a detailed analysis of the Gulf of Mexico oil & gas decommissioning market, offering crucial insights for industry professionals, investors, and stakeholders. Covering the period from 2019 to 2033, with a focus on 2025, this study unveils market dynamics, competitive landscapes, and future growth opportunities. The report leverages extensive data and expert analysis to forecast market trends and identify key success factors.
Gulf of Mexico Oil & Gas Decommissioning Market Market Structure & Innovation Trends
This section analyzes the market's competitive landscape, highlighting key players and their strategies. The report examines market concentration, identifying dominant players like Exxon Mobil Corporation, Chevron Corporation, and Ardent Global LL, and assesses their market share. It also explores the role of mergers and acquisitions (M&A) in shaping the market, analyzing deal values and their impact on market dynamics. Innovation drivers, regulatory frameworks, and the presence of substitute products are also evaluated. Analysis of end-user demographics provides a granular understanding of market demand. The report estimates a total M&A deal value of approximately $XX Million during the historical period (2019-2024), with a projected $XX Million for the forecast period (2025-2033).
- Market Concentration: High, with a few major players holding significant market share.
- M&A Activity: Significant activity observed, driven by consolidation and expansion strategies.
- Innovation Drivers: Technological advancements in decommissioning technologies and environmental regulations.
- Regulatory Framework: Stringent regulations impacting decommissioning practices and costs.
Gulf of Mexico Oil & Gas Decommissioning Market Market Dynamics & Trends
This section delves into the market's growth drivers, technological disruptions, consumer preferences, and competitive dynamics. The report projects a Compound Annual Growth Rate (CAGR) of XX% during the forecast period (2025-2033), driven by factors such as increasing aging offshore infrastructure and stringent environmental regulations. Market penetration of advanced decommissioning technologies is analyzed, highlighting the adoption rates of various solutions. The impact of evolving industry best practices and operational efficiencies is also explored. The report also assesses the competitive intensity within the market, highlighting key competitive strategies employed by leading players.
Dominant Regions & Segments in Gulf of Mexico Oil & Gas Decommissioning Market
This section identifies the dominant regions and segments within the Gulf of Mexico oil & gas decommissioning market. The analysis focuses on water depth, differentiating between shallow water and deepwater operations. Key drivers for each segment are explored in detail.
Deepwater Dominance: Deepwater decommissioning projects constitute a larger market share, driven by the higher complexity and cost associated with these operations.
- Key Drivers (Deepwater):
- Higher concentration of aging deepwater assets requiring decommissioning.
- Technological advancements in deepwater decommissioning technologies.
- Stringent environmental regulations specific to deepwater operations.
Shallow Water: Although smaller than deepwater, shallow water decommissioning still represents a significant market segment, with its own unique set of challenges and opportunities.
- Key Drivers (Shallow Water):
- Higher number of aging shallow-water platforms.
- Relatively lower cost and technical complexity compared to deepwater.
- Potential for streamlined decommissioning processes.
Gulf of Mexico Oil & Gas Decommissioning Market Product Innovations
This section summarizes recent product developments and technological advancements in the decommissioning sector. Innovations in subsea decommissioning techniques, enhanced well plugging and abandonment methods, and improved waste management solutions are highlighted. The competitive advantages offered by these innovations, such as reduced environmental impact and cost-effectiveness, are discussed, focusing on their market fit and technological trends.
Report Scope & Segmentation Analysis
This report segments the Gulf of Mexico oil & gas decommissioning market primarily by water depth: Shallow Water and Deepwater. Each segment's market size, growth projections, and competitive dynamics are analyzed separately. The market size for shallow water decommissioning is estimated at $XX Million in 2025, with a projected growth to $XX Million by 2033. Deepwater decommissioning is projected to be significantly larger, with a 2025 market size of $XX Million, growing to $XX Million by 2033.
Key Drivers of Gulf of Mexico Oil & Gas Decommissioning Market Growth
The growth of the Gulf of Mexico oil & gas decommissioning market is driven by several key factors. The increasing age of offshore oil and gas infrastructure necessitates significant decommissioning activities. Furthermore, stringent environmental regulations and penalties for non-compliance are pushing operators to accelerate decommissioning projects. Technological advancements are leading to more efficient and cost-effective decommissioning solutions.
Challenges in the Gulf of Mexico Oil & Gas Decommissioning Market Sector
The Gulf of Mexico oil & gas decommissioning market faces several challenges. High decommissioning costs, complex regulatory frameworks, and potential supply chain bottlenecks are major hurdles. The environmental sensitivity of the Gulf of Mexico region adds further complexity and necessitates careful planning and execution. Competition among service providers can also impact pricing and profitability.
Emerging Opportunities in Gulf of Mexico Oil & Gas Decommissioning Market
Emerging opportunities exist in the Gulf of Mexico oil & gas decommissioning market. The development and adoption of innovative decommissioning technologies, such as robotic solutions and advanced well-plugging techniques, present significant growth potential. A focus on sustainable decommissioning practices and the circular economy can create new market segments and attract investment. Expanding into new markets and servicing decommissioning needs across different energy sectors are additional opportunities.
Leading Players in the Gulf of Mexico Oil & Gas Decommissioning Market Market
- Exxon Mobil Corporation
- Chevron Corporation
- Ardent Global LL
- Ramboll Group
- Apache Corporation
- Proserv Group Inc
- BP P L C
- Anadarko Petroleum Corporation
- TETRA Technologies Inc
Key Developments in Gulf of Mexico Oil & Gas Decommissioning Market Industry
- 2022 Q4: Successful completion of a large-scale deepwater decommissioning project by [Company Name], demonstrating advancements in subsea technology.
- 2023 Q1: Introduction of a new well-plugging and abandonment technique by [Company Name], significantly reducing environmental impact.
- 2023 Q3: Merger between two major decommissioning service providers, resulting in increased market consolidation.
Future Outlook for Gulf of Mexico Oil & Gas Decommissioning Market Market
The future outlook for the Gulf of Mexico oil & gas decommissioning market is positive. The continued aging of offshore infrastructure, coupled with stricter environmental regulations and technological advancements, will drive significant growth in the coming years. Opportunities exist for companies to develop innovative solutions, optimize decommissioning processes, and capitalize on emerging market segments. The market's long-term growth is projected to be robust, driven by a sustained need for efficient and environmentally responsible decommissioning practices.
Gulf of Mexico Oil & Gas Decommissioning Market Segmentation
-
1. Water Depth
- 1.1. Shallow Water
- 1.2. Deepwater
Gulf of Mexico Oil & Gas Decommissioning Market Segmentation By Geography
-
1. North America
- 1.1. United States
- 1.2. Canada
- 1.3. Mexico
-
2. South America
- 2.1. Brazil
- 2.2. Argentina
- 2.3. Rest of South America
-
3. Europe
- 3.1. United Kingdom
- 3.2. Germany
- 3.3. France
- 3.4. Italy
- 3.5. Spain
- 3.6. Russia
- 3.7. Benelux
- 3.8. Nordics
- 3.9. Rest of Europe
-
4. Middle East & Africa
- 4.1. Turkey
- 4.2. Israel
- 4.3. GCC
- 4.4. North Africa
- 4.5. South Africa
- 4.6. Rest of Middle East & Africa
-
5. Asia Pacific
- 5.1. China
- 5.2. India
- 5.3. Japan
- 5.4. South Korea
- 5.5. ASEAN
- 5.6. Oceania
- 5.7. Rest of Asia Pacific
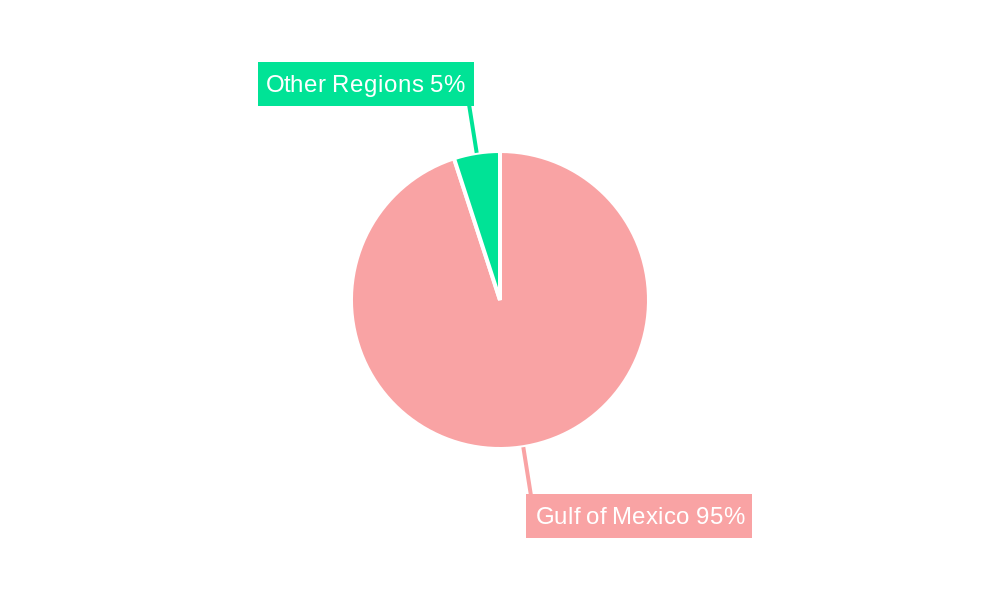
Gulf of Mexico Oil & Gas Decommissioning Market Regional Market Share
Geographic Coverage of Gulf of Mexico Oil & Gas Decommissioning Market
Gulf of Mexico Oil & Gas Decommissioning Market REPORT HIGHLIGHTS
| Aspects | Details |
|---|---|
| Study Period | 2020-2034 |
| Base Year | 2025 |
| Estimated Year | 2026 |
| Forecast Period | 2026-2034 |
| Historical Period | 2020-2025 |
| Growth Rate | CAGR of 6.5% from 2020-2034 |
| Segmentation |
|
Table of Contents
- 1. Introduction
- 1.1. Research Scope
- 1.2. Market Segmentation
- 1.3. Research Objective
- 1.4. Definitions and Assumptions
- 2. Executive Summary
- 2.1. Market Snapshot
- 3. Market Dynamics
- 3.1. Market Drivers
- 3.2. Market Restrains
- 3.3. Market Trends
- 3.4. Market Opportunities
- 4. Market Factor Analysis
- 4.1. Porters Five Forces
- 4.1.1. Bargaining Power of Suppliers
- 4.1.2. Bargaining Power of Buyers
- 4.1.3. Threat of New Entrants
- 4.1.4. Threat of Substitutes
- 4.1.5. Competitive Rivalry
- 4.2. PESTEL analysis
- 4.3. BCG Analysis
- 4.3.1. Stars (High Growth, High Market Share)
- 4.3.2. Cash Cows (Low Growth, High Market Share)
- 4.3.3. Question Mark (High Growth, Low Market Share)
- 4.3.4. Dogs (Low Growth, Low Market Share)
- 4.4. Ansoff Matrix Analysis
- 4.5. Supply Chain Analysis
- 4.6. Regulatory Landscape
- 4.7. Current Market Potential and Opportunity Assessment (TAM–SAM–SOM Framework)
- 4.8. PRI Analyst Note
- 4.1. Porters Five Forces
- 5. Market Analysis, Insights and Forecast 2021-2033
- 5.1. Market Analysis, Insights and Forecast - by Water Depth
- 5.1.1. Shallow Water
- 5.1.2. Deepwater
- 5.2. Market Analysis, Insights and Forecast - by Region
- 5.2.1. North America
- 5.2.2. South America
- 5.2.3. Europe
- 5.2.4. Middle East & Africa
- 5.2.5. Asia Pacific
- 5.1. Market Analysis, Insights and Forecast - by Water Depth
- 6. Global Gulf of Mexico Oil & Gas Decommissioning Market Analysis, Insights and Forecast, 2021-2033
- 6.1. Market Analysis, Insights and Forecast - by Water Depth
- 6.1.1. Shallow Water
- 6.1.2. Deepwater
- 6.1. Market Analysis, Insights and Forecast - by Water Depth
- 7. North America Gulf of Mexico Oil & Gas Decommissioning Market Analysis, Insights and Forecast, 2020-2032
- 7.1. Market Analysis, Insights and Forecast - by Water Depth
- 7.1.1. Shallow Water
- 7.1.2. Deepwater
- 7.1. Market Analysis, Insights and Forecast - by Water Depth
- 8. South America Gulf of Mexico Oil & Gas Decommissioning Market Analysis, Insights and Forecast, 2020-2032
- 8.1. Market Analysis, Insights and Forecast - by Water Depth
- 8.1.1. Shallow Water
- 8.1.2. Deepwater
- 8.1. Market Analysis, Insights and Forecast - by Water Depth
- 9. Europe Gulf of Mexico Oil & Gas Decommissioning Market Analysis, Insights and Forecast, 2020-2032
- 9.1. Market Analysis, Insights and Forecast - by Water Depth
- 9.1.1. Shallow Water
- 9.1.2. Deepwater
- 9.1. Market Analysis, Insights and Forecast - by Water Depth
- 10. Middle East & Africa Gulf of Mexico Oil & Gas Decommissioning Market Analysis, Insights and Forecast, 2020-2032
- 10.1. Market Analysis, Insights and Forecast - by Water Depth
- 10.1.1. Shallow Water
- 10.1.2. Deepwater
- 10.1. Market Analysis, Insights and Forecast - by Water Depth
- 11. Asia Pacific Gulf of Mexico Oil & Gas Decommissioning Market Analysis, Insights and Forecast, 2020-2032
- 11.1. Market Analysis, Insights and Forecast - by Water Depth
- 11.1.1. Shallow Water
- 11.1.2. Deepwater
- 11.1. Market Analysis, Insights and Forecast - by Water Depth
- 12. Competitive Analysis
- 12.1. Company Profiles
- 12.1.1 Service Companies
- 12.1.1.1. Company Overview
- 12.1.1.2. Products
- 12.1.1.3. Company Financials
- 12.1.1.4. SWOT Analysis
- 12.1.2 5 Exxon Mobil Corporation
- 12.1.2.1. Company Overview
- 12.1.2.2. Products
- 12.1.2.3. Company Financials
- 12.1.2.4. SWOT Analysis
- 12.1.3 4 Chevron Corporation
- 12.1.3.1. Company Overview
- 12.1.3.2. Products
- 12.1.3.3. Company Financials
- 12.1.3.4. SWOT Analysis
- 12.1.4 4 Ardent Global LL
- 12.1.4.1. Company Overview
- 12.1.4.2. Products
- 12.1.4.3. Company Financials
- 12.1.4.4. SWOT Analysis
- 12.1.5 2 Ramboll Group
- 12.1.5.1. Company Overview
- 12.1.5.2. Products
- 12.1.5.3. Company Financials
- 12.1.5.4. SWOT Analysis
- 12.1.6 2 Apache Corporation
- 12.1.6.1. Company Overview
- 12.1.6.2. Products
- 12.1.6.3. Company Financials
- 12.1.6.4. SWOT Analysis
- 12.1.7 1 Proserv Group Inc
- 12.1.7.1. Company Overview
- 12.1.7.2. Products
- 12.1.7.3. Company Financials
- 12.1.7.4. SWOT Analysis
- 12.1.8 Operators
- 12.1.8.1. Company Overview
- 12.1.8.2. Products
- 12.1.8.3. Company Financials
- 12.1.8.4. SWOT Analysis
- 12.1.9 3 TETRA Technologies Inc
- 12.1.9.1. Company Overview
- 12.1.9.2. Products
- 12.1.9.3. Company Financials
- 12.1.9.4. SWOT Analysis
- 12.1.10 1 Anadarko Petroleum Corporation
- 12.1.10.1. Company Overview
- 12.1.10.2. Products
- 12.1.10.3. Company Financials
- 12.1.10.4. SWOT Analysis
- 12.1.11 3 BP P L C
- 12.1.11.1. Company Overview
- 12.1.11.2. Products
- 12.1.11.3. Company Financials
- 12.1.11.4. SWOT Analysis
- 12.1.1 Service Companies
- 12.2. Market Entropy
- 12.2.1 Company's Key Areas Served
- 12.2.2 Recent Developments
- 12.3. Company Market Share Analysis 2025
- 12.3.1 Top 5 Companies Market Share Analysis
- 12.3.2 Top 3 Companies Market Share Analysis
- 12.4. List of Potential Customers
- 13. Research Methodology
List of Figures
- Figure 1: Global Gulf of Mexico Oil & Gas Decommissioning Market Revenue Breakdown (billion, %) by Region 2025 & 2033
- Figure 2: North America Gulf of Mexico Oil & Gas Decommissioning Market Revenue (billion), by Water Depth 2025 & 2033
- Figure 3: North America Gulf of Mexico Oil & Gas Decommissioning Market Revenue Share (%), by Water Depth 2025 & 2033
- Figure 4: North America Gulf of Mexico Oil & Gas Decommissioning Market Revenue (billion), by Country 2025 & 2033
- Figure 5: North America Gulf of Mexico Oil & Gas Decommissioning Market Revenue Share (%), by Country 2025 & 2033
- Figure 6: South America Gulf of Mexico Oil & Gas Decommissioning Market Revenue (billion), by Water Depth 2025 & 2033
- Figure 7: South America Gulf of Mexico Oil & Gas Decommissioning Market Revenue Share (%), by Water Depth 2025 & 2033
- Figure 8: South America Gulf of Mexico Oil & Gas Decommissioning Market Revenue (billion), by Country 2025 & 2033
- Figure 9: South America Gulf of Mexico Oil & Gas Decommissioning Market Revenue Share (%), by Country 2025 & 2033
- Figure 10: Europe Gulf of Mexico Oil & Gas Decommissioning Market Revenue (billion), by Water Depth 2025 & 2033
- Figure 11: Europe Gulf of Mexico Oil & Gas Decommissioning Market Revenue Share (%), by Water Depth 2025 & 2033
- Figure 12: Europe Gulf of Mexico Oil & Gas Decommissioning Market Revenue (billion), by Country 2025 & 2033
- Figure 13: Europe Gulf of Mexico Oil & Gas Decommissioning Market Revenue Share (%), by Country 2025 & 2033
- Figure 14: Middle East & Africa Gulf of Mexico Oil & Gas Decommissioning Market Revenue (billion), by Water Depth 2025 & 2033
- Figure 15: Middle East & Africa Gulf of Mexico Oil & Gas Decommissioning Market Revenue Share (%), by Water Depth 2025 & 2033
- Figure 16: Middle East & Africa Gulf of Mexico Oil & Gas Decommissioning Market Revenue (billion), by Country 2025 & 2033
- Figure 17: Middle East & Africa Gulf of Mexico Oil & Gas Decommissioning Market Revenue Share (%), by Country 2025 & 2033
- Figure 18: Asia Pacific Gulf of Mexico Oil & Gas Decommissioning Market Revenue (billion), by Water Depth 2025 & 2033
- Figure 19: Asia Pacific Gulf of Mexico Oil & Gas Decommissioning Market Revenue Share (%), by Water Depth 2025 & 2033
- Figure 20: Asia Pacific Gulf of Mexico Oil & Gas Decommissioning Market Revenue (billion), by Country 2025 & 2033
- Figure 21: Asia Pacific Gulf of Mexico Oil & Gas Decommissioning Market Revenue Share (%), by Country 2025 & 2033
List of Tables
- Table 1: Global Gulf of Mexico Oil & Gas Decommissioning Market Revenue billion Forecast, by Water Depth 2020 & 2033
- Table 2: Global Gulf of Mexico Oil & Gas Decommissioning Market Revenue billion Forecast, by Region 2020 & 2033
- Table 3: Global Gulf of Mexico Oil & Gas Decommissioning Market Revenue billion Forecast, by Water Depth 2020 & 2033
- Table 4: Global Gulf of Mexico Oil & Gas Decommissioning Market Revenue billion Forecast, by Country 2020 & 2033
- Table 5: United States Gulf of Mexico Oil & Gas Decommissioning Market Revenue (billion) Forecast, by Application 2020 & 2033
- Table 6: Canada Gulf of Mexico Oil & Gas Decommissioning Market Revenue (billion) Forecast, by Application 2020 & 2033
- Table 7: Mexico Gulf of Mexico Oil & Gas Decommissioning Market Revenue (billion) Forecast, by Application 2020 & 2033
- Table 8: Global Gulf of Mexico Oil & Gas Decommissioning Market Revenue billion Forecast, by Water Depth 2020 & 2033
- Table 9: Global Gulf of Mexico Oil & Gas Decommissioning Market Revenue billion Forecast, by Country 2020 & 2033
- Table 10: Brazil Gulf of Mexico Oil & Gas Decommissioning Market Revenue (billion) Forecast, by Application 2020 & 2033
- Table 11: Argentina Gulf of Mexico Oil & Gas Decommissioning Market Revenue (billion) Forecast, by Application 2020 & 2033
- Table 12: Rest of South America Gulf of Mexico Oil & Gas Decommissioning Market Revenue (billion) Forecast, by Application 2020 & 2033
- Table 13: Global Gulf of Mexico Oil & Gas Decommissioning Market Revenue billion Forecast, by Water Depth 2020 & 2033
- Table 14: Global Gulf of Mexico Oil & Gas Decommissioning Market Revenue billion Forecast, by Country 2020 & 2033
- Table 15: United Kingdom Gulf of Mexico Oil & Gas Decommissioning Market Revenue (billion) Forecast, by Application 2020 & 2033
- Table 16: Germany Gulf of Mexico Oil & Gas Decommissioning Market Revenue (billion) Forecast, by Application 2020 & 2033
- Table 17: France Gulf of Mexico Oil & Gas Decommissioning Market Revenue (billion) Forecast, by Application 2020 & 2033
- Table 18: Italy Gulf of Mexico Oil & Gas Decommissioning Market Revenue (billion) Forecast, by Application 2020 & 2033
- Table 19: Spain Gulf of Mexico Oil & Gas Decommissioning Market Revenue (billion) Forecast, by Application 2020 & 2033
- Table 20: Russia Gulf of Mexico Oil & Gas Decommissioning Market Revenue (billion) Forecast, by Application 2020 & 2033
- Table 21: Benelux Gulf of Mexico Oil & Gas Decommissioning Market Revenue (billion) Forecast, by Application 2020 & 2033
- Table 22: Nordics Gulf of Mexico Oil & Gas Decommissioning Market Revenue (billion) Forecast, by Application 2020 & 2033
- Table 23: Rest of Europe Gulf of Mexico Oil & Gas Decommissioning Market Revenue (billion) Forecast, by Application 2020 & 2033
- Table 24: Global Gulf of Mexico Oil & Gas Decommissioning Market Revenue billion Forecast, by Water Depth 2020 & 2033
- Table 25: Global Gulf of Mexico Oil & Gas Decommissioning Market Revenue billion Forecast, by Country 2020 & 2033
- Table 26: Turkey Gulf of Mexico Oil & Gas Decommissioning Market Revenue (billion) Forecast, by Application 2020 & 2033
- Table 27: Israel Gulf of Mexico Oil & Gas Decommissioning Market Revenue (billion) Forecast, by Application 2020 & 2033
- Table 28: GCC Gulf of Mexico Oil & Gas Decommissioning Market Revenue (billion) Forecast, by Application 2020 & 2033
- Table 29: North Africa Gulf of Mexico Oil & Gas Decommissioning Market Revenue (billion) Forecast, by Application 2020 & 2033
- Table 30: South Africa Gulf of Mexico Oil & Gas Decommissioning Market Revenue (billion) Forecast, by Application 2020 & 2033
- Table 31: Rest of Middle East & Africa Gulf of Mexico Oil & Gas Decommissioning Market Revenue (billion) Forecast, by Application 2020 & 2033
- Table 32: Global Gulf of Mexico Oil & Gas Decommissioning Market Revenue billion Forecast, by Water Depth 2020 & 2033
- Table 33: Global Gulf of Mexico Oil & Gas Decommissioning Market Revenue billion Forecast, by Country 2020 & 2033
- Table 34: China Gulf of Mexico Oil & Gas Decommissioning Market Revenue (billion) Forecast, by Application 2020 & 2033
- Table 35: India Gulf of Mexico Oil & Gas Decommissioning Market Revenue (billion) Forecast, by Application 2020 & 2033
- Table 36: Japan Gulf of Mexico Oil & Gas Decommissioning Market Revenue (billion) Forecast, by Application 2020 & 2033
- Table 37: South Korea Gulf of Mexico Oil & Gas Decommissioning Market Revenue (billion) Forecast, by Application 2020 & 2033
- Table 38: ASEAN Gulf of Mexico Oil & Gas Decommissioning Market Revenue (billion) Forecast, by Application 2020 & 2033
- Table 39: Oceania Gulf of Mexico Oil & Gas Decommissioning Market Revenue (billion) Forecast, by Application 2020 & 2033
- Table 40: Rest of Asia Pacific Gulf of Mexico Oil & Gas Decommissioning Market Revenue (billion) Forecast, by Application 2020 & 2033
Frequently Asked Questions
1. What is the projected Compound Annual Growth Rate (CAGR) of the Gulf of Mexico Oil & Gas Decommissioning Market?
The projected CAGR is approximately 6.5%.
2. Which companies are prominent players in the Gulf of Mexico Oil & Gas Decommissioning Market?
Key companies in the market include Service Companies, 5 Exxon Mobil Corporation, 4 Chevron Corporation, 4 Ardent Global LL, 2 Ramboll Group, 2 Apache Corporation, 1 Proserv Group Inc, Operators, 3 TETRA Technologies Inc, 1 Anadarko Petroleum Corporation, 3 BP P L C.
3. What are the main segments of the Gulf of Mexico Oil & Gas Decommissioning Market?
The market segments include Water Depth.
4. Can you provide details about the market size?
The market size is estimated to be USD 11.1 billion as of 2022.
5. What are some drivers contributing to market growth?
N/A
6. What are the notable trends driving market growth?
Deepwater to Register Highest Growth Rate.
7. Are there any restraints impacting market growth?
N/A
8. Can you provide examples of recent developments in the market?
N/A
9. What pricing options are available for accessing the report?
Pricing options include single-user, multi-user, and enterprise licenses priced at USD 3800, USD 4500, and USD 5800 respectively.
10. Is the market size provided in terms of value or volume?
The market size is provided in terms of value, measured in billion.
11. Are there any specific market keywords associated with the report?
Yes, the market keyword associated with the report is "Gulf of Mexico Oil & Gas Decommissioning Market," which aids in identifying and referencing the specific market segment covered.
12. How do I determine which pricing option suits my needs best?
The pricing options vary based on user requirements and access needs. Individual users may opt for single-user licenses, while businesses requiring broader access may choose multi-user or enterprise licenses for cost-effective access to the report.
13. Are there any additional resources or data provided in the Gulf of Mexico Oil & Gas Decommissioning Market report?
While the report offers comprehensive insights, it's advisable to review the specific contents or supplementary materials provided to ascertain if additional resources or data are available.
14. How can I stay updated on further developments or reports in the Gulf of Mexico Oil & Gas Decommissioning Market?
To stay informed about further developments, trends, and reports in the Gulf of Mexico Oil & Gas Decommissioning Market, consider subscribing to industry newsletters, following relevant companies and organizations, or regularly checking reputable industry news sources and publications.
Methodology
Step 1 - Identification of Relevant Samples Size from Population Database


Step 2 - Approaches for Defining Global Market Size (Value, Volume* & Price*)

Note*: In applicable scenarios
Step 3 - Data Sources
Primary Research
- Web Analytics
- Survey Reports
- Research Institute
- Latest Research Reports
- Opinion Leaders
Secondary Research
- Annual Reports
- White Paper
- Latest Press Release
- Industry Association
- Paid Database
- Investor Presentations

Step 4 - Data Triangulation
Involves using different sources of information in order to increase the validity of a study
These sources are likely to be stakeholders in a program - participants, other researchers, program staff, other community members, and so on.
Then we put all data in single framework & apply various statistical tools to find out the dynamic on the market.
During the analysis stage, feedback from the stakeholder groups would be compared to determine areas of agreement as well as areas of divergence