

Key Insights
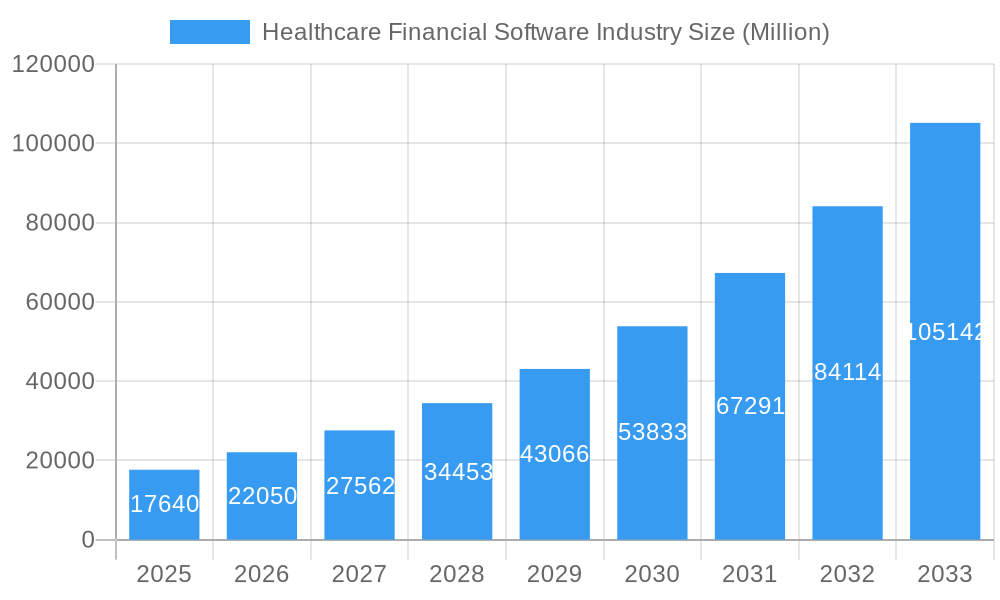
The Healthcare Financial Software market is experiencing robust growth, projected to reach $17.64 billion in 2025 and exhibiting a Compound Annual Growth Rate (CAGR) of 25% from 2025 to 2033. This expansion is fueled by several key factors. Increasing regulatory compliance requirements necessitate sophisticated software solutions for claims analytics, revenue cycle management, and risk management. The rising adoption of cloud-based solutions offers enhanced scalability, accessibility, and cost-effectiveness, contributing significantly to market growth. Furthermore, the growing volume of healthcare data and the need for data-driven decision-making are driving demand for advanced analytics capabilities integrated into these software systems. Major players like CVS Health, SAS Institute, and McKesson are actively shaping the market landscape through continuous innovation and strategic acquisitions. The market is segmented by type (Claim Analytics, Revenue Cycle Management, Risk Management Analytics, and Others), component (Hardware, Software & Services), and deployment (On-premise, Cloud-based). The cloud-based segment is expected to witness the fastest growth due to its inherent advantages. Geographically, North America currently holds a significant market share, driven by high technology adoption and advanced healthcare infrastructure, although Asia-Pacific is poised for significant growth in the coming years.
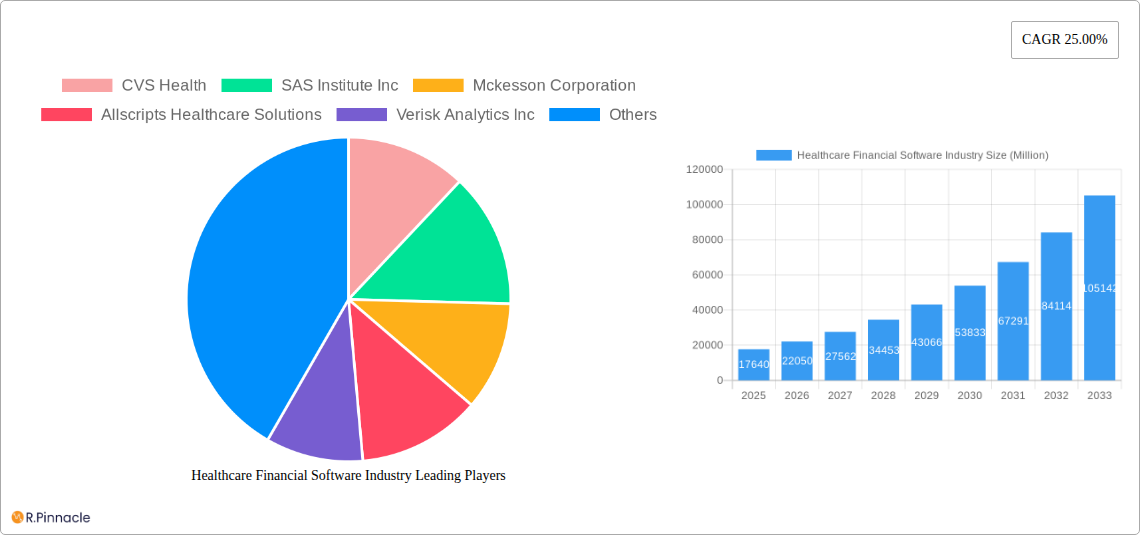
Healthcare Financial Software Industry Market Size (In Billion)
The competitive landscape is characterized by both established players and emerging innovative companies. Strategic partnerships and mergers and acquisitions are likely to continue reshaping the industry. The increasing focus on interoperability and data security remains a crucial consideration for both vendors and healthcare providers. Future growth will depend on the continued development of AI-powered solutions, integration with Electronic Health Records (EHR) systems, and the ability to address the evolving needs of healthcare payers and providers in managing financial complexities and optimizing revenue cycles. The market's future is bright, driven by the ongoing need for efficient, secure, and data-driven financial management within the healthcare sector.
Healthcare Financial Software Industry Company Market Share
Healthcare Financial Software Industry Report: 2019-2033
This comprehensive report provides a detailed analysis of the Healthcare Financial Software industry, offering invaluable insights for industry professionals, investors, and strategists. The study period covers 2019-2033, with a base year of 2025 and a forecast period of 2025-2033. The report leverages extensive market research and data analysis to project a market valued at $XX Million by 2033, revealing key trends, opportunities, and challenges shaping this dynamic sector.
Healthcare Financial Software Industry Market Structure & Innovation Trends
The healthcare financial software market exhibits a moderately concentrated structure, with key players like CVS Health, SAS Institute Inc, McKesson Corporation, Allscripts Healthcare Solutions, Verisk Analytics Inc, Inovalon, Cerner Corporation, Optum Inc, Oracle Corporation, Health Catalyst, CitiusTech Inc, and IBM holding significant market share. However, the presence of numerous smaller, specialized firms indicates a competitive landscape. Innovation is driven by increasing demands for advanced analytics, cloud-based solutions, and interoperability. Stringent regulatory frameworks, such as HIPAA in the US, influence product development and data security practices. Product substitutes include legacy systems and manual processes, but the overall trend favors automation and digital transformation. End-user demographics are broad, including hospitals, clinics, payers, and pharmaceutical companies. The historical period (2019-2024) witnessed significant M&A activity, with deals totaling an estimated $XX Million. This includes notable acquisitions like Francisco Partners' purchase of IBM's Watson Health assets in 2022. Further consolidation is anticipated, driven by the pursuit of economies of scale and enhanced capabilities.
- Market Concentration: Moderately Concentrated
- Innovation Drivers: Advanced analytics, cloud computing, interoperability
- Regulatory Frameworks: HIPAA, other regional regulations
- M&A Activity (2019-2024): Estimated $XX Million
Healthcare Financial Software Industry Market Dynamics & Trends
The healthcare financial software market is experiencing robust growth, fueled by several key factors. The rising adoption of electronic health records (EHRs) and the increasing focus on value-based care are driving demand for sophisticated software solutions to manage financial processes efficiently. Technological advancements, such as artificial intelligence (AI) and machine learning (ML), are enhancing the capabilities of these systems, leading to improved accuracy, automation, and predictive analytics. Consumer preferences are shifting toward user-friendly, cloud-based solutions that offer seamless integration with existing healthcare IT infrastructure. Intense competition among established players and emerging startups is fostering innovation and driving down prices, making these solutions more accessible to a broader range of healthcare providers. The compound annual growth rate (CAGR) for the forecast period (2025-2033) is estimated at XX%, with market penetration expected to reach XX% by 2033. This growth is further bolstered by government initiatives promoting digital health and interoperability.
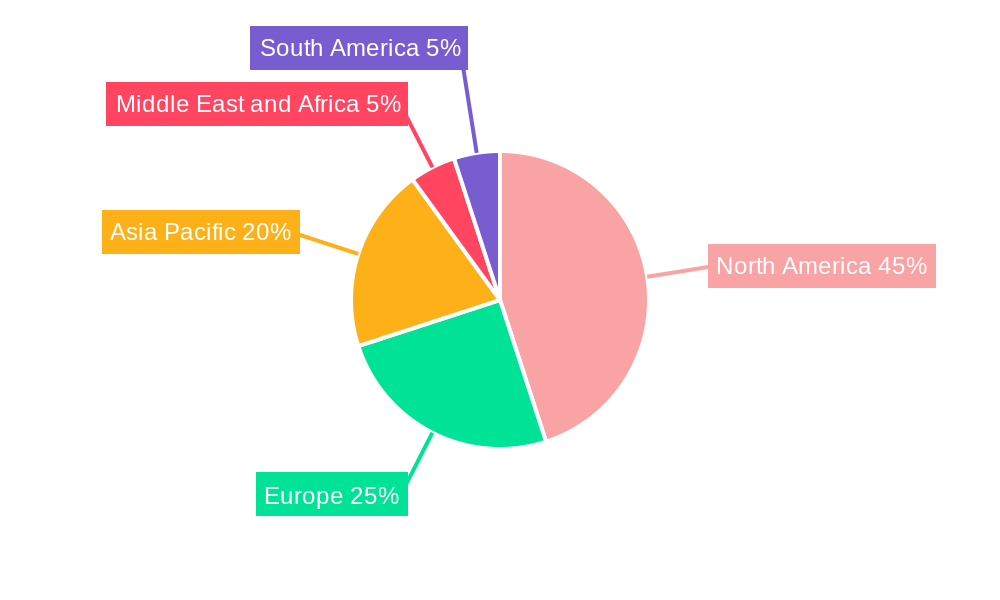
Dominant Regions & Segments in Healthcare Financial Software Industry
The North American market currently holds the dominant position in the healthcare financial software industry, driven by factors such as high technological adoption rates, robust healthcare infrastructure, and favorable regulatory policies. However, other regions like Europe and Asia-Pacific are demonstrating significant growth potential.
By Type:
- Revenue Cycle Management (RCM): This segment dominates due to the critical role of efficient billing and collections in healthcare finance.
- Claim Analytics: Rapid growth is observed here due to the increasing need for data-driven insights to optimize claims processing and reduce denials.
- Risk Management Analytics: The growing emphasis on proactive risk management further fuels the growth in this segment.
By Component:
- Software & Services: This segment constitutes the largest share, driven by the increasing preference for cloud-based solutions and managed services.
- Hardware: While significant, the hardware segment's growth is relatively slower compared to software.
By Deployment:
- Cloud-based: Cloud deployment is rapidly gaining traction due to its scalability, cost-effectiveness, and accessibility.
- On-premise: While still prevalent, on-premise deployments are gradually declining in favor of cloud-based alternatives.
Healthcare Financial Software Industry Product Innovations
Recent innovations include AI-powered predictive analytics for financial forecasting, blockchain technology for enhanced security and transparency in healthcare transactions, and advanced data visualization tools for improved decision-making. These advancements enhance the efficiency, accuracy, and security of healthcare financial processes, aligning seamlessly with market needs and driving adoption among providers.
Report Scope & Segmentation Analysis
This report comprehensively analyzes the healthcare financial software market across various segments:
- By Type: Claim Analytics, Revenue Cycle Management, Risk Management Analytics, Others. Each segment's growth trajectory is analyzed, with market size projections and competitive dynamics assessed.
- By Component: Hardware, Software & Services. The report delves into the market share of each component and future growth expectations.
- By Deployment: On-premise, Cloud-based. The report examines the adoption trends of each deployment model and their respective market sizes.
Each segment’s analysis includes growth projections, market size estimations for the forecast period, and a competitive landscape assessment.
Key Drivers of Healthcare Financial Software Industry Growth
Several factors contribute to the market's growth: the increasing adoption of EHRs, the transition to value-based care models, the rising demand for improved operational efficiency, and the need for enhanced data security. Government regulations incentivizing digital health solutions and technological advancements like AI and ML further accelerate market expansion. Moreover, a growing awareness of the benefits of data-driven decision-making is propelling organizations toward adopting advanced analytics tools.
Challenges in the Healthcare Financial Software Industry Sector
Challenges include data security concerns, regulatory compliance complexities (like HIPAA), the integration of disparate systems, and the high initial investment costs associated with implementing new software solutions. The lack of skilled IT personnel and the need to address interoperability issues represent further obstacles. These challenges create a quantifiable impact on market growth, potentially delaying adoption rates and impacting overall market value.
Emerging Opportunities in Healthcare Financial Software Industry
Opportunities abound in integrating emerging technologies like AI, blockchain, and IoT into healthcare financial software. Expanding into underserved markets, particularly in developing economies, presents significant potential. Developing specialized solutions for niche areas within healthcare finance, such as population health management and telehealth, opens further avenues for growth. The focus on personalized medicine and data-driven insights will propel demand for advanced analytics and predictive modeling capabilities.
Leading Players in the Healthcare Financial Software Industry Market
- CVS Health
- SAS Institute Inc
- McKesson Corporation
- Allscripts Healthcare Solutions
- Verisk Analytics Inc
- Inovalon
- Cerner Corporation
- Optum Inc
- Oracle Corporation
- Health Catalyst
- CitiusTech Inc
- IBM
Key Developments in Healthcare Financial Software Industry Industry
- May 2022: Clarify Health Institute launched, focusing on data-driven insights in healthcare.
- January 2022: Francisco Partners acquired IBM's Watson Health data and analytics assets.
Future Outlook for Healthcare Financial Software Industry Market
The healthcare financial software market is poised for continued growth, driven by technological advancements, increasing regulatory pressures, and the ongoing shift towards value-based care. Strategic partnerships, acquisitions, and the development of innovative solutions will further shape the market landscape. The market's future hinges on addressing current challenges while capitalizing on emerging opportunities, leading to significant market expansion and transformation.
Healthcare Financial Software Industry Segmentation
-
1. Type
- 1.1. Claim Analytics
- 1.2. Revenue Cycle Management
- 1.3. Risk Management Analytics
- 1.4. Others
-
2. Component
- 2.1. Hardware
- 2.2. Software & Services
-
3. Deployment
- 3.1. On-premise
- 3.2. Cloud-based
Healthcare Financial Software Industry Segmentation By Geography
-
1. North America
- 1.1. United States
- 1.2. Canada
- 1.3. Mexico
-
2. Europe
- 2.1. Germany
- 2.2. United Kingdom
- 2.3. France
- 2.4. Italy
- 2.5. Spain
- 2.6. Rest of Europe
-
3. Asia Pacific
- 3.1. China
- 3.2. Japan
- 3.3. India
- 3.4. Australia
- 3.5. South Korea
- 3.6. Rest of Asia Pacific
-
4. Middle East and Africa
- 4.1. GCC
- 4.2. South Africa
- 4.3. Rest of Middle East and Africa
-
5. South America
- 5.1. Brazil
- 5.2. Argentina
- 5.3. Rest of South America
Healthcare Financial Software Industry Regional Market Share
Geographic Coverage of Healthcare Financial Software Industry
Healthcare Financial Software Industry REPORT HIGHLIGHTS
| Aspects | Details |
|---|---|
| Study Period | 2020-2034 |
| Base Year | 2025 |
| Estimated Year | 2026 |
| Forecast Period | 2026-2034 |
| Historical Period | 2020-2025 |
| Growth Rate | CAGR of 25.00% from 2020-2034 |
| Segmentation |
|
Table of Contents
- 1. Introduction
- 1.1. Research Scope
- 1.2. Market Segmentation
- 1.3. Research Objective
- 1.4. Definitions and Assumptions
- 2. Executive Summary
- 2.1. Market Snapshot
- 3. Market Dynamics
- 3.1. Market Drivers
- 3.2. Market Restrains
- 3.3. Market Trends
- 3.4. Market Opportunities
- 4. Market Factor Analysis
- 4.1. Porters Five Forces
- 4.1.1. Bargaining Power of Suppliers
- 4.1.2. Bargaining Power of Buyers
- 4.1.3. Threat of New Entrants
- 4.1.4. Threat of Substitutes
- 4.1.5. Competitive Rivalry
- 4.2. PESTEL analysis
- 4.3. BCG Analysis
- 4.3.1. Stars (High Growth, High Market Share)
- 4.3.2. Cash Cows (Low Growth, High Market Share)
- 4.3.3. Question Mark (High Growth, Low Market Share)
- 4.3.4. Dogs (Low Growth, Low Market Share)
- 4.4. Ansoff Matrix Analysis
- 4.5. Supply Chain Analysis
- 4.6. Regulatory Landscape
- 4.7. Current Market Potential and Opportunity Assessment (TAM–SAM–SOM Framework)
- 4.8. PRI Analyst Note
- 4.1. Porters Five Forces
- 5. Market Analysis, Insights and Forecast 2021-2033
- 5.1. Market Analysis, Insights and Forecast - by Type
- 5.1.1. Claim Analytics
- 5.1.2. Revenue Cycle Management
- 5.1.3. Risk Management Analytics
- 5.1.4. Others
- 5.2. Market Analysis, Insights and Forecast - by Component
- 5.2.1. Hardware
- 5.2.2. Software & Services
- 5.3. Market Analysis, Insights and Forecast - by Deployment
- 5.3.1. On-premise
- 5.3.2. Cloud-based
- 5.4. Market Analysis, Insights and Forecast - by Region
- 5.4.1. North America
- 5.4.2. Europe
- 5.4.3. Asia Pacific
- 5.4.4. Middle East and Africa
- 5.4.5. South America
- 5.1. Market Analysis, Insights and Forecast - by Type
- 6. Global Healthcare Financial Software Industry Analysis, Insights and Forecast, 2021-2033
- 6.1. Market Analysis, Insights and Forecast - by Type
- 6.1.1. Claim Analytics
- 6.1.2. Revenue Cycle Management
- 6.1.3. Risk Management Analytics
- 6.1.4. Others
- 6.2. Market Analysis, Insights and Forecast - by Component
- 6.2.1. Hardware
- 6.2.2. Software & Services
- 6.3. Market Analysis, Insights and Forecast - by Deployment
- 6.3.1. On-premise
- 6.3.2. Cloud-based
- 6.1. Market Analysis, Insights and Forecast - by Type
- 7. North America Healthcare Financial Software Industry Analysis, Insights and Forecast, 2020-2032
- 7.1. Market Analysis, Insights and Forecast - by Type
- 7.1.1. Claim Analytics
- 7.1.2. Revenue Cycle Management
- 7.1.3. Risk Management Analytics
- 7.1.4. Others
- 7.2. Market Analysis, Insights and Forecast - by Component
- 7.2.1. Hardware
- 7.2.2. Software & Services
- 7.3. Market Analysis, Insights and Forecast - by Deployment
- 7.3.1. On-premise
- 7.3.2. Cloud-based
- 7.1. Market Analysis, Insights and Forecast - by Type
- 8. Europe Healthcare Financial Software Industry Analysis, Insights and Forecast, 2020-2032
- 8.1. Market Analysis, Insights and Forecast - by Type
- 8.1.1. Claim Analytics
- 8.1.2. Revenue Cycle Management
- 8.1.3. Risk Management Analytics
- 8.1.4. Others
- 8.2. Market Analysis, Insights and Forecast - by Component
- 8.2.1. Hardware
- 8.2.2. Software & Services
- 8.3. Market Analysis, Insights and Forecast - by Deployment
- 8.3.1. On-premise
- 8.3.2. Cloud-based
- 8.1. Market Analysis, Insights and Forecast - by Type
- 9. Asia Pacific Healthcare Financial Software Industry Analysis, Insights and Forecast, 2020-2032
- 9.1. Market Analysis, Insights and Forecast - by Type
- 9.1.1. Claim Analytics
- 9.1.2. Revenue Cycle Management
- 9.1.3. Risk Management Analytics
- 9.1.4. Others
- 9.2. Market Analysis, Insights and Forecast - by Component
- 9.2.1. Hardware
- 9.2.2. Software & Services
- 9.3. Market Analysis, Insights and Forecast - by Deployment
- 9.3.1. On-premise
- 9.3.2. Cloud-based
- 9.1. Market Analysis, Insights and Forecast - by Type
- 10. Middle East and Africa Healthcare Financial Software Industry Analysis, Insights and Forecast, 2020-2032
- 10.1. Market Analysis, Insights and Forecast - by Type
- 10.1.1. Claim Analytics
- 10.1.2. Revenue Cycle Management
- 10.1.3. Risk Management Analytics
- 10.1.4. Others
- 10.2. Market Analysis, Insights and Forecast - by Component
- 10.2.1. Hardware
- 10.2.2. Software & Services
- 10.3. Market Analysis, Insights and Forecast - by Deployment
- 10.3.1. On-premise
- 10.3.2. Cloud-based
- 10.1. Market Analysis, Insights and Forecast - by Type
- 11. South America Healthcare Financial Software Industry Analysis, Insights and Forecast, 2020-2032
- 11.1. Market Analysis, Insights and Forecast - by Type
- 11.1.1. Claim Analytics
- 11.1.2. Revenue Cycle Management
- 11.1.3. Risk Management Analytics
- 11.1.4. Others
- 11.2. Market Analysis, Insights and Forecast - by Component
- 11.2.1. Hardware
- 11.2.2. Software & Services
- 11.3. Market Analysis, Insights and Forecast - by Deployment
- 11.3.1. On-premise
- 11.3.2. Cloud-based
- 11.1. Market Analysis, Insights and Forecast - by Type
- 12. Competitive Analysis
- 12.1. Company Profiles
- 12.1.1 CVS Health
- 12.1.1.1. Company Overview
- 12.1.1.2. Products
- 12.1.1.3. Company Financials
- 12.1.1.4. SWOT Analysis
- 12.1.2 SAS Institute Inc
- 12.1.2.1. Company Overview
- 12.1.2.2. Products
- 12.1.2.3. Company Financials
- 12.1.2.4. SWOT Analysis
- 12.1.3 Mckesson Corporation
- 12.1.3.1. Company Overview
- 12.1.3.2. Products
- 12.1.3.3. Company Financials
- 12.1.3.4. SWOT Analysis
- 12.1.4 Allscripts Healthcare Solutions
- 12.1.4.1. Company Overview
- 12.1.4.2. Products
- 12.1.4.3. Company Financials
- 12.1.4.4. SWOT Analysis
- 12.1.5 Verisk Analytics Inc
- 12.1.5.1. Company Overview
- 12.1.5.2. Products
- 12.1.5.3. Company Financials
- 12.1.5.4. SWOT Analysis
- 12.1.6 Inovalon*List Not Exhaustive
- 12.1.6.1. Company Overview
- 12.1.6.2. Products
- 12.1.6.3. Company Financials
- 12.1.6.4. SWOT Analysis
- 12.1.7 Cerner Corporation
- 12.1.7.1. Company Overview
- 12.1.7.2. Products
- 12.1.7.3. Company Financials
- 12.1.7.4. SWOT Analysis
- 12.1.8 Optum Inc
- 12.1.8.1. Company Overview
- 12.1.8.2. Products
- 12.1.8.3. Company Financials
- 12.1.8.4. SWOT Analysis
- 12.1.9 Oracle Corporation
- 12.1.9.1. Company Overview
- 12.1.9.2. Products
- 12.1.9.3. Company Financials
- 12.1.9.4. SWOT Analysis
- 12.1.10 Health Catalyst
- 12.1.10.1. Company Overview
- 12.1.10.2. Products
- 12.1.10.3. Company Financials
- 12.1.10.4. SWOT Analysis
- 12.1.11 CitiusTech Inc
- 12.1.11.1. Company Overview
- 12.1.11.2. Products
- 12.1.11.3. Company Financials
- 12.1.11.4. SWOT Analysis
- 12.1.12 IBM
- 12.1.12.1. Company Overview
- 12.1.12.2. Products
- 12.1.12.3. Company Financials
- 12.1.12.4. SWOT Analysis
- 12.1.1 CVS Health
- 12.2. Market Entropy
- 12.2.1 Company's Key Areas Served
- 12.2.2 Recent Developments
- 12.3. Company Market Share Analysis 2025
- 12.3.1 Top 5 Companies Market Share Analysis
- 12.3.2 Top 3 Companies Market Share Analysis
- 12.4. List of Potential Customers
- 13. Research Methodology
List of Figures
- Figure 1: Global Healthcare Financial Software Industry Revenue Breakdown (Million, %) by Region 2025 & 2033
- Figure 2: North America Healthcare Financial Software Industry Revenue (Million), by Type 2025 & 2033
- Figure 3: North America Healthcare Financial Software Industry Revenue Share (%), by Type 2025 & 2033
- Figure 4: North America Healthcare Financial Software Industry Revenue (Million), by Component 2025 & 2033
- Figure 5: North America Healthcare Financial Software Industry Revenue Share (%), by Component 2025 & 2033
- Figure 6: North America Healthcare Financial Software Industry Revenue (Million), by Deployment 2025 & 2033
- Figure 7: North America Healthcare Financial Software Industry Revenue Share (%), by Deployment 2025 & 2033
- Figure 8: North America Healthcare Financial Software Industry Revenue (Million), by Country 2025 & 2033
- Figure 9: North America Healthcare Financial Software Industry Revenue Share (%), by Country 2025 & 2033
- Figure 10: Europe Healthcare Financial Software Industry Revenue (Million), by Type 2025 & 2033
- Figure 11: Europe Healthcare Financial Software Industry Revenue Share (%), by Type 2025 & 2033
- Figure 12: Europe Healthcare Financial Software Industry Revenue (Million), by Component 2025 & 2033
- Figure 13: Europe Healthcare Financial Software Industry Revenue Share (%), by Component 2025 & 2033
- Figure 14: Europe Healthcare Financial Software Industry Revenue (Million), by Deployment 2025 & 2033
- Figure 15: Europe Healthcare Financial Software Industry Revenue Share (%), by Deployment 2025 & 2033
- Figure 16: Europe Healthcare Financial Software Industry Revenue (Million), by Country 2025 & 2033
- Figure 17: Europe Healthcare Financial Software Industry Revenue Share (%), by Country 2025 & 2033
- Figure 18: Asia Pacific Healthcare Financial Software Industry Revenue (Million), by Type 2025 & 2033
- Figure 19: Asia Pacific Healthcare Financial Software Industry Revenue Share (%), by Type 2025 & 2033
- Figure 20: Asia Pacific Healthcare Financial Software Industry Revenue (Million), by Component 2025 & 2033
- Figure 21: Asia Pacific Healthcare Financial Software Industry Revenue Share (%), by Component 2025 & 2033
- Figure 22: Asia Pacific Healthcare Financial Software Industry Revenue (Million), by Deployment 2025 & 2033
- Figure 23: Asia Pacific Healthcare Financial Software Industry Revenue Share (%), by Deployment 2025 & 2033
- Figure 24: Asia Pacific Healthcare Financial Software Industry Revenue (Million), by Country 2025 & 2033
- Figure 25: Asia Pacific Healthcare Financial Software Industry Revenue Share (%), by Country 2025 & 2033
- Figure 26: Middle East and Africa Healthcare Financial Software Industry Revenue (Million), by Type 2025 & 2033
- Figure 27: Middle East and Africa Healthcare Financial Software Industry Revenue Share (%), by Type 2025 & 2033
- Figure 28: Middle East and Africa Healthcare Financial Software Industry Revenue (Million), by Component 2025 & 2033
- Figure 29: Middle East and Africa Healthcare Financial Software Industry Revenue Share (%), by Component 2025 & 2033
- Figure 30: Middle East and Africa Healthcare Financial Software Industry Revenue (Million), by Deployment 2025 & 2033
- Figure 31: Middle East and Africa Healthcare Financial Software Industry Revenue Share (%), by Deployment 2025 & 2033
- Figure 32: Middle East and Africa Healthcare Financial Software Industry Revenue (Million), by Country 2025 & 2033
- Figure 33: Middle East and Africa Healthcare Financial Software Industry Revenue Share (%), by Country 2025 & 2033
- Figure 34: South America Healthcare Financial Software Industry Revenue (Million), by Type 2025 & 2033
- Figure 35: South America Healthcare Financial Software Industry Revenue Share (%), by Type 2025 & 2033
- Figure 36: South America Healthcare Financial Software Industry Revenue (Million), by Component 2025 & 2033
- Figure 37: South America Healthcare Financial Software Industry Revenue Share (%), by Component 2025 & 2033
- Figure 38: South America Healthcare Financial Software Industry Revenue (Million), by Deployment 2025 & 2033
- Figure 39: South America Healthcare Financial Software Industry Revenue Share (%), by Deployment 2025 & 2033
- Figure 40: South America Healthcare Financial Software Industry Revenue (Million), by Country 2025 & 2033
- Figure 41: South America Healthcare Financial Software Industry Revenue Share (%), by Country 2025 & 2033
List of Tables
- Table 1: Global Healthcare Financial Software Industry Revenue Million Forecast, by Type 2020 & 2033
- Table 2: Global Healthcare Financial Software Industry Revenue Million Forecast, by Component 2020 & 2033
- Table 3: Global Healthcare Financial Software Industry Revenue Million Forecast, by Deployment 2020 & 2033
- Table 4: Global Healthcare Financial Software Industry Revenue Million Forecast, by Region 2020 & 2033
- Table 5: Global Healthcare Financial Software Industry Revenue Million Forecast, by Type 2020 & 2033
- Table 6: Global Healthcare Financial Software Industry Revenue Million Forecast, by Component 2020 & 2033
- Table 7: Global Healthcare Financial Software Industry Revenue Million Forecast, by Deployment 2020 & 2033
- Table 8: Global Healthcare Financial Software Industry Revenue Million Forecast, by Country 2020 & 2033
- Table 9: United States Healthcare Financial Software Industry Revenue (Million) Forecast, by Application 2020 & 2033
- Table 10: Canada Healthcare Financial Software Industry Revenue (Million) Forecast, by Application 2020 & 2033
- Table 11: Mexico Healthcare Financial Software Industry Revenue (Million) Forecast, by Application 2020 & 2033
- Table 12: Global Healthcare Financial Software Industry Revenue Million Forecast, by Type 2020 & 2033
- Table 13: Global Healthcare Financial Software Industry Revenue Million Forecast, by Component 2020 & 2033
- Table 14: Global Healthcare Financial Software Industry Revenue Million Forecast, by Deployment 2020 & 2033
- Table 15: Global Healthcare Financial Software Industry Revenue Million Forecast, by Country 2020 & 2033
- Table 16: Germany Healthcare Financial Software Industry Revenue (Million) Forecast, by Application 2020 & 2033
- Table 17: United Kingdom Healthcare Financial Software Industry Revenue (Million) Forecast, by Application 2020 & 2033
- Table 18: France Healthcare Financial Software Industry Revenue (Million) Forecast, by Application 2020 & 2033
- Table 19: Italy Healthcare Financial Software Industry Revenue (Million) Forecast, by Application 2020 & 2033
- Table 20: Spain Healthcare Financial Software Industry Revenue (Million) Forecast, by Application 2020 & 2033
- Table 21: Rest of Europe Healthcare Financial Software Industry Revenue (Million) Forecast, by Application 2020 & 2033
- Table 22: Global Healthcare Financial Software Industry Revenue Million Forecast, by Type 2020 & 2033
- Table 23: Global Healthcare Financial Software Industry Revenue Million Forecast, by Component 2020 & 2033
- Table 24: Global Healthcare Financial Software Industry Revenue Million Forecast, by Deployment 2020 & 2033
- Table 25: Global Healthcare Financial Software Industry Revenue Million Forecast, by Country 2020 & 2033
- Table 26: China Healthcare Financial Software Industry Revenue (Million) Forecast, by Application 2020 & 2033
- Table 27: Japan Healthcare Financial Software Industry Revenue (Million) Forecast, by Application 2020 & 2033
- Table 28: India Healthcare Financial Software Industry Revenue (Million) Forecast, by Application 2020 & 2033
- Table 29: Australia Healthcare Financial Software Industry Revenue (Million) Forecast, by Application 2020 & 2033
- Table 30: South Korea Healthcare Financial Software Industry Revenue (Million) Forecast, by Application 2020 & 2033
- Table 31: Rest of Asia Pacific Healthcare Financial Software Industry Revenue (Million) Forecast, by Application 2020 & 2033
- Table 32: Global Healthcare Financial Software Industry Revenue Million Forecast, by Type 2020 & 2033
- Table 33: Global Healthcare Financial Software Industry Revenue Million Forecast, by Component 2020 & 2033
- Table 34: Global Healthcare Financial Software Industry Revenue Million Forecast, by Deployment 2020 & 2033
- Table 35: Global Healthcare Financial Software Industry Revenue Million Forecast, by Country 2020 & 2033
- Table 36: GCC Healthcare Financial Software Industry Revenue (Million) Forecast, by Application 2020 & 2033
- Table 37: South Africa Healthcare Financial Software Industry Revenue (Million) Forecast, by Application 2020 & 2033
- Table 38: Rest of Middle East and Africa Healthcare Financial Software Industry Revenue (Million) Forecast, by Application 2020 & 2033
- Table 39: Global Healthcare Financial Software Industry Revenue Million Forecast, by Type 2020 & 2033
- Table 40: Global Healthcare Financial Software Industry Revenue Million Forecast, by Component 2020 & 2033
- Table 41: Global Healthcare Financial Software Industry Revenue Million Forecast, by Deployment 2020 & 2033
- Table 42: Global Healthcare Financial Software Industry Revenue Million Forecast, by Country 2020 & 2033
- Table 43: Brazil Healthcare Financial Software Industry Revenue (Million) Forecast, by Application 2020 & 2033
- Table 44: Argentina Healthcare Financial Software Industry Revenue (Million) Forecast, by Application 2020 & 2033
- Table 45: Rest of South America Healthcare Financial Software Industry Revenue (Million) Forecast, by Application 2020 & 2033
Frequently Asked Questions
1. What is the projected Compound Annual Growth Rate (CAGR) of the Healthcare Financial Software Industry?
The projected CAGR is approximately 25.00%.
2. Which companies are prominent players in the Healthcare Financial Software Industry?
Key companies in the market include CVS Health, SAS Institute Inc, Mckesson Corporation, Allscripts Healthcare Solutions, Verisk Analytics Inc, Inovalon*List Not Exhaustive, Cerner Corporation, Optum Inc, Oracle Corporation, Health Catalyst, CitiusTech Inc, IBM.
3. What are the main segments of the Healthcare Financial Software Industry?
The market segments include Type, Component, Deployment.
4. Can you provide details about the market size?
The market size is estimated to be USD 17.64 Million as of 2022.
5. What are some drivers contributing to market growth?
Emergence of Big Data in Healthcare; Growing Awareness For Digital Technologies; Technological Advancements Making Data Handling Easy.
6. What are the notable trends driving market growth?
Cloud Based Segment is Expected to Show Significant Growth over the Forecast Period.
7. Are there any restraints impacting market growth?
Lack of Properly Trained IT Professionals in Healthcare.
8. Can you provide examples of recent developments in the market?
In May 2022, the Clarify Health Institute is a cutting-edge research division established by Clarify Health, a leading cloud analytics, and value-based payments platform company, to provide practical analysis and data-driven insights on issues and trends affecting healthcare organizations, policymakers, and patients.
9. What pricing options are available for accessing the report?
Pricing options include single-user, multi-user, and enterprise licenses priced at USD 4750, USD 5250, and USD 8750 respectively.
10. Is the market size provided in terms of value or volume?
The market size is provided in terms of value, measured in Million.
11. Are there any specific market keywords associated with the report?
Yes, the market keyword associated with the report is "Healthcare Financial Software Industry," which aids in identifying and referencing the specific market segment covered.
12. How do I determine which pricing option suits my needs best?
The pricing options vary based on user requirements and access needs. Individual users may opt for single-user licenses, while businesses requiring broader access may choose multi-user or enterprise licenses for cost-effective access to the report.
13. Are there any additional resources or data provided in the Healthcare Financial Software Industry report?
While the report offers comprehensive insights, it's advisable to review the specific contents or supplementary materials provided to ascertain if additional resources or data are available.
14. How can I stay updated on further developments or reports in the Healthcare Financial Software Industry?
To stay informed about further developments, trends, and reports in the Healthcare Financial Software Industry, consider subscribing to industry newsletters, following relevant companies and organizations, or regularly checking reputable industry news sources and publications.
Methodology
Step 1 - Identification of Relevant Samples Size from Population Database


Step 2 - Approaches for Defining Global Market Size (Value, Volume* & Price*)

Note*: In applicable scenarios
Step 3 - Data Sources
Primary Research
- Web Analytics
- Survey Reports
- Research Institute
- Latest Research Reports
- Opinion Leaders
Secondary Research
- Annual Reports
- White Paper
- Latest Press Release
- Industry Association
- Paid Database
- Investor Presentations

Step 4 - Data Triangulation
Involves using different sources of information in order to increase the validity of a study
These sources are likely to be stakeholders in a program - participants, other researchers, program staff, other community members, and so on.
Then we put all data in single framework & apply various statistical tools to find out the dynamic on the market.
During the analysis stage, feedback from the stakeholder groups would be compared to determine areas of agreement as well as areas of divergence