

Key Insights
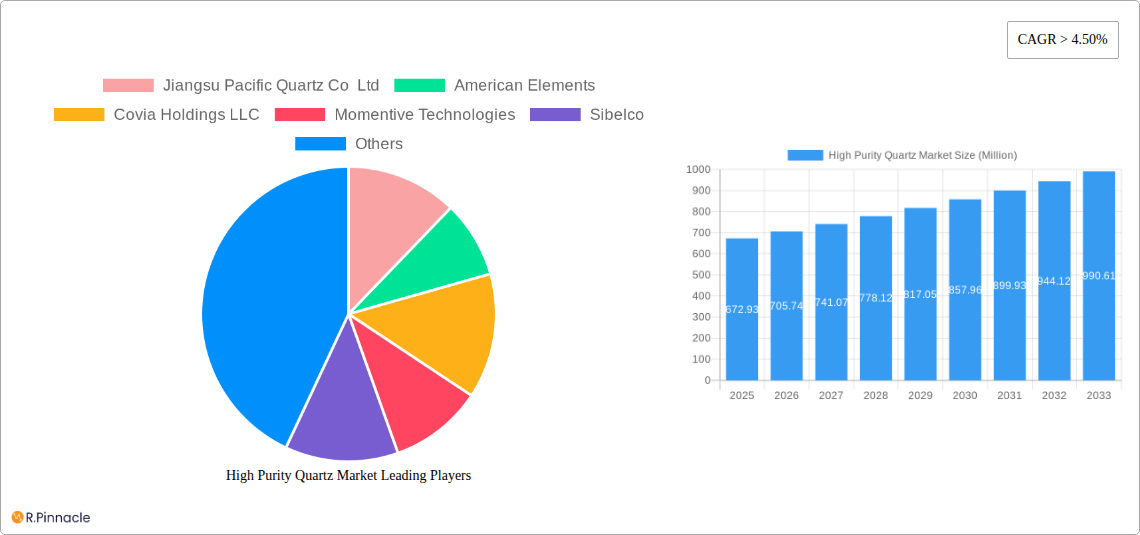
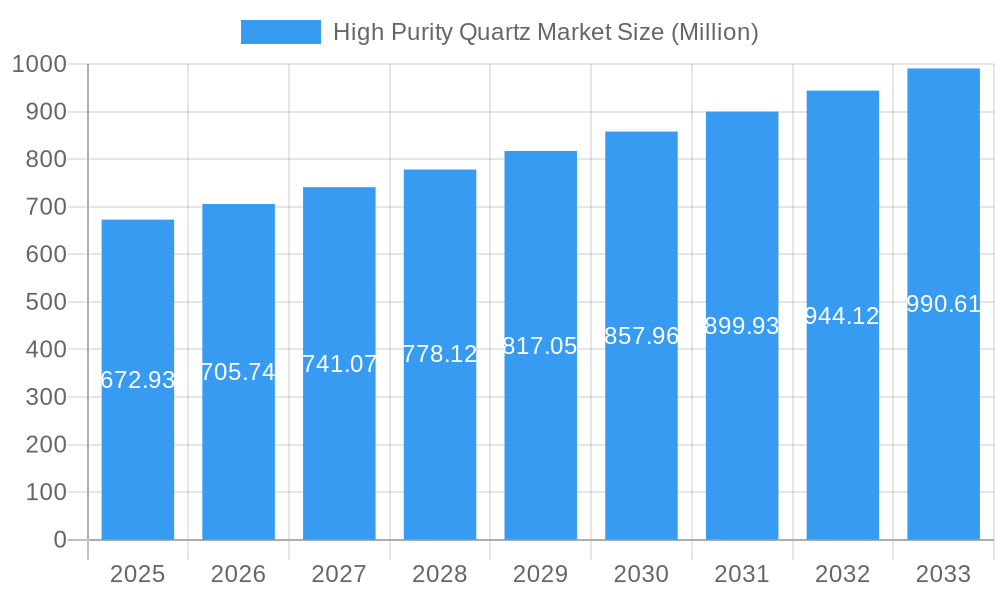
The high-purity quartz market, valued at $672.93 million in 2025, is projected to experience robust growth, driven by escalating demand from key sectors like semiconductors, solar energy, and telecommunications. A compound annual growth rate (CAGR) exceeding 4.50% from 2025 to 2033 signifies a significant expansion of this market. This growth is primarily fueled by the increasing adoption of advanced technologies requiring high-purity quartz for their manufacturing processes. The semiconductor industry, a major consumer of high-purity quartz for wafer fabrication, is a key driver, along with the expanding renewable energy sector utilizing this material in solar panel production. Furthermore, the telecom and optics industries rely heavily on high-purity quartz fibers for high-speed data transmission and advanced optical applications. While potential supply chain constraints and price volatility of raw materials could act as restraints, technological advancements aimed at improving purity and yield, coupled with strategic partnerships and expansion in key regions, are expected to mitigate these challenges. The market is segmented by application (semiconductor, solar, lighting, telecom & optics, microelectronics, others) and geography (North America, Europe, Asia-Pacific, South America, and MEA). Leading companies like Jiangsu Pacific Quartz Co Ltd, American Elements, and Momentive Technologies are actively shaping the market landscape through innovation and strategic acquisitions.
High Purity Quartz Market Market Size (In Million)
The Asia-Pacific region, particularly China, is anticipated to dominate the high-purity quartz market owing to its strong manufacturing base and substantial investments in semiconductor and solar energy infrastructure. North America and Europe are also significant markets, characterized by high technological advancements and stringent quality standards. However, emerging economies in South America and the MEA region present lucrative growth opportunities as these regions invest in infrastructure development and technological upgrades. The forecast period of 2025-2033 will likely witness further consolidation in the market as leading players engage in mergers and acquisitions to strengthen their market positions and expand their product portfolios. Continuous innovation in purification techniques and the development of novel applications for high-purity quartz are expected to further fuel market expansion during this period.
High Purity Quartz Market Company Market Share
High Purity Quartz Market: A Comprehensive Report (2019-2033)
This in-depth report provides a comprehensive analysis of the High Purity Quartz (HPQ) market, offering invaluable insights for industry professionals, investors, and strategists. Covering the period 2019-2033, with a base year of 2025 and a forecast period of 2025-2033, this report meticulously examines market dynamics, trends, and future opportunities. The study leverages rigorous data analysis to present actionable intelligence, empowering stakeholders to make informed decisions within this dynamic sector.
High Purity Quartz Market Structure & Innovation Trends
This section analyzes the competitive landscape of the HPQ market, exploring market concentration, innovation drivers, regulatory frameworks, and key industry activities. We delve into market share dynamics, identifying leading players and assessing the impact of mergers and acquisitions (M&A) on market structure. The report also examines the influence of technological advancements, product substitutes, and evolving end-user demographics.
- Market Concentration: The HPQ market exhibits a moderately concentrated structure, with a few major players holding significant market share. Precise market share data for each company will be detailed in the full report. Estimated market concentration ratio (CR4) for 2025 is xx%.
- Innovation Drivers: Continuous advancements in semiconductor manufacturing, solar energy technologies, and optical communication systems are key drivers of innovation within the HPQ market. This leads to the development of HPQ with enhanced purity levels and specialized properties.
- Regulatory Framework: Government regulations concerning environmental protection and material sourcing significantly impact HPQ production and supply chains. A detailed analysis of relevant regulations across key regions is provided in the full report.
- Product Substitutes: While HPQ possesses unique properties essential for many applications, the report examines potential substitutes and their market impact, including their limitations and cost implications.
- M&A Activity: The report documents significant M&A activities in the HPQ market, including deal values and their influence on market consolidation. For instance, the USD 200 Million investment by Sibelco exemplifies significant investment in capacity expansion.
- End-User Demographics: Analysis of end-user demographics across various segments (Semiconductor, Solar, etc.) provides crucial insights for targeted marketing strategies.
High Purity Quartz Market Dynamics & Trends
This section provides a detailed analysis of market growth drivers, technological advancements, shifting consumer preferences, and competitive pressures within the HPQ market. The report presents a comprehensive overview of the market's evolution, incorporating key performance indicators (KPIs) such as Compound Annual Growth Rate (CAGR) and market penetration rates. Specific factors contributing to market growth, including technological disruptions and changes in consumer demands are also explored. The projected CAGR for the forecast period (2025-2033) is estimated to be xx%. Market penetration analysis across different application segments is included in the full report.
Dominant Regions & Segments in High Purity Quartz Market
This section identifies leading regions and segments within the HPQ market. Detailed analysis will highlight the factors driving dominance in specific regions and application areas.
- Leading Region: [Region Name, e.g., North America] is currently the dominant region due to [Reasons for Dominance, e.g., strong semiconductor industry, substantial investments in renewable energy].
- Leading Segment: The [Segment Name, e.g., Semiconductor] segment represents the largest share of the HPQ market, driven by [Reasons for Dominance, e.g., the increasing demand for high-performance chips and advanced semiconductor devices].
Key Drivers (by segment - examples):
- Semiconductor: Advancements in integrated circuit fabrication, increasing demand for 5G and AI applications.
- Solar: Rising adoption of solar power, government incentives for renewable energy.
- Lighting: Growth of LED lighting technology, demand for energy-efficient lighting solutions.
- Telecom & Optics: Expansion of fiber optic networks, advancements in optical communication technologies.
- Microelectronics: Increasing demand for miniaturized electronic components and higher precision in manufacturing.
- Others: Growth in specialized applications across various industries (e.g., glass manufacturing, precision instruments).
Each segment's detailed dominance analysis includes market size projections, growth drivers, competitive dynamics, and future prospects.
High Purity Quartz Market Product Innovations
The HPQ market is characterized by continuous product innovations, focusing on enhanced purity levels, improved crystal structure, and tailored properties for specific applications. Recent developments include advancements in crystal growth techniques, leading to higher yields and reduced defects. These innovations directly impact product performance and market competitiveness. The focus is on achieving higher purity levels and improved crystal quality to meet the increasing demand from sophisticated applications.
Report Scope & Segmentation Analysis
This report segments the HPQ market by application: Semiconductor, Solar, Lighting, Telecom and Optics, Microelectronics, and Others. Each segment's detailed analysis includes growth projections, market size estimations for the forecast period (2025-2033), and a competitive landscape assessment. The report provides a granular view of market dynamics within each application area, encompassing key players, growth drivers, and challenges. Each segment will have a dedicated analysis detailing its market size, growth projections, and competitive landscape.
Key Drivers of High Purity Quartz Market Growth
The HPQ market is fueled by several key growth drivers:
- Technological Advancements: Continued advancements in semiconductor manufacturing, solar energy, and optical communications necessitate the use of high-purity quartz, driving demand.
- Economic Growth: Global economic expansion, particularly in developing economies, fuels increased demand for electronic devices and renewable energy solutions.
- Favorable Government Policies: Government initiatives promoting renewable energy and technological advancements create favorable market conditions.
Challenges in the High Purity Quartz Market Sector
The HPQ market faces certain challenges:
- Supply Chain Disruptions: Geopolitical uncertainties and natural resource availability can cause supply chain disruptions, impacting production and market stability.
- Price Volatility: Fluctuations in raw material costs and energy prices affect the overall cost of HPQ production and market pricing.
- Stringent Quality Standards: Maintaining consistent high-purity standards across the entire production process requires substantial investment and rigorous quality control.
Emerging Opportunities in High Purity Quartz Market
Emerging opportunities in the HPQ market include:
- Expansion into New Applications: Exploring new applications of HPQ in diverse sectors, such as advanced materials and medical devices.
- Technological Innovation: Developing innovative production methods that improve yield, reduce costs, and enhance the properties of HPQ.
- Strategic Partnerships: Collaboration between HPQ producers and end-users to develop customized materials and solutions.
Leading Players in the High Purity Quartz Market Market
- Jiangsu Pacific Quartz Co Ltd
- American Elements
- Covia Holdings LLC
- Momentive Technologies
- Sibelco
- Imerys
- ULTRA HPQ
- Russian Quartz LLC
- Australian Silica Quartz Group Ltd
- The Quartz Corp
Key Developments in High Purity Quartz Market Industry
- April 2023: Sibelco announced an investment of approximately USD 200 Million to double its high-purity quartz installed capacity at its Spruce Pine facility in North Carolina, United States. This expansion significantly increases production capacity and strengthens Sibelco's position in the HPQ market.
Future Outlook for High Purity Quartz Market Market
The future outlook for the HPQ market is positive, driven by continued technological advancements, strong demand from various application segments, and strategic investments from key players. The market is expected to witness sustained growth throughout the forecast period, fueled by emerging applications and increasing demand for high-performance materials. The market's trajectory is strongly tied to technological innovation and global economic growth.
High Purity Quartz Market Segmentation
-
1. Application
- 1.1. Semiconductor
- 1.2. Solar
- 1.3. Lighting
- 1.4. Telecom and Optics
- 1.5. Microelectronics
- 1.6. Others
High Purity Quartz Market Segmentation By Geography
-
1. Asia Pacific
- 1.1. China
- 1.2. India
- 1.3. Japan
- 1.4. South Korea
- 1.5. Rest of Asia Pacific
-
2. North America
- 2.1. United States
- 2.2. Canada
- 2.3. Mexico
-
3. Europe
- 3.1. Germany
- 3.2. United Kingdom
- 3.3. Italy
- 3.4. France
- 3.5. Rest of Europe
-
4. South America
- 4.1. Brazil
- 4.2. Argentina
- 4.3. Rest of South America
-
5. Middle East and Africa
- 5.1. Saudi Arabia
- 5.2. South Africa
- 5.3. Rest of Middle East and Africa
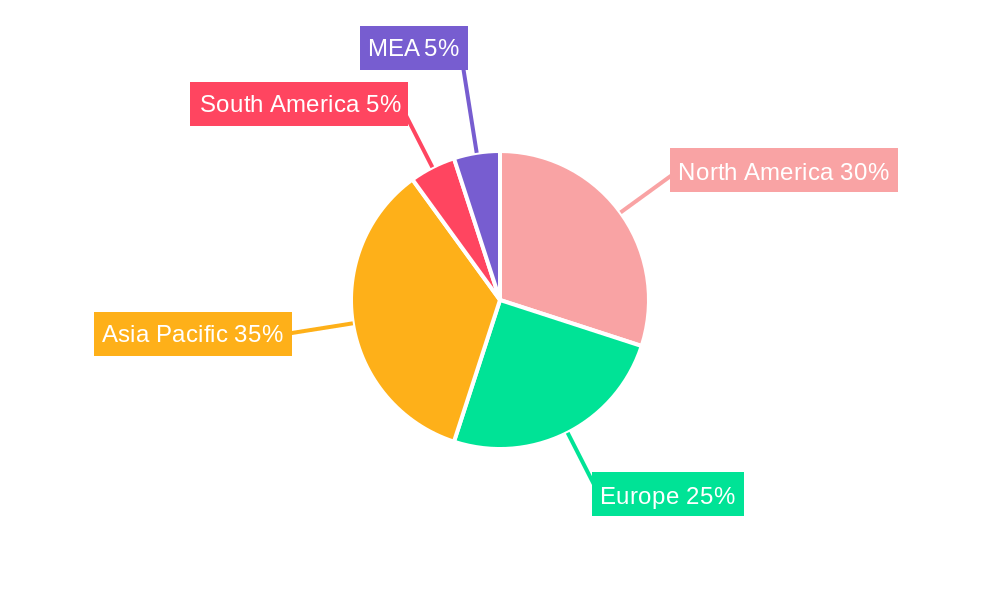
High Purity Quartz Market Regional Market Share
Geographic Coverage of High Purity Quartz Market
High Purity Quartz Market REPORT HIGHLIGHTS
| Aspects | Details |
|---|---|
| Study Period | 2020-2034 |
| Base Year | 2025 |
| Estimated Year | 2026 |
| Forecast Period | 2026-2034 |
| Historical Period | 2020-2025 |
| Growth Rate | CAGR of > 4.50% from 2020-2034 |
| Segmentation |
|
Table of Contents
- 1. Introduction
- 1.1. Research Scope
- 1.2. Market Segmentation
- 1.3. Research Objective
- 1.4. Definitions and Assumptions
- 2. Executive Summary
- 2.1. Market Snapshot
- 3. Market Dynamics
- 3.1. Market Drivers
- 3.2. Market Restrains
- 3.3. Market Trends
- 3.4. Market Opportunities
- 4. Market Factor Analysis
- 4.1. Porters Five Forces
- 4.1.1. Bargaining Power of Suppliers
- 4.1.2. Bargaining Power of Buyers
- 4.1.3. Threat of New Entrants
- 4.1.4. Threat of Substitutes
- 4.1.5. Competitive Rivalry
- 4.2. PESTEL analysis
- 4.3. BCG Analysis
- 4.3.1. Stars (High Growth, High Market Share)
- 4.3.2. Cash Cows (Low Growth, High Market Share)
- 4.3.3. Question Mark (High Growth, Low Market Share)
- 4.3.4. Dogs (Low Growth, Low Market Share)
- 4.4. Ansoff Matrix Analysis
- 4.5. Supply Chain Analysis
- 4.6. Regulatory Landscape
- 4.7. Current Market Potential and Opportunity Assessment (TAM–SAM–SOM Framework)
- 4.8. PRI Analyst Note
- 4.1. Porters Five Forces
- 5. Market Analysis, Insights and Forecast 2021-2033
- 5.1. Market Analysis, Insights and Forecast - by Application
- 5.1.1. Semiconductor
- 5.1.2. Solar
- 5.1.3. Lighting
- 5.1.4. Telecom and Optics
- 5.1.5. Microelectronics
- 5.1.6. Others
- 5.2. Market Analysis, Insights and Forecast - by Region
- 5.2.1. Asia Pacific
- 5.2.2. North America
- 5.2.3. Europe
- 5.2.4. South America
- 5.2.5. Middle East and Africa
- 5.1. Market Analysis, Insights and Forecast - by Application
- 6. Global High Purity Quartz Market Analysis, Insights and Forecast, 2021-2033
- 6.1. Market Analysis, Insights and Forecast - by Application
- 6.1.1. Semiconductor
- 6.1.2. Solar
- 6.1.3. Lighting
- 6.1.4. Telecom and Optics
- 6.1.5. Microelectronics
- 6.1.6. Others
- 6.1. Market Analysis, Insights and Forecast - by Application
- 7. Asia Pacific High Purity Quartz Market Analysis, Insights and Forecast, 2020-2032
- 7.1. Market Analysis, Insights and Forecast - by Application
- 7.1.1. Semiconductor
- 7.1.2. Solar
- 7.1.3. Lighting
- 7.1.4. Telecom and Optics
- 7.1.5. Microelectronics
- 7.1.6. Others
- 7.1. Market Analysis, Insights and Forecast - by Application
- 8. North America High Purity Quartz Market Analysis, Insights and Forecast, 2020-2032
- 8.1. Market Analysis, Insights and Forecast - by Application
- 8.1.1. Semiconductor
- 8.1.2. Solar
- 8.1.3. Lighting
- 8.1.4. Telecom and Optics
- 8.1.5. Microelectronics
- 8.1.6. Others
- 8.1. Market Analysis, Insights and Forecast - by Application
- 9. Europe High Purity Quartz Market Analysis, Insights and Forecast, 2020-2032
- 9.1. Market Analysis, Insights and Forecast - by Application
- 9.1.1. Semiconductor
- 9.1.2. Solar
- 9.1.3. Lighting
- 9.1.4. Telecom and Optics
- 9.1.5. Microelectronics
- 9.1.6. Others
- 9.1. Market Analysis, Insights and Forecast - by Application
- 10. South America High Purity Quartz Market Analysis, Insights and Forecast, 2020-2032
- 10.1. Market Analysis, Insights and Forecast - by Application
- 10.1.1. Semiconductor
- 10.1.2. Solar
- 10.1.3. Lighting
- 10.1.4. Telecom and Optics
- 10.1.5. Microelectronics
- 10.1.6. Others
- 10.1. Market Analysis, Insights and Forecast - by Application
- 11. Middle East and Africa High Purity Quartz Market Analysis, Insights and Forecast, 2020-2032
- 11.1. Market Analysis, Insights and Forecast - by Application
- 11.1.1. Semiconductor
- 11.1.2. Solar
- 11.1.3. Lighting
- 11.1.4. Telecom and Optics
- 11.1.5. Microelectronics
- 11.1.6. Others
- 11.1. Market Analysis, Insights and Forecast - by Application
- 12. Competitive Analysis
- 12.1. Company Profiles
- 12.1.1 Jiangsu Pacific Quartz Co Ltd
- 12.1.1.1. Company Overview
- 12.1.1.2. Products
- 12.1.1.3. Company Financials
- 12.1.1.4. SWOT Analysis
- 12.1.2 American Elements
- 12.1.2.1. Company Overview
- 12.1.2.2. Products
- 12.1.2.3. Company Financials
- 12.1.2.4. SWOT Analysis
- 12.1.3 Covia Holdings LLC
- 12.1.3.1. Company Overview
- 12.1.3.2. Products
- 12.1.3.3. Company Financials
- 12.1.3.4. SWOT Analysis
- 12.1.4 Momentive Technologies
- 12.1.4.1. Company Overview
- 12.1.4.2. Products
- 12.1.4.3. Company Financials
- 12.1.4.4. SWOT Analysis
- 12.1.5 Sibelco
- 12.1.5.1. Company Overview
- 12.1.5.2. Products
- 12.1.5.3. Company Financials
- 12.1.5.4. SWOT Analysis
- 12.1.6 Imerys
- 12.1.6.1. Company Overview
- 12.1.6.2. Products
- 12.1.6.3. Company Financials
- 12.1.6.4. SWOT Analysis
- 12.1.7 ULTRA HPQ
- 12.1.7.1. Company Overview
- 12.1.7.2. Products
- 12.1.7.3. Company Financials
- 12.1.7.4. SWOT Analysis
- 12.1.8 Russian Quartz LLC
- 12.1.8.1. Company Overview
- 12.1.8.2. Products
- 12.1.8.3. Company Financials
- 12.1.8.4. SWOT Analysis
- 12.1.9 Australian Silica Quartz Group Ltd
- 12.1.9.1. Company Overview
- 12.1.9.2. Products
- 12.1.9.3. Company Financials
- 12.1.9.4. SWOT Analysis
- 12.1.10 The Quartz Corp
- 12.1.10.1. Company Overview
- 12.1.10.2. Products
- 12.1.10.3. Company Financials
- 12.1.10.4. SWOT Analysis
- 12.1.1 Jiangsu Pacific Quartz Co Ltd
- 12.2. Market Entropy
- 12.2.1 Company's Key Areas Served
- 12.2.2 Recent Developments
- 12.3. Company Market Share Analysis 2025
- 12.3.1 Top 5 Companies Market Share Analysis
- 12.3.2 Top 3 Companies Market Share Analysis
- 12.4. List of Potential Customers
- 13. Research Methodology
List of Figures
- Figure 1: Global High Purity Quartz Market Revenue Breakdown (Million, %) by Region 2025 & 2033
- Figure 2: Global High Purity Quartz Market Volume Breakdown (K Tons, %) by Region 2025 & 2033
- Figure 3: Asia Pacific High Purity Quartz Market Revenue (Million), by Application 2025 & 2033
- Figure 4: Asia Pacific High Purity Quartz Market Volume (K Tons), by Application 2025 & 2033
- Figure 5: Asia Pacific High Purity Quartz Market Revenue Share (%), by Application 2025 & 2033
- Figure 6: Asia Pacific High Purity Quartz Market Volume Share (%), by Application 2025 & 2033
- Figure 7: Asia Pacific High Purity Quartz Market Revenue (Million), by Country 2025 & 2033
- Figure 8: Asia Pacific High Purity Quartz Market Volume (K Tons), by Country 2025 & 2033
- Figure 9: Asia Pacific High Purity Quartz Market Revenue Share (%), by Country 2025 & 2033
- Figure 10: Asia Pacific High Purity Quartz Market Volume Share (%), by Country 2025 & 2033
- Figure 11: North America High Purity Quartz Market Revenue (Million), by Application 2025 & 2033
- Figure 12: North America High Purity Quartz Market Volume (K Tons), by Application 2025 & 2033
- Figure 13: North America High Purity Quartz Market Revenue Share (%), by Application 2025 & 2033
- Figure 14: North America High Purity Quartz Market Volume Share (%), by Application 2025 & 2033
- Figure 15: North America High Purity Quartz Market Revenue (Million), by Country 2025 & 2033
- Figure 16: North America High Purity Quartz Market Volume (K Tons), by Country 2025 & 2033
- Figure 17: North America High Purity Quartz Market Revenue Share (%), by Country 2025 & 2033
- Figure 18: North America High Purity Quartz Market Volume Share (%), by Country 2025 & 2033
- Figure 19: Europe High Purity Quartz Market Revenue (Million), by Application 2025 & 2033
- Figure 20: Europe High Purity Quartz Market Volume (K Tons), by Application 2025 & 2033
- Figure 21: Europe High Purity Quartz Market Revenue Share (%), by Application 2025 & 2033
- Figure 22: Europe High Purity Quartz Market Volume Share (%), by Application 2025 & 2033
- Figure 23: Europe High Purity Quartz Market Revenue (Million), by Country 2025 & 2033
- Figure 24: Europe High Purity Quartz Market Volume (K Tons), by Country 2025 & 2033
- Figure 25: Europe High Purity Quartz Market Revenue Share (%), by Country 2025 & 2033
- Figure 26: Europe High Purity Quartz Market Volume Share (%), by Country 2025 & 2033
- Figure 27: South America High Purity Quartz Market Revenue (Million), by Application 2025 & 2033
- Figure 28: South America High Purity Quartz Market Volume (K Tons), by Application 2025 & 2033
- Figure 29: South America High Purity Quartz Market Revenue Share (%), by Application 2025 & 2033
- Figure 30: South America High Purity Quartz Market Volume Share (%), by Application 2025 & 2033
- Figure 31: South America High Purity Quartz Market Revenue (Million), by Country 2025 & 2033
- Figure 32: South America High Purity Quartz Market Volume (K Tons), by Country 2025 & 2033
- Figure 33: South America High Purity Quartz Market Revenue Share (%), by Country 2025 & 2033
- Figure 34: South America High Purity Quartz Market Volume Share (%), by Country 2025 & 2033
- Figure 35: Middle East and Africa High Purity Quartz Market Revenue (Million), by Application 2025 & 2033
- Figure 36: Middle East and Africa High Purity Quartz Market Volume (K Tons), by Application 2025 & 2033
- Figure 37: Middle East and Africa High Purity Quartz Market Revenue Share (%), by Application 2025 & 2033
- Figure 38: Middle East and Africa High Purity Quartz Market Volume Share (%), by Application 2025 & 2033
- Figure 39: Middle East and Africa High Purity Quartz Market Revenue (Million), by Country 2025 & 2033
- Figure 40: Middle East and Africa High Purity Quartz Market Volume (K Tons), by Country 2025 & 2033
- Figure 41: Middle East and Africa High Purity Quartz Market Revenue Share (%), by Country 2025 & 2033
- Figure 42: Middle East and Africa High Purity Quartz Market Volume Share (%), by Country 2025 & 2033
List of Tables
- Table 1: Global High Purity Quartz Market Revenue Million Forecast, by Application 2020 & 2033
- Table 2: Global High Purity Quartz Market Volume K Tons Forecast, by Application 2020 & 2033
- Table 3: Global High Purity Quartz Market Revenue Million Forecast, by Region 2020 & 2033
- Table 4: Global High Purity Quartz Market Volume K Tons Forecast, by Region 2020 & 2033
- Table 5: Global High Purity Quartz Market Revenue Million Forecast, by Application 2020 & 2033
- Table 6: Global High Purity Quartz Market Volume K Tons Forecast, by Application 2020 & 2033
- Table 7: Global High Purity Quartz Market Revenue Million Forecast, by Country 2020 & 2033
- Table 8: Global High Purity Quartz Market Volume K Tons Forecast, by Country 2020 & 2033
- Table 9: China High Purity Quartz Market Revenue (Million) Forecast, by Application 2020 & 2033
- Table 10: China High Purity Quartz Market Volume (K Tons) Forecast, by Application 2020 & 2033
- Table 11: India High Purity Quartz Market Revenue (Million) Forecast, by Application 2020 & 2033
- Table 12: India High Purity Quartz Market Volume (K Tons) Forecast, by Application 2020 & 2033
- Table 13: Japan High Purity Quartz Market Revenue (Million) Forecast, by Application 2020 & 2033
- Table 14: Japan High Purity Quartz Market Volume (K Tons) Forecast, by Application 2020 & 2033
- Table 15: South Korea High Purity Quartz Market Revenue (Million) Forecast, by Application 2020 & 2033
- Table 16: South Korea High Purity Quartz Market Volume (K Tons) Forecast, by Application 2020 & 2033
- Table 17: Rest of Asia Pacific High Purity Quartz Market Revenue (Million) Forecast, by Application 2020 & 2033
- Table 18: Rest of Asia Pacific High Purity Quartz Market Volume (K Tons) Forecast, by Application 2020 & 2033
- Table 19: Global High Purity Quartz Market Revenue Million Forecast, by Application 2020 & 2033
- Table 20: Global High Purity Quartz Market Volume K Tons Forecast, by Application 2020 & 2033
- Table 21: Global High Purity Quartz Market Revenue Million Forecast, by Country 2020 & 2033
- Table 22: Global High Purity Quartz Market Volume K Tons Forecast, by Country 2020 & 2033
- Table 23: United States High Purity Quartz Market Revenue (Million) Forecast, by Application 2020 & 2033
- Table 24: United States High Purity Quartz Market Volume (K Tons) Forecast, by Application 2020 & 2033
- Table 25: Canada High Purity Quartz Market Revenue (Million) Forecast, by Application 2020 & 2033
- Table 26: Canada High Purity Quartz Market Volume (K Tons) Forecast, by Application 2020 & 2033
- Table 27: Mexico High Purity Quartz Market Revenue (Million) Forecast, by Application 2020 & 2033
- Table 28: Mexico High Purity Quartz Market Volume (K Tons) Forecast, by Application 2020 & 2033
- Table 29: Global High Purity Quartz Market Revenue Million Forecast, by Application 2020 & 2033
- Table 30: Global High Purity Quartz Market Volume K Tons Forecast, by Application 2020 & 2033
- Table 31: Global High Purity Quartz Market Revenue Million Forecast, by Country 2020 & 2033
- Table 32: Global High Purity Quartz Market Volume K Tons Forecast, by Country 2020 & 2033
- Table 33: Germany High Purity Quartz Market Revenue (Million) Forecast, by Application 2020 & 2033
- Table 34: Germany High Purity Quartz Market Volume (K Tons) Forecast, by Application 2020 & 2033
- Table 35: United Kingdom High Purity Quartz Market Revenue (Million) Forecast, by Application 2020 & 2033
- Table 36: United Kingdom High Purity Quartz Market Volume (K Tons) Forecast, by Application 2020 & 2033
- Table 37: Italy High Purity Quartz Market Revenue (Million) Forecast, by Application 2020 & 2033
- Table 38: Italy High Purity Quartz Market Volume (K Tons) Forecast, by Application 2020 & 2033
- Table 39: France High Purity Quartz Market Revenue (Million) Forecast, by Application 2020 & 2033
- Table 40: France High Purity Quartz Market Volume (K Tons) Forecast, by Application 2020 & 2033
- Table 41: Rest of Europe High Purity Quartz Market Revenue (Million) Forecast, by Application 2020 & 2033
- Table 42: Rest of Europe High Purity Quartz Market Volume (K Tons) Forecast, by Application 2020 & 2033
- Table 43: Global High Purity Quartz Market Revenue Million Forecast, by Application 2020 & 2033
- Table 44: Global High Purity Quartz Market Volume K Tons Forecast, by Application 2020 & 2033
- Table 45: Global High Purity Quartz Market Revenue Million Forecast, by Country 2020 & 2033
- Table 46: Global High Purity Quartz Market Volume K Tons Forecast, by Country 2020 & 2033
- Table 47: Brazil High Purity Quartz Market Revenue (Million) Forecast, by Application 2020 & 2033
- Table 48: Brazil High Purity Quartz Market Volume (K Tons) Forecast, by Application 2020 & 2033
- Table 49: Argentina High Purity Quartz Market Revenue (Million) Forecast, by Application 2020 & 2033
- Table 50: Argentina High Purity Quartz Market Volume (K Tons) Forecast, by Application 2020 & 2033
- Table 51: Rest of South America High Purity Quartz Market Revenue (Million) Forecast, by Application 2020 & 2033
- Table 52: Rest of South America High Purity Quartz Market Volume (K Tons) Forecast, by Application 2020 & 2033
- Table 53: Global High Purity Quartz Market Revenue Million Forecast, by Application 2020 & 2033
- Table 54: Global High Purity Quartz Market Volume K Tons Forecast, by Application 2020 & 2033
- Table 55: Global High Purity Quartz Market Revenue Million Forecast, by Country 2020 & 2033
- Table 56: Global High Purity Quartz Market Volume K Tons Forecast, by Country 2020 & 2033
- Table 57: Saudi Arabia High Purity Quartz Market Revenue (Million) Forecast, by Application 2020 & 2033
- Table 58: Saudi Arabia High Purity Quartz Market Volume (K Tons) Forecast, by Application 2020 & 2033
- Table 59: South Africa High Purity Quartz Market Revenue (Million) Forecast, by Application 2020 & 2033
- Table 60: South Africa High Purity Quartz Market Volume (K Tons) Forecast, by Application 2020 & 2033
- Table 61: Rest of Middle East and Africa High Purity Quartz Market Revenue (Million) Forecast, by Application 2020 & 2033
- Table 62: Rest of Middle East and Africa High Purity Quartz Market Volume (K Tons) Forecast, by Application 2020 & 2033
Frequently Asked Questions
1. What is the projected Compound Annual Growth Rate (CAGR) of the High Purity Quartz Market?
The projected CAGR is approximately > 4.50%.
2. Which companies are prominent players in the High Purity Quartz Market?
Key companies in the market include Jiangsu Pacific Quartz Co Ltd, American Elements, Covia Holdings LLC, Momentive Technologies, Sibelco, Imerys, ULTRA HPQ, Russian Quartz LLC, Australian Silica Quartz Group Ltd, The Quartz Corp.
3. What are the main segments of the High Purity Quartz Market?
The market segments include Application.
4. Can you provide details about the market size?
The market size is estimated to be USD 672.93 Million as of 2022.
5. What are some drivers contributing to market growth?
Growing Demand for Semiconductor ICs; Increasing Adoption in Solar Industry; Other Drivers.
6. What are the notable trends driving market growth?
Growing Demand from Semiconductor Industry.
7. Are there any restraints impacting market growth?
The Fluctuating Prices of Raw Materials; Other Restraints.
8. Can you provide examples of recent developments in the market?
April 2023: Sibelco announced an investment of approx. USD 200 million to double high purity quartz (HPQ) installed capacity at its Spruce Pine facility in North Carolina, United States.
9. What pricing options are available for accessing the report?
Pricing options include single-user, multi-user, and enterprise licenses priced at USD 4750, USD 5250, and USD 8750 respectively.
10. Is the market size provided in terms of value or volume?
The market size is provided in terms of value, measured in Million and volume, measured in K Tons.
11. Are there any specific market keywords associated with the report?
Yes, the market keyword associated with the report is "High Purity Quartz Market," which aids in identifying and referencing the specific market segment covered.
12. How do I determine which pricing option suits my needs best?
The pricing options vary based on user requirements and access needs. Individual users may opt for single-user licenses, while businesses requiring broader access may choose multi-user or enterprise licenses for cost-effective access to the report.
13. Are there any additional resources or data provided in the High Purity Quartz Market report?
While the report offers comprehensive insights, it's advisable to review the specific contents or supplementary materials provided to ascertain if additional resources or data are available.
14. How can I stay updated on further developments or reports in the High Purity Quartz Market?
To stay informed about further developments, trends, and reports in the High Purity Quartz Market, consider subscribing to industry newsletters, following relevant companies and organizations, or regularly checking reputable industry news sources and publications.
Methodology
Step 1 - Identification of Relevant Samples Size from Population Database


Step 2 - Approaches for Defining Global Market Size (Value, Volume* & Price*)

Note*: In applicable scenarios
Step 3 - Data Sources
Primary Research
- Web Analytics
- Survey Reports
- Research Institute
- Latest Research Reports
- Opinion Leaders
Secondary Research
- Annual Reports
- White Paper
- Latest Press Release
- Industry Association
- Paid Database
- Investor Presentations

Step 4 - Data Triangulation
Involves using different sources of information in order to increase the validity of a study
These sources are likely to be stakeholders in a program - participants, other researchers, program staff, other community members, and so on.
Then we put all data in single framework & apply various statistical tools to find out the dynamic on the market.
During the analysis stage, feedback from the stakeholder groups would be compared to determine areas of agreement as well as areas of divergence