

Key Insights
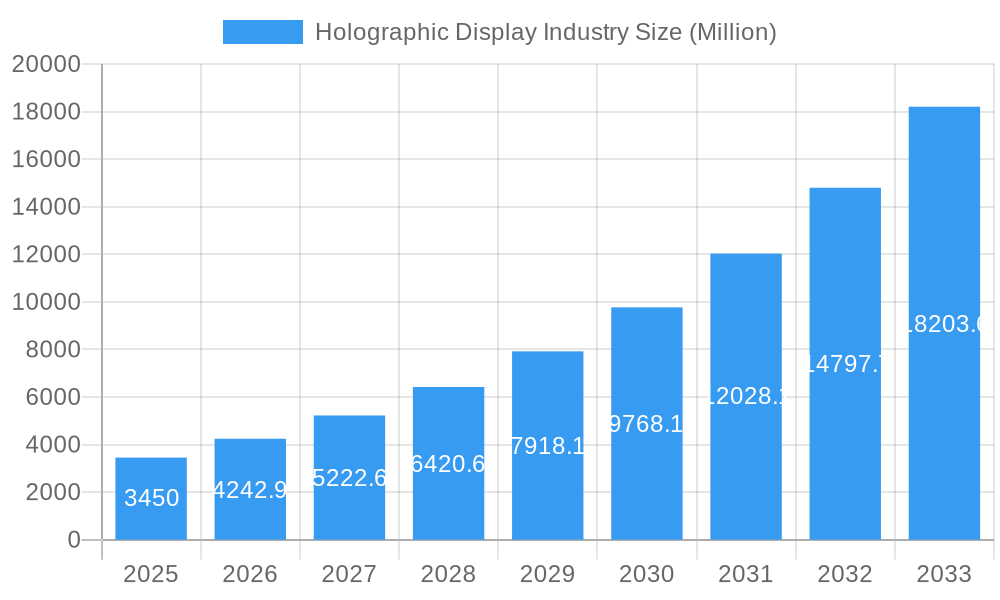
The holographic display market is experiencing rapid growth, projected to reach $3.45 billion in 2025 and maintain a robust Compound Annual Growth Rate (CAGR) of 23.12% from 2025 to 2033. This expansion is driven by increasing demand across diverse sectors, including consumer electronics (driven by advancements in AR/VR and gaming), retail (for immersive shopping experiences), media and entertainment (for captivating visual effects), military and defense (for advanced simulation and training), healthcare (for medical imaging and visualization), and automotive (for heads-up displays and infotainment systems). Technological advancements in laser projection, spatial light modulators, and improved display resolution are key enablers of this growth. The market is witnessing a shift towards more compact, energy-efficient, and cost-effective holographic display solutions, making them accessible to a wider range of applications. Furthermore, the increasing integration of artificial intelligence and machine learning is enhancing the capabilities of holographic displays, leading to more interactive and realistic experiences.
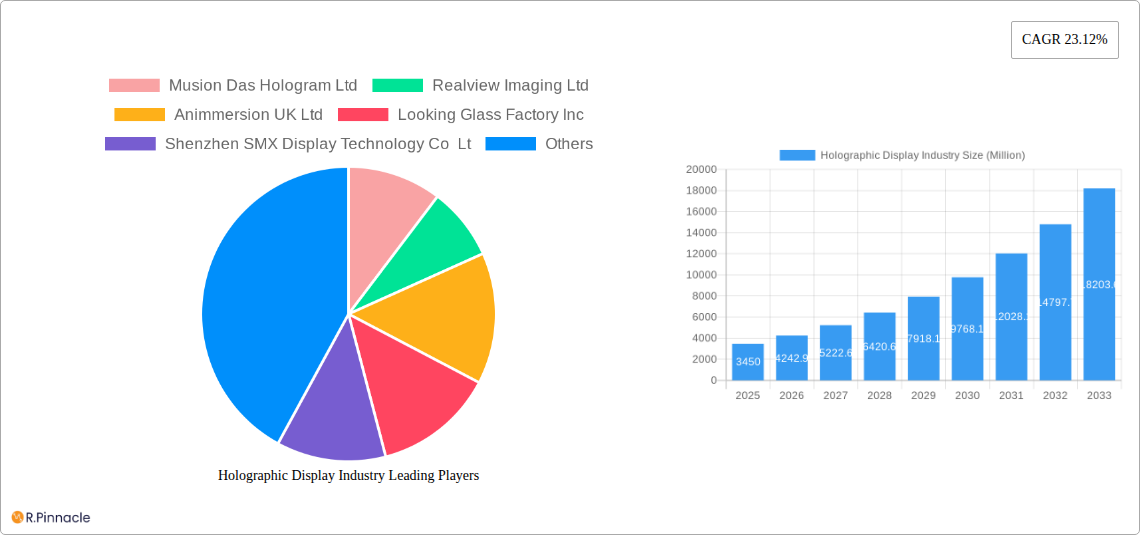
Holographic Display Industry Market Size (In Billion)
Despite the optimistic outlook, the market faces certain challenges. High manufacturing costs and the complexity of the technology remain barriers to broader adoption, particularly in price-sensitive markets. Furthermore, the need for specialized infrastructure and skilled professionals to develop and deploy holographic display systems can hinder market penetration, particularly in developing regions. Nevertheless, ongoing research and development efforts focused on reducing costs and simplifying implementation are expected to overcome these challenges, paving the way for a sustained period of growth and innovation in the holographic display industry. Major players like Musion Das Hologram Ltd, Realview Imaging Ltd, and others are strategically investing in R&D and expanding their market reach to capitalize on this burgeoning opportunity. The geographic distribution of the market is expected to see significant growth in Asia-Pacific, fueled by rising consumer demand and technological advancements in the region.
Holographic Display Industry Company Market Share
Holographic Display Industry: Market Report 2019-2033
This comprehensive report provides a detailed analysis of the holographic display industry, offering invaluable insights for industry professionals, investors, and strategic decision-makers. With a study period spanning 2019-2033, a base year of 2025, and a forecast period of 2025-2033, this report leverages historical data (2019-2024) to predict future market trends and growth opportunities within the rapidly evolving holographic display landscape. The report covers a market valued at $XX Million in 2025, projected to reach $XX Million by 2033. This detailed analysis encompasses market segmentation, competitive dynamics, technological advancements, and key regional trends.
Holographic Display Industry Market Structure & Innovation Trends
The holographic display market is characterized by a moderately concentrated structure, with key players like Musion Das Hologram Ltd, Realview Imaging Ltd, Animmersion UK Ltd, Looking Glass Factory Inc, Shenzhen SMX Display Technology Co Ltd, Kino-mo Limited (HYPERVSN), RealFiction Holding AB, and Provision Holding Inc. Market share data indicates that these companies collectively hold approximately xx% of the global market. However, the industry is experiencing significant innovation, driven by advancements in laser technology, 3D imaging, and augmented reality (AR)/virtual reality (VR) integration. Regulatory frameworks vary across regions, impacting product development and market penetration. Product substitutes, such as advanced projection systems and high-resolution displays, pose competitive challenges. The industry also sees consistent M&A activity, with deal values ranging from $xx Million to $xx Million in recent years, signifying ongoing consolidation and growth. The end-user demographics are expanding beyond entertainment and moving towards healthcare, automotive, and defense sectors, broadening the market’s application.
- Market Concentration: Moderately concentrated, with top players holding xx% market share.
- Innovation Drivers: Advancements in laser technology, 3D imaging, AR/VR integration.
- Regulatory Frameworks: Vary across regions, influencing market access.
- Product Substitutes: Advanced projection systems, high-resolution displays.
- M&A Activities: Significant activity with deal values ranging from $xx Million to $xx Million.
- End-user Demographics: Expanding into diverse sectors beyond entertainment.
Holographic Display Industry Market Dynamics & Trends
The holographic display market exhibits robust growth, driven primarily by increasing demand from the consumer electronics, retail, and media & entertainment sectors. Technological disruptions, particularly in areas like holographic projection and 3D display technology, are fueling market expansion. Consumer preferences are shifting towards immersive and interactive experiences, driving adoption of holographic displays. The market is highly competitive, with established players and emerging startups vying for market share. The compound annual growth rate (CAGR) is projected to be xx% during the forecast period, with market penetration steadily increasing across various end-user verticals.
Dominant Regions & Segments in Holographic Display Industry
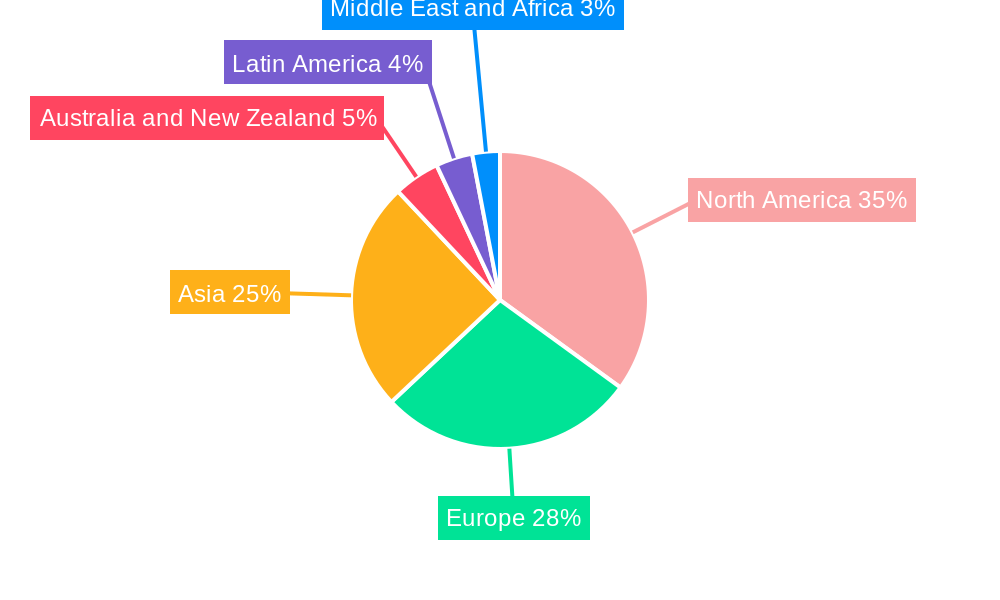
North America currently holds a dominant position in the holographic display market, driven by robust technological advancements, strong consumer demand, and significant investments in R&D. Key drivers for this dominance include favorable economic policies supporting technological innovation and a well-established infrastructure facilitating rapid deployment and adoption of holographic display technologies.
- North America: Strong R&D, high consumer demand, favorable economic policies.
- Europe: Growing adoption in automotive and healthcare, supportive government initiatives.
- Asia-Pacific: High growth potential due to rising disposable incomes and increasing demand for entertainment applications.
By End-User Verticals: The Media and Entertainment segment holds the largest market share, due to its early adoption of holographic displays for concerts, events and advertising. However, the Automotive segment is projected to witness the fastest growth due to increasing adoption of innovative displays in next-generation vehicles. The Retail and Healthcare sectors are also demonstrating significant growth potential.
Holographic Display Industry Product Innovations
Recent innovations include transparent holographic displays, as showcased by Hyundai Mobis' innovative display series for next-generation vehicles. These advancements offer improved user experiences and expanded application possibilities. The integration of AR/VR technologies further enhances the immersive capabilities of holographic displays, creating new market opportunities in gaming, education, and training. Competitive advantages are gained through superior image quality, higher resolution, and cost-effectiveness.
Report Scope & Segmentation Analysis
This report segments the holographic display market by end-user verticals:
- Consumer Electronics: This segment is experiencing steady growth, driven by the increasing demand for immersive entertainment experiences. The market size is projected to reach $xx Million by 2033, with a CAGR of xx%.
- Retail: Holographic displays offer innovative ways for retailers to engage customers, leading to considerable market growth. The market is expected to reach $xx Million by 2033.
- Media and Entertainment: This is the largest segment, with a market size of $xx Million in 2025, projected to reach $xx Million by 2033, driven by the use of holographic displays in concerts, events, and advertising.
- Military and Defense: This segment is witnessing increasing adoption for training simulations and advanced visualization systems, with $xx Million market size expected in 2033.
- Healthcare: The use of holographic displays in medical imaging and surgical simulations is fueling growth in this segment. This segment is expected to reach $xx Million by 2033.
- Automotive: The integration of transparent holographic displays in vehicles is a significant driver of market growth, estimated to reach $xx Million by 2033.
- Other End-user Verticals: This includes various emerging applications across diverse sectors, contributing to overall market expansion.
Key Drivers of Holographic Display Industry Growth
The growth of the holographic display industry is driven by several factors: advancements in display technologies, increasing demand for immersive experiences across various sectors, rising disposable incomes, and supportive government policies. The integration of AR/VR technology further fuels market expansion, allowing for interactive and engaging applications.
Challenges in the Holographic Display Industry Sector
Challenges include the high cost of manufacturing holographic displays, technological limitations in achieving high-resolution images, and the need for specialized infrastructure for deployment. Competition from alternative display technologies and regulatory hurdles in certain regions also pose significant challenges. The supply chain disruptions also impacted the production negatively.
Emerging Opportunities in Holographic Display Industry
Emerging opportunities lie in the development of more compact and cost-effective holographic displays, expanding applications in areas such as education and healthcare, and the integration with 5G and IoT technologies. New market opportunities are also expected to arise in developing economies with rising disposable incomes.
Leading Players in the Holographic Display Industry Market
- Musion Das Hologram Ltd
- Realview Imaging Ltd
- Animmersion UK Ltd
- Looking Glass Factory Inc
- Shenzhen SMX Display Technology Co Ltd
- Kino-mo Limited (HYPERVSN)
- RealFiction Holding AB
- Provision Holding Inc
Key Developments in Holographic Display Industry
- January 2024: Hyundai Mobis unveiled its transparent holographic display for next-gen vehicles, showcasing a significant advancement in automotive display technology.
- January 2024: ARHT Media Inc. partnered with a global luxury retail brand to install ARHT Capsule hologram displays in five country headquarters, highlighting the growing use of holographic displays in retail and corporate settings.
Future Outlook for Holographic Display Industry Market
The future of the holographic display industry is bright, with significant growth potential driven by continued technological advancements, expanding applications across various sectors, and increasing consumer demand for immersive experiences. Strategic partnerships and collaborations among industry players will further accelerate market expansion. The market is expected to be driven by innovative applications and technological improvements.
Holographic Display Industry Segmentation
-
1. End-user Verticals
- 1.1. Consumer Electronics
- 1.2. Retail
- 1.3. Media and Entertainment
- 1.4. Military and Defense
- 1.5. Healthcare
- 1.6. Automotive
- 1.7. Other End-user Verticals
Holographic Display Industry Segmentation By Geography
- 1. North America
- 2. Europe
- 3. Asia
- 4. Australia and New Zealand
- 5. Latin America
- 6. Middle East and Africa
Holographic Display Industry Regional Market Share
Geographic Coverage of Holographic Display Industry
Holographic Display Industry REPORT HIGHLIGHTS
| Aspects | Details |
|---|---|
| Study Period | 2020-2034 |
| Base Year | 2025 |
| Estimated Year | 2026 |
| Forecast Period | 2026-2034 |
| Historical Period | 2020-2025 |
| Growth Rate | CAGR of 23.12% from 2020-2034 |
| Segmentation |
|
Table of Contents
- 1. Introduction
- 1.1. Research Scope
- 1.2. Market Segmentation
- 1.3. Research Objective
- 1.4. Definitions and Assumptions
- 2. Executive Summary
- 2.1. Market Snapshot
- 3. Market Dynamics
- 3.1. Market Drivers
- 3.2. Market Restrains
- 3.3. Market Trends
- 3.4. Market Opportunities
- 4. Market Factor Analysis
- 4.1. Porters Five Forces
- 4.1.1. Bargaining Power of Suppliers
- 4.1.2. Bargaining Power of Buyers
- 4.1.3. Threat of New Entrants
- 4.1.4. Threat of Substitutes
- 4.1.5. Competitive Rivalry
- 4.2. PESTEL analysis
- 4.3. BCG Analysis
- 4.3.1. Stars (High Growth, High Market Share)
- 4.3.2. Cash Cows (Low Growth, High Market Share)
- 4.3.3. Question Mark (High Growth, Low Market Share)
- 4.3.4. Dogs (Low Growth, Low Market Share)
- 4.4. Ansoff Matrix Analysis
- 4.5. Supply Chain Analysis
- 4.6. Regulatory Landscape
- 4.7. Current Market Potential and Opportunity Assessment (TAM–SAM–SOM Framework)
- 4.8. PRI Analyst Note
- 4.1. Porters Five Forces
- 5. Market Analysis, Insights and Forecast 2021-2033
- 5.1. Market Analysis, Insights and Forecast - by End-user Verticals
- 5.1.1. Consumer Electronics
- 5.1.2. Retail
- 5.1.3. Media and Entertainment
- 5.1.4. Military and Defense
- 5.1.5. Healthcare
- 5.1.6. Automotive
- 5.1.7. Other End-user Verticals
- 5.2. Market Analysis, Insights and Forecast - by Region
- 5.2.1. North America
- 5.2.2. Europe
- 5.2.3. Asia
- 5.2.4. Australia and New Zealand
- 5.2.5. Latin America
- 5.2.6. Middle East and Africa
- 5.1. Market Analysis, Insights and Forecast - by End-user Verticals
- 6. Global Holographic Display Industry Analysis, Insights and Forecast, 2021-2033
- 6.1. Market Analysis, Insights and Forecast - by End-user Verticals
- 6.1.1. Consumer Electronics
- 6.1.2. Retail
- 6.1.3. Media and Entertainment
- 6.1.4. Military and Defense
- 6.1.5. Healthcare
- 6.1.6. Automotive
- 6.1.7. Other End-user Verticals
- 6.1. Market Analysis, Insights and Forecast - by End-user Verticals
- 7. North America Holographic Display Industry Analysis, Insights and Forecast, 2020-2032
- 7.1. Market Analysis, Insights and Forecast - by End-user Verticals
- 7.1.1. Consumer Electronics
- 7.1.2. Retail
- 7.1.3. Media and Entertainment
- 7.1.4. Military and Defense
- 7.1.5. Healthcare
- 7.1.6. Automotive
- 7.1.7. Other End-user Verticals
- 7.1. Market Analysis, Insights and Forecast - by End-user Verticals
- 8. Europe Holographic Display Industry Analysis, Insights and Forecast, 2020-2032
- 8.1. Market Analysis, Insights and Forecast - by End-user Verticals
- 8.1.1. Consumer Electronics
- 8.1.2. Retail
- 8.1.3. Media and Entertainment
- 8.1.4. Military and Defense
- 8.1.5. Healthcare
- 8.1.6. Automotive
- 8.1.7. Other End-user Verticals
- 8.1. Market Analysis, Insights and Forecast - by End-user Verticals
- 9. Asia Holographic Display Industry Analysis, Insights and Forecast, 2020-2032
- 9.1. Market Analysis, Insights and Forecast - by End-user Verticals
- 9.1.1. Consumer Electronics
- 9.1.2. Retail
- 9.1.3. Media and Entertainment
- 9.1.4. Military and Defense
- 9.1.5. Healthcare
- 9.1.6. Automotive
- 9.1.7. Other End-user Verticals
- 9.1. Market Analysis, Insights and Forecast - by End-user Verticals
- 10. Australia and New Zealand Holographic Display Industry Analysis, Insights and Forecast, 2020-2032
- 10.1. Market Analysis, Insights and Forecast - by End-user Verticals
- 10.1.1. Consumer Electronics
- 10.1.2. Retail
- 10.1.3. Media and Entertainment
- 10.1.4. Military and Defense
- 10.1.5. Healthcare
- 10.1.6. Automotive
- 10.1.7. Other End-user Verticals
- 10.1. Market Analysis, Insights and Forecast - by End-user Verticals
- 11. Latin America Holographic Display Industry Analysis, Insights and Forecast, 2020-2032
- 11.1. Market Analysis, Insights and Forecast - by End-user Verticals
- 11.1.1. Consumer Electronics
- 11.1.2. Retail
- 11.1.3. Media and Entertainment
- 11.1.4. Military and Defense
- 11.1.5. Healthcare
- 11.1.6. Automotive
- 11.1.7. Other End-user Verticals
- 11.1. Market Analysis, Insights and Forecast - by End-user Verticals
- 12. Middle East and Africa Holographic Display Industry Analysis, Insights and Forecast, 2020-2032
- 12.1. Market Analysis, Insights and Forecast - by End-user Verticals
- 12.1.1. Consumer Electronics
- 12.1.2. Retail
- 12.1.3. Media and Entertainment
- 12.1.4. Military and Defense
- 12.1.5. Healthcare
- 12.1.6. Automotive
- 12.1.7. Other End-user Verticals
- 12.1. Market Analysis, Insights and Forecast - by End-user Verticals
- 13. Competitive Analysis
- 13.1. Company Profiles
- 13.1.1 Musion Das Hologram Ltd
- 13.1.1.1. Company Overview
- 13.1.1.2. Products
- 13.1.1.3. Company Financials
- 13.1.1.4. SWOT Analysis
- 13.1.2 Realview Imaging Ltd
- 13.1.2.1. Company Overview
- 13.1.2.2. Products
- 13.1.2.3. Company Financials
- 13.1.2.4. SWOT Analysis
- 13.1.3 Animmersion UK Ltd
- 13.1.3.1. Company Overview
- 13.1.3.2. Products
- 13.1.3.3. Company Financials
- 13.1.3.4. SWOT Analysis
- 13.1.4 Looking Glass Factory Inc
- 13.1.4.1. Company Overview
- 13.1.4.2. Products
- 13.1.4.3. Company Financials
- 13.1.4.4. SWOT Analysis
- 13.1.5 Shenzhen SMX Display Technology Co Lt
- 13.1.5.1. Company Overview
- 13.1.5.2. Products
- 13.1.5.3. Company Financials
- 13.1.5.4. SWOT Analysis
- 13.1.6 Kino-mo Limited (HYPERVSN)
- 13.1.6.1. Company Overview
- 13.1.6.2. Products
- 13.1.6.3. Company Financials
- 13.1.6.4. SWOT Analysis
- 13.1.7 RealFiction Holding AB
- 13.1.7.1. Company Overview
- 13.1.7.2. Products
- 13.1.7.3. Company Financials
- 13.1.7.4. SWOT Analysis
- 13.1.8 Provision Holding Inc
- 13.1.8.1. Company Overview
- 13.1.8.2. Products
- 13.1.8.3. Company Financials
- 13.1.8.4. SWOT Analysis
- 13.1.1 Musion Das Hologram Ltd
- 13.2. Market Entropy
- 13.2.1 Company's Key Areas Served
- 13.2.2 Recent Developments
- 13.3. Company Market Share Analysis 2025
- 13.3.1 Top 5 Companies Market Share Analysis
- 13.3.2 Top 3 Companies Market Share Analysis
- 13.4. List of Potential Customers
- 14. Research Methodology
List of Figures
- Figure 1: Global Holographic Display Industry Revenue Breakdown (Million, %) by Region 2025 & 2033
- Figure 2: North America Holographic Display Industry Revenue (Million), by End-user Verticals 2025 & 2033
- Figure 3: North America Holographic Display Industry Revenue Share (%), by End-user Verticals 2025 & 2033
- Figure 4: North America Holographic Display Industry Revenue (Million), by Country 2025 & 2033
- Figure 5: North America Holographic Display Industry Revenue Share (%), by Country 2025 & 2033
- Figure 6: Europe Holographic Display Industry Revenue (Million), by End-user Verticals 2025 & 2033
- Figure 7: Europe Holographic Display Industry Revenue Share (%), by End-user Verticals 2025 & 2033
- Figure 8: Europe Holographic Display Industry Revenue (Million), by Country 2025 & 2033
- Figure 9: Europe Holographic Display Industry Revenue Share (%), by Country 2025 & 2033
- Figure 10: Asia Holographic Display Industry Revenue (Million), by End-user Verticals 2025 & 2033
- Figure 11: Asia Holographic Display Industry Revenue Share (%), by End-user Verticals 2025 & 2033
- Figure 12: Asia Holographic Display Industry Revenue (Million), by Country 2025 & 2033
- Figure 13: Asia Holographic Display Industry Revenue Share (%), by Country 2025 & 2033
- Figure 14: Australia and New Zealand Holographic Display Industry Revenue (Million), by End-user Verticals 2025 & 2033
- Figure 15: Australia and New Zealand Holographic Display Industry Revenue Share (%), by End-user Verticals 2025 & 2033
- Figure 16: Australia and New Zealand Holographic Display Industry Revenue (Million), by Country 2025 & 2033
- Figure 17: Australia and New Zealand Holographic Display Industry Revenue Share (%), by Country 2025 & 2033
- Figure 18: Latin America Holographic Display Industry Revenue (Million), by End-user Verticals 2025 & 2033
- Figure 19: Latin America Holographic Display Industry Revenue Share (%), by End-user Verticals 2025 & 2033
- Figure 20: Latin America Holographic Display Industry Revenue (Million), by Country 2025 & 2033
- Figure 21: Latin America Holographic Display Industry Revenue Share (%), by Country 2025 & 2033
- Figure 22: Middle East and Africa Holographic Display Industry Revenue (Million), by End-user Verticals 2025 & 2033
- Figure 23: Middle East and Africa Holographic Display Industry Revenue Share (%), by End-user Verticals 2025 & 2033
- Figure 24: Middle East and Africa Holographic Display Industry Revenue (Million), by Country 2025 & 2033
- Figure 25: Middle East and Africa Holographic Display Industry Revenue Share (%), by Country 2025 & 2033
List of Tables
- Table 1: Global Holographic Display Industry Revenue Million Forecast, by End-user Verticals 2020 & 2033
- Table 2: Global Holographic Display Industry Revenue Million Forecast, by Region 2020 & 2033
- Table 3: Global Holographic Display Industry Revenue Million Forecast, by End-user Verticals 2020 & 2033
- Table 4: Global Holographic Display Industry Revenue Million Forecast, by Country 2020 & 2033
- Table 5: Global Holographic Display Industry Revenue Million Forecast, by End-user Verticals 2020 & 2033
- Table 6: Global Holographic Display Industry Revenue Million Forecast, by Country 2020 & 2033
- Table 7: Global Holographic Display Industry Revenue Million Forecast, by End-user Verticals 2020 & 2033
- Table 8: Global Holographic Display Industry Revenue Million Forecast, by Country 2020 & 2033
- Table 9: Global Holographic Display Industry Revenue Million Forecast, by End-user Verticals 2020 & 2033
- Table 10: Global Holographic Display Industry Revenue Million Forecast, by Country 2020 & 2033
- Table 11: Global Holographic Display Industry Revenue Million Forecast, by End-user Verticals 2020 & 2033
- Table 12: Global Holographic Display Industry Revenue Million Forecast, by Country 2020 & 2033
- Table 13: Global Holographic Display Industry Revenue Million Forecast, by End-user Verticals 2020 & 2033
- Table 14: Global Holographic Display Industry Revenue Million Forecast, by Country 2020 & 2033
Frequently Asked Questions
1. What is the projected Compound Annual Growth Rate (CAGR) of the Holographic Display Industry?
The projected CAGR is approximately 23.12%.
2. Which companies are prominent players in the Holographic Display Industry?
Key companies in the market include Musion Das Hologram Ltd, Realview Imaging Ltd, Animmersion UK Ltd, Looking Glass Factory Inc, Shenzhen SMX Display Technology Co Lt, Kino-mo Limited (HYPERVSN), RealFiction Holding AB, Provision Holding Inc.
3. What are the main segments of the Holographic Display Industry?
The market segments include End-user Verticals.
4. Can you provide details about the market size?
The market size is estimated to be USD 3.45 Million as of 2022.
5. What are some drivers contributing to market growth?
Increasing Investments in 3D Technology; Advancements in Screenless Displays.
6. What are the notable trends driving market growth?
Automotive Segment is Expected to Witness Significant Growth.
7. Are there any restraints impacting market growth?
High Cost of Assembling Holographic Display Devices; Presence of Substitute Display Products.
8. Can you provide examples of recent developments in the market?
Jan 2024: Hyundai Mobis, Hyundai’s largest supplier, unveiled its latest EV tech. It uses the first transparent display screen using holographic tech. The company revealed its “innovative display series” for next-gen vehicles, which included the “world’s first rollable display and swivel display.” Hyundai Mobis presented a transparent display that uses holographic elements. The display appears on a transparent panel, making it easier for drivers to keep their eyes on the road.
9. What pricing options are available for accessing the report?
Pricing options include single-user, multi-user, and enterprise licenses priced at USD 4750, USD 5250, and USD 8750 respectively.
10. Is the market size provided in terms of value or volume?
The market size is provided in terms of value, measured in Million.
11. Are there any specific market keywords associated with the report?
Yes, the market keyword associated with the report is "Holographic Display Industry," which aids in identifying and referencing the specific market segment covered.
12. How do I determine which pricing option suits my needs best?
The pricing options vary based on user requirements and access needs. Individual users may opt for single-user licenses, while businesses requiring broader access may choose multi-user or enterprise licenses for cost-effective access to the report.
13. Are there any additional resources or data provided in the Holographic Display Industry report?
While the report offers comprehensive insights, it's advisable to review the specific contents or supplementary materials provided to ascertain if additional resources or data are available.
14. How can I stay updated on further developments or reports in the Holographic Display Industry?
To stay informed about further developments, trends, and reports in the Holographic Display Industry, consider subscribing to industry newsletters, following relevant companies and organizations, or regularly checking reputable industry news sources and publications.
Methodology
Step 1 - Identification of Relevant Samples Size from Population Database


Step 2 - Approaches for Defining Global Market Size (Value, Volume* & Price*)

Note*: In applicable scenarios
Step 3 - Data Sources
Primary Research
- Web Analytics
- Survey Reports
- Research Institute
- Latest Research Reports
- Opinion Leaders
Secondary Research
- Annual Reports
- White Paper
- Latest Press Release
- Industry Association
- Paid Database
- Investor Presentations

Step 4 - Data Triangulation
Involves using different sources of information in order to increase the validity of a study
These sources are likely to be stakeholders in a program - participants, other researchers, program staff, other community members, and so on.
Then we put all data in single framework & apply various statistical tools to find out the dynamic on the market.
During the analysis stage, feedback from the stakeholder groups would be compared to determine areas of agreement as well as areas of divergence