

Key Insights
The global hydrazine market, valued at 543 million in 2024, is projected to achieve significant expansion, driven by a compound annual growth rate (CAGR) of 6% from 2024 to 2033. This growth is propelled by escalating demand across critical sectors. The pharmaceutical industry's reliance on hydrazine derivatives for drug synthesis and the agrochemical sector's use in pesticide formulation are key contributors. The aerospace and defense industries' requirement for hydrazine as a rocket propellant presents substantial growth avenues. Additionally, its utility as a corrosion inhibitor and blowing agent in polymer manufacturing further bolsters market size. While regulatory considerations regarding hydrazine's toxicity present a challenge, advancements in safer handling protocols and sustainable alternatives are expected to mitigate these concerns. Emerging economies, with their expanding industrial and agricultural landscapes, offer considerable potential for geographic expansion. The market is segmented by type (hydrazine hydrate, hydrazine nitrate, hydrazine sulfate, etc.), application (corrosion inhibitor, explosives, rocket fuel, medicinal ingredients, pesticides, blowing agent, etc.), and end-user industry (pharmaceuticals, agrochemicals, industrial, etc.), creating specialized opportunities.
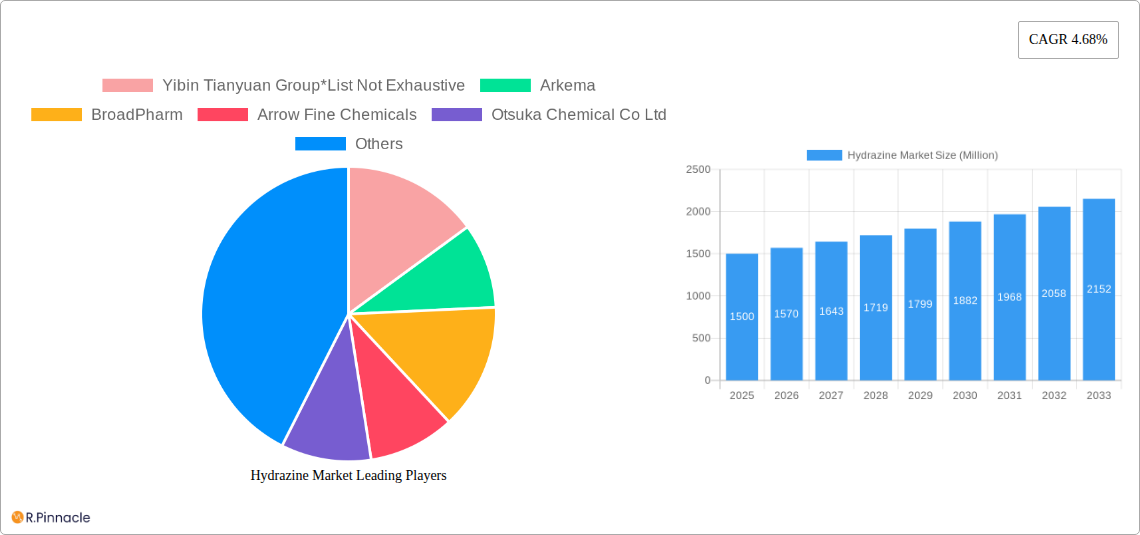
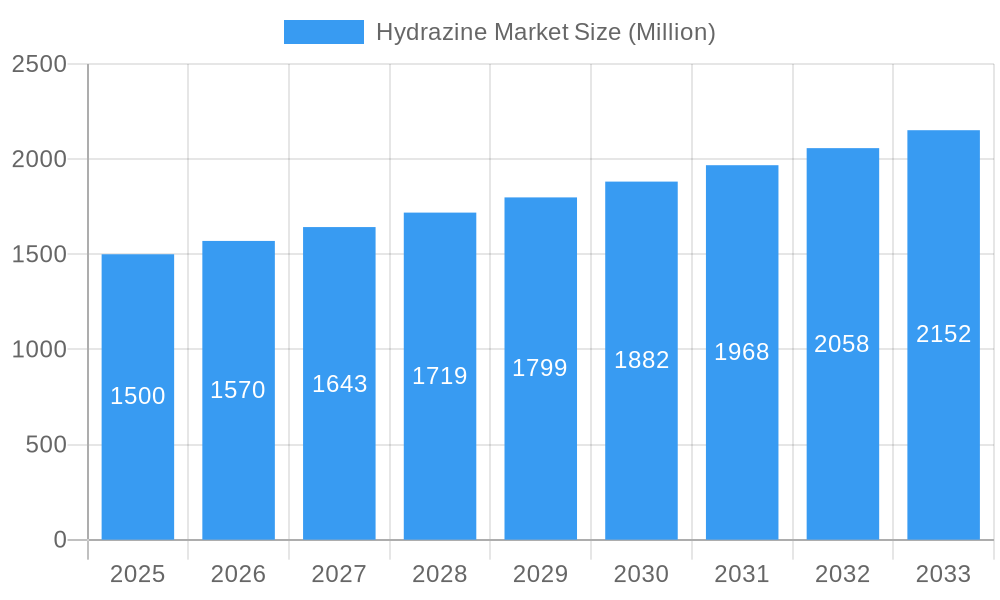
Hydrazine Market Market Size (In Million)
The competitive landscape comprises established global entities such as Arkema and LANXESS, alongside regional players like Yibin Tianyuan Group and MERU CHEM PVT LTD. Ongoing research and development focused on enhancing efficiency and safety will influence market dynamics. The Asia-Pacific region, led by China and India, is anticipated to lead market growth due to rapid industrialization. North America and Europe will retain substantial market shares, supported by mature industries and robust regulatory environments. Strategic investments in sustainable alternatives and improved safety measures are poised to favorably impact the long-term market outlook, ensuring sustained growth despite environmental considerations.
Hydrazine Market Company Market Share
Hydrazine Market Report: 2019-2033 Forecast
This comprehensive report provides a detailed analysis of the Hydrazine Market, offering invaluable insights for industry professionals, investors, and strategic decision-makers. Covering the period from 2019 to 2033, with a focus on 2025, this report meticulously examines market dynamics, segmentation, key players, and future growth opportunities. The study period (2019-2024) and forecast period (2025-2033) allow for a thorough understanding of historical trends and future projections.
Hydrazine Market Market Structure & Innovation Trends
This section analyzes the competitive landscape of the hydrazine market, encompassing market concentration, innovation drivers, regulatory influences, product substitutes, and merger and acquisition (M&A) activities. The market is moderately concentrated, with several key players holding significant shares. Innovation is primarily driven by the development of more efficient and sustainable production methods, as well as the exploration of new applications in emerging industries.
- Market Concentration: The top five players account for approximately xx% of the global market share in 2025, indicating a moderately concentrated market. Further analysis reveals that Yibin Tianyuan Group holds the leading market share, followed by Arkema and Otsuka Chemical Co Ltd.
- Innovation Drivers: The increasing demand for hydrazine in the pharmaceutical and agrochemical sectors is driving innovation towards cleaner and safer production technologies. R&D efforts are focused on reducing production costs and environmental impact.
- Regulatory Frameworks: Stringent environmental regulations and safety protocols impact production and usage patterns. The market is subject to evolving regulations concerning the handling and disposal of hydrazine.
- Product Substitutes: Limited direct substitutes exist for hydrazine in most of its applications, although alternative chemicals are sometimes used in specific applications.
- End-User Demographics: The primary end-users are concentrated in the pharmaceutical, agrochemical, and industrial sectors, with a growing demand from emerging markets.
- M&A Activities: The past five years have witnessed xx M&A deals with a total value of approximately xx Million, indicating consolidation within the industry. These activities focus on expanding market reach and gaining access to new technologies.
Hydrazine Market Market Dynamics & Trends
This section explores the key factors influencing the growth and development of the hydrazine market, including market growth drivers, technological advancements, consumer preferences, and competitive dynamics. The market is expected to witness significant growth during the forecast period, driven by increasing demand from various sectors.
The market exhibits a Compound Annual Growth Rate (CAGR) of approximately xx% during the forecast period (2025-2033). This growth is propelled by factors including increasing demand for pharmaceuticals, agrochemicals, and industrial applications. Technological advancements leading to improved production efficiency and safety are also contributing to market expansion. Competitive dynamics are shaped by pricing strategies, product differentiation, and innovation among key players. Market penetration remains relatively high in established markets, while growth potential lies in emerging economies and applications. Consumer preferences are largely driven by cost-effectiveness, safety, and environmental considerations.
Dominant Regions & Segments in Hydrazine Market
This section identifies the leading regions, countries, and market segments based on type, application, and end-user industry.
Leading Regions: The Asia-Pacific region is anticipated to hold the largest market share in 2025, driven by robust economic growth and increasing industrialization in countries like China and India. North America and Europe follow closely, representing significant market segments due to their established chemical industries and pharmaceutical sectors.
Dominant Segments:
- Type: Hydrazine hydrate is the dominant type, holding the largest market share due to its widespread use in various applications.
- Application: The largest application segment is rocket fuel, followed by pharmaceuticals and precursor to pesticides. The corrosion inhibitor segment is experiencing modest growth.
- End-user Industry: The pharmaceutical industry is the leading end-user, followed by the agrochemical and industrial sectors. The water treatment sector demonstrates a notable market potential.
Key Drivers:
- Asia-Pacific: Rapid industrialization, increasing pharmaceutical production, and growing demand for agrochemicals are key drivers.
- North America: Established chemical industry and robust research and development in pharmaceuticals contribute to market growth.
- Europe: Stringent environmental regulations and focus on sustainable practices are influencing market dynamics.
Hydrazine Market Product Innovations
Recent innovations focus on improving the efficiency and safety of hydrazine production and handling, as well as exploring new applications. These developments include the development of novel catalysts and improved process technologies to reduce waste and enhance product purity. The emphasis is on meeting stricter environmental regulations and creating safer handling procedures. The introduction of new formulations and specialized products tailored to specific applications is also contributing to market differentiation.
Report Scope & Segmentation Analysis
This report comprehensively segments the hydrazine market by type (Hydrazine Hydrate, Hydrazine Nitrate, Hydrazine Sulfate, Other Types), application (Corrosion Inhibitor, Explosives, Rocket Fuel, Medicinal Ingredients, Precursor to Pesticides, Blowing Agent, Other Applications), and end-user industry (Pharmaceuticals, Agrochemicals, Industrial, Other End-user Industries). Each segment's growth projections, market size (in Million), and competitive dynamics are detailed within the full report. For example, the hydrazine hydrate segment is projected to witness significant growth driven by its dominant position in various applications.
Key Drivers of Hydrazine Market Growth
The Hydrazine market's growth is primarily driven by the increasing demand from the pharmaceutical industry for drug synthesis, the agrochemical sector for pesticide production, and the industrial sector for various applications. Technological advancements improving production efficiency and safety, and the expansion of emerging economies with increasing industrialization also contribute to market growth. Government investments in aerospace and defense further propel the demand for hydrazine as a rocket propellant.
Challenges in the Hydrazine Market Sector
The Hydrazine market faces challenges including stringent environmental regulations concerning its production and disposal, fluctuating raw material prices impacting production costs, and the inherent toxicity of hydrazine demanding rigorous safety measures. These factors influence production costs and limit market expansion, especially in certain regions with stricter environmental compliance. The competitive landscape with established players also creates challenges for new entrants.
Emerging Opportunities in Hydrazine Market
Emerging opportunities exist in developing new applications for hydrazine in niche markets and exploring sustainable production methods to meet increasing environmental concerns. The development of novel formulations with enhanced performance characteristics and exploring new partnerships in emerging economies can also unlock significant market potential. Growing demand in specialized industrial applications and the expanding pharmaceutical sector present further growth prospects.
Leading Players in the Hydrazine Market Market
- Yibin Tianyuan Group
- Arkema
- BroadPharm
- Arrow Fine Chemicals
- Otsuka Chemical Co Ltd
- Tokyo Chemical Industry Co Ltd
- NIPPON CARBIDE INDUSTRIES CO INC
- LANXESS
- Innova Corporate
- ACURO ORGANICS LIMITED
- MERU CHEM PVT LTD
Key Developments in Hydrazine Market Industry
- March 2023: Otsuka Chemical Co., Ltd. and Yokogawa Electric Corporation established SynCrest Inc., a joint venture for pharmaceutical CRDMO services, highlighting the crucial role of hydrazine in drug development.
- May 2023: SynCrest Inc. announced its expanded CRDMO services across Japan, Europe, North America, and South America, furthering the utilization of hydrazine in pharmaceutical manufacturing.
Future Outlook for Hydrazine Market Market
The Hydrazine market exhibits promising future prospects driven by increasing demand from various sectors, technological advancements, and the exploration of new applications. Strategic partnerships, innovative product development, and expansion into emerging markets will be critical for sustained growth. The market is poised for continued expansion, albeit within the framework of stricter environmental regulations and safety guidelines. Further growth is anticipated due to its critical role in several industrial and technological advancements.
Hydrazine Market Segmentation
-
1. Type
- 1.1. Hydrazine Hydrate
- 1.2. Hydrazine Nitrate
- 1.3. Hydrazine Sulfate
- 1.4. Other Types (Hydrazine Carbonate, etc.)
-
2. Application
- 2.1. Corrosion Inhibitor
- 2.2. Explosives
- 2.3. Rocket Fuel
- 2.4. Medicinal Ingredients
- 2.5. Precursor to Pesticides
- 2.6. Blowing Agent
- 2.7. Other Ap
-
3. End-user Industry
- 3.1. Pharmaceuticals
- 3.2. Agrochemicals
- 3.3. Industrial
- 3.4. Other End-user Industries (Water Treatment, etc.)
Hydrazine Market Segmentation By Geography
-
1. Asia Pacific
- 1.1. China
- 1.2. India
- 1.3. Japan
- 1.4. South Korea
- 1.5. Rest of Asia Pacific
-
2. North America
- 2.1. United States
- 2.2. Canada
- 2.3. Mexico
-
3. Europe
- 3.1. Germany
- 3.2. United Kingdom
- 3.3. Italy
- 3.4. France
- 3.5. Rest of Europe
-
4. South America
- 4.1. Brazil
- 4.2. Argentina
- 4.3. Rest of South America
-
5. Middle East and Africa
- 5.1. Saudi Arabia
- 5.2. South Africa
- 5.3. Rest of Middle East and Africa
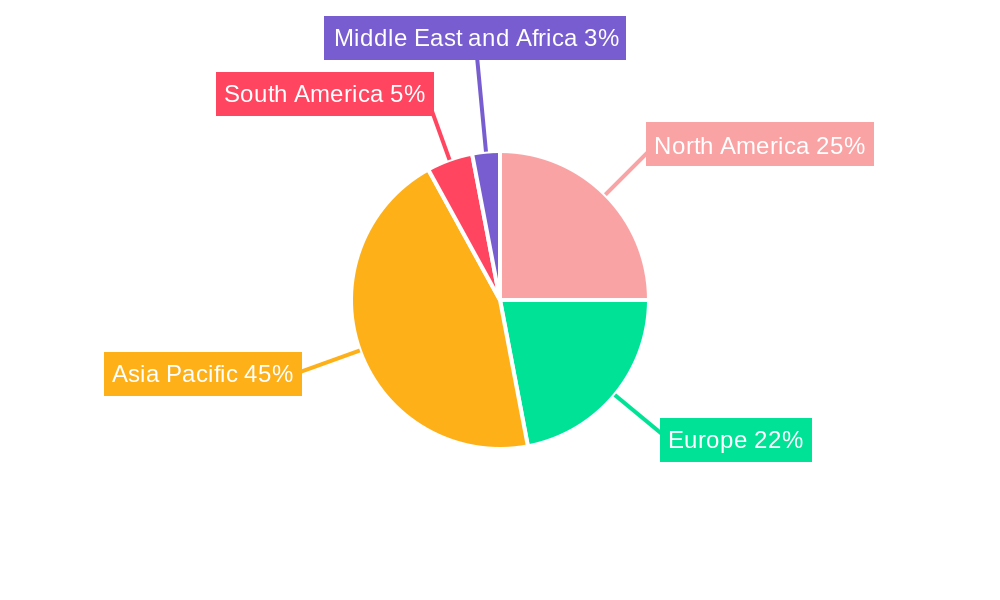
Hydrazine Market Regional Market Share
Geographic Coverage of Hydrazine Market
Hydrazine Market REPORT HIGHLIGHTS
| Aspects | Details |
|---|---|
| Study Period | 2020-2034 |
| Base Year | 2025 |
| Estimated Year | 2026 |
| Forecast Period | 2026-2034 |
| Historical Period | 2020-2025 |
| Growth Rate | CAGR of 6% from 2020-2034 |
| Segmentation |
|
Table of Contents
- 1. Introduction
- 1.1. Research Scope
- 1.2. Market Segmentation
- 1.3. Research Objective
- 1.4. Definitions and Assumptions
- 2. Executive Summary
- 2.1. Market Snapshot
- 3. Market Dynamics
- 3.1. Market Drivers
- 3.2. Market Restrains
- 3.3. Market Trends
- 3.4. Market Opportunities
- 4. Market Factor Analysis
- 4.1. Porters Five Forces
- 4.1.1. Bargaining Power of Suppliers
- 4.1.2. Bargaining Power of Buyers
- 4.1.3. Threat of New Entrants
- 4.1.4. Threat of Substitutes
- 4.1.5. Competitive Rivalry
- 4.2. PESTEL analysis
- 4.3. BCG Analysis
- 4.3.1. Stars (High Growth, High Market Share)
- 4.3.2. Cash Cows (Low Growth, High Market Share)
- 4.3.3. Question Mark (High Growth, Low Market Share)
- 4.3.4. Dogs (Low Growth, Low Market Share)
- 4.4. Ansoff Matrix Analysis
- 4.5. Supply Chain Analysis
- 4.6. Regulatory Landscape
- 4.7. Current Market Potential and Opportunity Assessment (TAM–SAM–SOM Framework)
- 4.8. PRI Analyst Note
- 4.1. Porters Five Forces
- 5. Market Analysis, Insights and Forecast 2021-2033
- 5.1. Market Analysis, Insights and Forecast - by Type
- 5.1.1. Hydrazine Hydrate
- 5.1.2. Hydrazine Nitrate
- 5.1.3. Hydrazine Sulfate
- 5.1.4. Other Types (Hydrazine Carbonate, etc.)
- 5.2. Market Analysis, Insights and Forecast - by Application
- 5.2.1. Corrosion Inhibitor
- 5.2.2. Explosives
- 5.2.3. Rocket Fuel
- 5.2.4. Medicinal Ingredients
- 5.2.5. Precursor to Pesticides
- 5.2.6. Blowing Agent
- 5.2.7. Other Ap
- 5.3. Market Analysis, Insights and Forecast - by End-user Industry
- 5.3.1. Pharmaceuticals
- 5.3.2. Agrochemicals
- 5.3.3. Industrial
- 5.3.4. Other End-user Industries (Water Treatment, etc.)
- 5.4. Market Analysis, Insights and Forecast - by Region
- 5.4.1. Asia Pacific
- 5.4.2. North America
- 5.4.3. Europe
- 5.4.4. South America
- 5.4.5. Middle East and Africa
- 5.1. Market Analysis, Insights and Forecast - by Type
- 6. Global Hydrazine Market Analysis, Insights and Forecast, 2021-2033
- 6.1. Market Analysis, Insights and Forecast - by Type
- 6.1.1. Hydrazine Hydrate
- 6.1.2. Hydrazine Nitrate
- 6.1.3. Hydrazine Sulfate
- 6.1.4. Other Types (Hydrazine Carbonate, etc.)
- 6.2. Market Analysis, Insights and Forecast - by Application
- 6.2.1. Corrosion Inhibitor
- 6.2.2. Explosives
- 6.2.3. Rocket Fuel
- 6.2.4. Medicinal Ingredients
- 6.2.5. Precursor to Pesticides
- 6.2.6. Blowing Agent
- 6.2.7. Other Ap
- 6.3. Market Analysis, Insights and Forecast - by End-user Industry
- 6.3.1. Pharmaceuticals
- 6.3.2. Agrochemicals
- 6.3.3. Industrial
- 6.3.4. Other End-user Industries (Water Treatment, etc.)
- 6.1. Market Analysis, Insights and Forecast - by Type
- 7. Asia Pacific Hydrazine Market Analysis, Insights and Forecast, 2020-2032
- 7.1. Market Analysis, Insights and Forecast - by Type
- 7.1.1. Hydrazine Hydrate
- 7.1.2. Hydrazine Nitrate
- 7.1.3. Hydrazine Sulfate
- 7.1.4. Other Types (Hydrazine Carbonate, etc.)
- 7.2. Market Analysis, Insights and Forecast - by Application
- 7.2.1. Corrosion Inhibitor
- 7.2.2. Explosives
- 7.2.3. Rocket Fuel
- 7.2.4. Medicinal Ingredients
- 7.2.5. Precursor to Pesticides
- 7.2.6. Blowing Agent
- 7.2.7. Other Ap
- 7.3. Market Analysis, Insights and Forecast - by End-user Industry
- 7.3.1. Pharmaceuticals
- 7.3.2. Agrochemicals
- 7.3.3. Industrial
- 7.3.4. Other End-user Industries (Water Treatment, etc.)
- 7.1. Market Analysis, Insights and Forecast - by Type
- 8. North America Hydrazine Market Analysis, Insights and Forecast, 2020-2032
- 8.1. Market Analysis, Insights and Forecast - by Type
- 8.1.1. Hydrazine Hydrate
- 8.1.2. Hydrazine Nitrate
- 8.1.3. Hydrazine Sulfate
- 8.1.4. Other Types (Hydrazine Carbonate, etc.)
- 8.2. Market Analysis, Insights and Forecast - by Application
- 8.2.1. Corrosion Inhibitor
- 8.2.2. Explosives
- 8.2.3. Rocket Fuel
- 8.2.4. Medicinal Ingredients
- 8.2.5. Precursor to Pesticides
- 8.2.6. Blowing Agent
- 8.2.7. Other Ap
- 8.3. Market Analysis, Insights and Forecast - by End-user Industry
- 8.3.1. Pharmaceuticals
- 8.3.2. Agrochemicals
- 8.3.3. Industrial
- 8.3.4. Other End-user Industries (Water Treatment, etc.)
- 8.1. Market Analysis, Insights and Forecast - by Type
- 9. Europe Hydrazine Market Analysis, Insights and Forecast, 2020-2032
- 9.1. Market Analysis, Insights and Forecast - by Type
- 9.1.1. Hydrazine Hydrate
- 9.1.2. Hydrazine Nitrate
- 9.1.3. Hydrazine Sulfate
- 9.1.4. Other Types (Hydrazine Carbonate, etc.)
- 9.2. Market Analysis, Insights and Forecast - by Application
- 9.2.1. Corrosion Inhibitor
- 9.2.2. Explosives
- 9.2.3. Rocket Fuel
- 9.2.4. Medicinal Ingredients
- 9.2.5. Precursor to Pesticides
- 9.2.6. Blowing Agent
- 9.2.7. Other Ap
- 9.3. Market Analysis, Insights and Forecast - by End-user Industry
- 9.3.1. Pharmaceuticals
- 9.3.2. Agrochemicals
- 9.3.3. Industrial
- 9.3.4. Other End-user Industries (Water Treatment, etc.)
- 9.1. Market Analysis, Insights and Forecast - by Type
- 10. South America Hydrazine Market Analysis, Insights and Forecast, 2020-2032
- 10.1. Market Analysis, Insights and Forecast - by Type
- 10.1.1. Hydrazine Hydrate
- 10.1.2. Hydrazine Nitrate
- 10.1.3. Hydrazine Sulfate
- 10.1.4. Other Types (Hydrazine Carbonate, etc.)
- 10.2. Market Analysis, Insights and Forecast - by Application
- 10.2.1. Corrosion Inhibitor
- 10.2.2. Explosives
- 10.2.3. Rocket Fuel
- 10.2.4. Medicinal Ingredients
- 10.2.5. Precursor to Pesticides
- 10.2.6. Blowing Agent
- 10.2.7. Other Ap
- 10.3. Market Analysis, Insights and Forecast - by End-user Industry
- 10.3.1. Pharmaceuticals
- 10.3.2. Agrochemicals
- 10.3.3. Industrial
- 10.3.4. Other End-user Industries (Water Treatment, etc.)
- 10.1. Market Analysis, Insights and Forecast - by Type
- 11. Middle East and Africa Hydrazine Market Analysis, Insights and Forecast, 2020-2032
- 11.1. Market Analysis, Insights and Forecast - by Type
- 11.1.1. Hydrazine Hydrate
- 11.1.2. Hydrazine Nitrate
- 11.1.3. Hydrazine Sulfate
- 11.1.4. Other Types (Hydrazine Carbonate, etc.)
- 11.2. Market Analysis, Insights and Forecast - by Application
- 11.2.1. Corrosion Inhibitor
- 11.2.2. Explosives
- 11.2.3. Rocket Fuel
- 11.2.4. Medicinal Ingredients
- 11.2.5. Precursor to Pesticides
- 11.2.6. Blowing Agent
- 11.2.7. Other Ap
- 11.3. Market Analysis, Insights and Forecast - by End-user Industry
- 11.3.1. Pharmaceuticals
- 11.3.2. Agrochemicals
- 11.3.3. Industrial
- 11.3.4. Other End-user Industries (Water Treatment, etc.)
- 11.1. Market Analysis, Insights and Forecast - by Type
- 12. Competitive Analysis
- 12.1. Company Profiles
- 12.1.1 Yibin Tianyuan Group*List Not Exhaustive
- 12.1.1.1. Company Overview
- 12.1.1.2. Products
- 12.1.1.3. Company Financials
- 12.1.1.4. SWOT Analysis
- 12.1.2 Arkema
- 12.1.2.1. Company Overview
- 12.1.2.2. Products
- 12.1.2.3. Company Financials
- 12.1.2.4. SWOT Analysis
- 12.1.3 BroadPharm
- 12.1.3.1. Company Overview
- 12.1.3.2. Products
- 12.1.3.3. Company Financials
- 12.1.3.4. SWOT Analysis
- 12.1.4 Arrow Fine Chemicals
- 12.1.4.1. Company Overview
- 12.1.4.2. Products
- 12.1.4.3. Company Financials
- 12.1.4.4. SWOT Analysis
- 12.1.5 Otsuka Chemical Co Ltd
- 12.1.5.1. Company Overview
- 12.1.5.2. Products
- 12.1.5.3. Company Financials
- 12.1.5.4. SWOT Analysis
- 12.1.6 Tokyo Chemical Industry Co Ltd
- 12.1.6.1. Company Overview
- 12.1.6.2. Products
- 12.1.6.3. Company Financials
- 12.1.6.4. SWOT Analysis
- 12.1.7 NIPPON CARBIDE INDUSTRIES CO INC
- 12.1.7.1. Company Overview
- 12.1.7.2. Products
- 12.1.7.3. Company Financials
- 12.1.7.4. SWOT Analysis
- 12.1.8 LANXESS
- 12.1.8.1. Company Overview
- 12.1.8.2. Products
- 12.1.8.3. Company Financials
- 12.1.8.4. SWOT Analysis
- 12.1.9 Innova Corporate
- 12.1.9.1. Company Overview
- 12.1.9.2. Products
- 12.1.9.3. Company Financials
- 12.1.9.4. SWOT Analysis
- 12.1.10 ACURO ORGANICS LIMITED
- 12.1.10.1. Company Overview
- 12.1.10.2. Products
- 12.1.10.3. Company Financials
- 12.1.10.4. SWOT Analysis
- 12.1.11 MERU CHEM PVT LTD
- 12.1.11.1. Company Overview
- 12.1.11.2. Products
- 12.1.11.3. Company Financials
- 12.1.11.4. SWOT Analysis
- 12.1.1 Yibin Tianyuan Group*List Not Exhaustive
- 12.2. Market Entropy
- 12.2.1 Company's Key Areas Served
- 12.2.2 Recent Developments
- 12.3. Company Market Share Analysis 2025
- 12.3.1 Top 5 Companies Market Share Analysis
- 12.3.2 Top 3 Companies Market Share Analysis
- 12.4. List of Potential Customers
- 13. Research Methodology
List of Figures
- Figure 1: Global Hydrazine Market Revenue Breakdown (million, %) by Region 2025 & 2033
- Figure 2: Global Hydrazine Market Volume Breakdown (kilotons, %) by Region 2025 & 2033
- Figure 3: Asia Pacific Hydrazine Market Revenue (million), by Type 2025 & 2033
- Figure 4: Asia Pacific Hydrazine Market Volume (kilotons), by Type 2025 & 2033
- Figure 5: Asia Pacific Hydrazine Market Revenue Share (%), by Type 2025 & 2033
- Figure 6: Asia Pacific Hydrazine Market Volume Share (%), by Type 2025 & 2033
- Figure 7: Asia Pacific Hydrazine Market Revenue (million), by Application 2025 & 2033
- Figure 8: Asia Pacific Hydrazine Market Volume (kilotons), by Application 2025 & 2033
- Figure 9: Asia Pacific Hydrazine Market Revenue Share (%), by Application 2025 & 2033
- Figure 10: Asia Pacific Hydrazine Market Volume Share (%), by Application 2025 & 2033
- Figure 11: Asia Pacific Hydrazine Market Revenue (million), by End-user Industry 2025 & 2033
- Figure 12: Asia Pacific Hydrazine Market Volume (kilotons), by End-user Industry 2025 & 2033
- Figure 13: Asia Pacific Hydrazine Market Revenue Share (%), by End-user Industry 2025 & 2033
- Figure 14: Asia Pacific Hydrazine Market Volume Share (%), by End-user Industry 2025 & 2033
- Figure 15: Asia Pacific Hydrazine Market Revenue (million), by Country 2025 & 2033
- Figure 16: Asia Pacific Hydrazine Market Volume (kilotons), by Country 2025 & 2033
- Figure 17: Asia Pacific Hydrazine Market Revenue Share (%), by Country 2025 & 2033
- Figure 18: Asia Pacific Hydrazine Market Volume Share (%), by Country 2025 & 2033
- Figure 19: North America Hydrazine Market Revenue (million), by Type 2025 & 2033
- Figure 20: North America Hydrazine Market Volume (kilotons), by Type 2025 & 2033
- Figure 21: North America Hydrazine Market Revenue Share (%), by Type 2025 & 2033
- Figure 22: North America Hydrazine Market Volume Share (%), by Type 2025 & 2033
- Figure 23: North America Hydrazine Market Revenue (million), by Application 2025 & 2033
- Figure 24: North America Hydrazine Market Volume (kilotons), by Application 2025 & 2033
- Figure 25: North America Hydrazine Market Revenue Share (%), by Application 2025 & 2033
- Figure 26: North America Hydrazine Market Volume Share (%), by Application 2025 & 2033
- Figure 27: North America Hydrazine Market Revenue (million), by End-user Industry 2025 & 2033
- Figure 28: North America Hydrazine Market Volume (kilotons), by End-user Industry 2025 & 2033
- Figure 29: North America Hydrazine Market Revenue Share (%), by End-user Industry 2025 & 2033
- Figure 30: North America Hydrazine Market Volume Share (%), by End-user Industry 2025 & 2033
- Figure 31: North America Hydrazine Market Revenue (million), by Country 2025 & 2033
- Figure 32: North America Hydrazine Market Volume (kilotons), by Country 2025 & 2033
- Figure 33: North America Hydrazine Market Revenue Share (%), by Country 2025 & 2033
- Figure 34: North America Hydrazine Market Volume Share (%), by Country 2025 & 2033
- Figure 35: Europe Hydrazine Market Revenue (million), by Type 2025 & 2033
- Figure 36: Europe Hydrazine Market Volume (kilotons), by Type 2025 & 2033
- Figure 37: Europe Hydrazine Market Revenue Share (%), by Type 2025 & 2033
- Figure 38: Europe Hydrazine Market Volume Share (%), by Type 2025 & 2033
- Figure 39: Europe Hydrazine Market Revenue (million), by Application 2025 & 2033
- Figure 40: Europe Hydrazine Market Volume (kilotons), by Application 2025 & 2033
- Figure 41: Europe Hydrazine Market Revenue Share (%), by Application 2025 & 2033
- Figure 42: Europe Hydrazine Market Volume Share (%), by Application 2025 & 2033
- Figure 43: Europe Hydrazine Market Revenue (million), by End-user Industry 2025 & 2033
- Figure 44: Europe Hydrazine Market Volume (kilotons), by End-user Industry 2025 & 2033
- Figure 45: Europe Hydrazine Market Revenue Share (%), by End-user Industry 2025 & 2033
- Figure 46: Europe Hydrazine Market Volume Share (%), by End-user Industry 2025 & 2033
- Figure 47: Europe Hydrazine Market Revenue (million), by Country 2025 & 2033
- Figure 48: Europe Hydrazine Market Volume (kilotons), by Country 2025 & 2033
- Figure 49: Europe Hydrazine Market Revenue Share (%), by Country 2025 & 2033
- Figure 50: Europe Hydrazine Market Volume Share (%), by Country 2025 & 2033
- Figure 51: South America Hydrazine Market Revenue (million), by Type 2025 & 2033
- Figure 52: South America Hydrazine Market Volume (kilotons), by Type 2025 & 2033
- Figure 53: South America Hydrazine Market Revenue Share (%), by Type 2025 & 2033
- Figure 54: South America Hydrazine Market Volume Share (%), by Type 2025 & 2033
- Figure 55: South America Hydrazine Market Revenue (million), by Application 2025 & 2033
- Figure 56: South America Hydrazine Market Volume (kilotons), by Application 2025 & 2033
- Figure 57: South America Hydrazine Market Revenue Share (%), by Application 2025 & 2033
- Figure 58: South America Hydrazine Market Volume Share (%), by Application 2025 & 2033
- Figure 59: South America Hydrazine Market Revenue (million), by End-user Industry 2025 & 2033
- Figure 60: South America Hydrazine Market Volume (kilotons), by End-user Industry 2025 & 2033
- Figure 61: South America Hydrazine Market Revenue Share (%), by End-user Industry 2025 & 2033
- Figure 62: South America Hydrazine Market Volume Share (%), by End-user Industry 2025 & 2033
- Figure 63: South America Hydrazine Market Revenue (million), by Country 2025 & 2033
- Figure 64: South America Hydrazine Market Volume (kilotons), by Country 2025 & 2033
- Figure 65: South America Hydrazine Market Revenue Share (%), by Country 2025 & 2033
- Figure 66: South America Hydrazine Market Volume Share (%), by Country 2025 & 2033
- Figure 67: Middle East and Africa Hydrazine Market Revenue (million), by Type 2025 & 2033
- Figure 68: Middle East and Africa Hydrazine Market Volume (kilotons), by Type 2025 & 2033
- Figure 69: Middle East and Africa Hydrazine Market Revenue Share (%), by Type 2025 & 2033
- Figure 70: Middle East and Africa Hydrazine Market Volume Share (%), by Type 2025 & 2033
- Figure 71: Middle East and Africa Hydrazine Market Revenue (million), by Application 2025 & 2033
- Figure 72: Middle East and Africa Hydrazine Market Volume (kilotons), by Application 2025 & 2033
- Figure 73: Middle East and Africa Hydrazine Market Revenue Share (%), by Application 2025 & 2033
- Figure 74: Middle East and Africa Hydrazine Market Volume Share (%), by Application 2025 & 2033
- Figure 75: Middle East and Africa Hydrazine Market Revenue (million), by End-user Industry 2025 & 2033
- Figure 76: Middle East and Africa Hydrazine Market Volume (kilotons), by End-user Industry 2025 & 2033
- Figure 77: Middle East and Africa Hydrazine Market Revenue Share (%), by End-user Industry 2025 & 2033
- Figure 78: Middle East and Africa Hydrazine Market Volume Share (%), by End-user Industry 2025 & 2033
- Figure 79: Middle East and Africa Hydrazine Market Revenue (million), by Country 2025 & 2033
- Figure 80: Middle East and Africa Hydrazine Market Volume (kilotons), by Country 2025 & 2033
- Figure 81: Middle East and Africa Hydrazine Market Revenue Share (%), by Country 2025 & 2033
- Figure 82: Middle East and Africa Hydrazine Market Volume Share (%), by Country 2025 & 2033
List of Tables
- Table 1: Global Hydrazine Market Revenue million Forecast, by Type 2020 & 2033
- Table 2: Global Hydrazine Market Volume kilotons Forecast, by Type 2020 & 2033
- Table 3: Global Hydrazine Market Revenue million Forecast, by Application 2020 & 2033
- Table 4: Global Hydrazine Market Volume kilotons Forecast, by Application 2020 & 2033
- Table 5: Global Hydrazine Market Revenue million Forecast, by End-user Industry 2020 & 2033
- Table 6: Global Hydrazine Market Volume kilotons Forecast, by End-user Industry 2020 & 2033
- Table 7: Global Hydrazine Market Revenue million Forecast, by Region 2020 & 2033
- Table 8: Global Hydrazine Market Volume kilotons Forecast, by Region 2020 & 2033
- Table 9: Global Hydrazine Market Revenue million Forecast, by Type 2020 & 2033
- Table 10: Global Hydrazine Market Volume kilotons Forecast, by Type 2020 & 2033
- Table 11: Global Hydrazine Market Revenue million Forecast, by Application 2020 & 2033
- Table 12: Global Hydrazine Market Volume kilotons Forecast, by Application 2020 & 2033
- Table 13: Global Hydrazine Market Revenue million Forecast, by End-user Industry 2020 & 2033
- Table 14: Global Hydrazine Market Volume kilotons Forecast, by End-user Industry 2020 & 2033
- Table 15: Global Hydrazine Market Revenue million Forecast, by Country 2020 & 2033
- Table 16: Global Hydrazine Market Volume kilotons Forecast, by Country 2020 & 2033
- Table 17: China Hydrazine Market Revenue (million) Forecast, by Application 2020 & 2033
- Table 18: China Hydrazine Market Volume (kilotons) Forecast, by Application 2020 & 2033
- Table 19: India Hydrazine Market Revenue (million) Forecast, by Application 2020 & 2033
- Table 20: India Hydrazine Market Volume (kilotons) Forecast, by Application 2020 & 2033
- Table 21: Japan Hydrazine Market Revenue (million) Forecast, by Application 2020 & 2033
- Table 22: Japan Hydrazine Market Volume (kilotons) Forecast, by Application 2020 & 2033
- Table 23: South Korea Hydrazine Market Revenue (million) Forecast, by Application 2020 & 2033
- Table 24: South Korea Hydrazine Market Volume (kilotons) Forecast, by Application 2020 & 2033
- Table 25: Rest of Asia Pacific Hydrazine Market Revenue (million) Forecast, by Application 2020 & 2033
- Table 26: Rest of Asia Pacific Hydrazine Market Volume (kilotons) Forecast, by Application 2020 & 2033
- Table 27: Global Hydrazine Market Revenue million Forecast, by Type 2020 & 2033
- Table 28: Global Hydrazine Market Volume kilotons Forecast, by Type 2020 & 2033
- Table 29: Global Hydrazine Market Revenue million Forecast, by Application 2020 & 2033
- Table 30: Global Hydrazine Market Volume kilotons Forecast, by Application 2020 & 2033
- Table 31: Global Hydrazine Market Revenue million Forecast, by End-user Industry 2020 & 2033
- Table 32: Global Hydrazine Market Volume kilotons Forecast, by End-user Industry 2020 & 2033
- Table 33: Global Hydrazine Market Revenue million Forecast, by Country 2020 & 2033
- Table 34: Global Hydrazine Market Volume kilotons Forecast, by Country 2020 & 2033
- Table 35: United States Hydrazine Market Revenue (million) Forecast, by Application 2020 & 2033
- Table 36: United States Hydrazine Market Volume (kilotons) Forecast, by Application 2020 & 2033
- Table 37: Canada Hydrazine Market Revenue (million) Forecast, by Application 2020 & 2033
- Table 38: Canada Hydrazine Market Volume (kilotons) Forecast, by Application 2020 & 2033
- Table 39: Mexico Hydrazine Market Revenue (million) Forecast, by Application 2020 & 2033
- Table 40: Mexico Hydrazine Market Volume (kilotons) Forecast, by Application 2020 & 2033
- Table 41: Global Hydrazine Market Revenue million Forecast, by Type 2020 & 2033
- Table 42: Global Hydrazine Market Volume kilotons Forecast, by Type 2020 & 2033
- Table 43: Global Hydrazine Market Revenue million Forecast, by Application 2020 & 2033
- Table 44: Global Hydrazine Market Volume kilotons Forecast, by Application 2020 & 2033
- Table 45: Global Hydrazine Market Revenue million Forecast, by End-user Industry 2020 & 2033
- Table 46: Global Hydrazine Market Volume kilotons Forecast, by End-user Industry 2020 & 2033
- Table 47: Global Hydrazine Market Revenue million Forecast, by Country 2020 & 2033
- Table 48: Global Hydrazine Market Volume kilotons Forecast, by Country 2020 & 2033
- Table 49: Germany Hydrazine Market Revenue (million) Forecast, by Application 2020 & 2033
- Table 50: Germany Hydrazine Market Volume (kilotons) Forecast, by Application 2020 & 2033
- Table 51: United Kingdom Hydrazine Market Revenue (million) Forecast, by Application 2020 & 2033
- Table 52: United Kingdom Hydrazine Market Volume (kilotons) Forecast, by Application 2020 & 2033
- Table 53: Italy Hydrazine Market Revenue (million) Forecast, by Application 2020 & 2033
- Table 54: Italy Hydrazine Market Volume (kilotons) Forecast, by Application 2020 & 2033
- Table 55: France Hydrazine Market Revenue (million) Forecast, by Application 2020 & 2033
- Table 56: France Hydrazine Market Volume (kilotons) Forecast, by Application 2020 & 2033
- Table 57: Rest of Europe Hydrazine Market Revenue (million) Forecast, by Application 2020 & 2033
- Table 58: Rest of Europe Hydrazine Market Volume (kilotons) Forecast, by Application 2020 & 2033
- Table 59: Global Hydrazine Market Revenue million Forecast, by Type 2020 & 2033
- Table 60: Global Hydrazine Market Volume kilotons Forecast, by Type 2020 & 2033
- Table 61: Global Hydrazine Market Revenue million Forecast, by Application 2020 & 2033
- Table 62: Global Hydrazine Market Volume kilotons Forecast, by Application 2020 & 2033
- Table 63: Global Hydrazine Market Revenue million Forecast, by End-user Industry 2020 & 2033
- Table 64: Global Hydrazine Market Volume kilotons Forecast, by End-user Industry 2020 & 2033
- Table 65: Global Hydrazine Market Revenue million Forecast, by Country 2020 & 2033
- Table 66: Global Hydrazine Market Volume kilotons Forecast, by Country 2020 & 2033
- Table 67: Brazil Hydrazine Market Revenue (million) Forecast, by Application 2020 & 2033
- Table 68: Brazil Hydrazine Market Volume (kilotons) Forecast, by Application 2020 & 2033
- Table 69: Argentina Hydrazine Market Revenue (million) Forecast, by Application 2020 & 2033
- Table 70: Argentina Hydrazine Market Volume (kilotons) Forecast, by Application 2020 & 2033
- Table 71: Rest of South America Hydrazine Market Revenue (million) Forecast, by Application 2020 & 2033
- Table 72: Rest of South America Hydrazine Market Volume (kilotons) Forecast, by Application 2020 & 2033
- Table 73: Global Hydrazine Market Revenue million Forecast, by Type 2020 & 2033
- Table 74: Global Hydrazine Market Volume kilotons Forecast, by Type 2020 & 2033
- Table 75: Global Hydrazine Market Revenue million Forecast, by Application 2020 & 2033
- Table 76: Global Hydrazine Market Volume kilotons Forecast, by Application 2020 & 2033
- Table 77: Global Hydrazine Market Revenue million Forecast, by End-user Industry 2020 & 2033
- Table 78: Global Hydrazine Market Volume kilotons Forecast, by End-user Industry 2020 & 2033
- Table 79: Global Hydrazine Market Revenue million Forecast, by Country 2020 & 2033
- Table 80: Global Hydrazine Market Volume kilotons Forecast, by Country 2020 & 2033
- Table 81: Saudi Arabia Hydrazine Market Revenue (million) Forecast, by Application 2020 & 2033
- Table 82: Saudi Arabia Hydrazine Market Volume (kilotons) Forecast, by Application 2020 & 2033
- Table 83: South Africa Hydrazine Market Revenue (million) Forecast, by Application 2020 & 2033
- Table 84: South Africa Hydrazine Market Volume (kilotons) Forecast, by Application 2020 & 2033
- Table 85: Rest of Middle East and Africa Hydrazine Market Revenue (million) Forecast, by Application 2020 & 2033
- Table 86: Rest of Middle East and Africa Hydrazine Market Volume (kilotons) Forecast, by Application 2020 & 2033
Frequently Asked Questions
1. What is the projected Compound Annual Growth Rate (CAGR) of the Hydrazine Market?
The projected CAGR is approximately 6%.
2. Which companies are prominent players in the Hydrazine Market?
Key companies in the market include Yibin Tianyuan Group*List Not Exhaustive, Arkema, BroadPharm, Arrow Fine Chemicals, Otsuka Chemical Co Ltd, Tokyo Chemical Industry Co Ltd, NIPPON CARBIDE INDUSTRIES CO INC, LANXESS, Innova Corporate, ACURO ORGANICS LIMITED, MERU CHEM PVT LTD.
3. What are the main segments of the Hydrazine Market?
The market segments include Type, Application, End-user Industry.
4. Can you provide details about the market size?
The market size is estimated to be USD 543 million as of 2022.
5. What are some drivers contributing to market growth?
Increasing Demand from Agrochemicals; Growing Applications in Pharmaceutical Industry; Other Drivers.
6. What are the notable trends driving market growth?
Increasing Demand from Pharmaceutical Sector.
7. Are there any restraints impacting market growth?
Highly Toxic Nature of Hydrazine; Other Restraints.
8. Can you provide examples of recent developments in the market?
May 2023: SynCrest Inc., a peptide and nucleotide CRDMO (Contract Research, Development, and Manufacturing Organization), announced the availability of its services for pharmaceutical companies and research institutions in Japan, Europe, North America, and South America. (Hydrazine is used in the manufacturing of pharmaceutical drugs.)
9. What pricing options are available for accessing the report?
Pricing options include single-user, multi-user, and enterprise licenses priced at USD 4750, USD 5250, and USD 8750 respectively.
10. Is the market size provided in terms of value or volume?
The market size is provided in terms of value, measured in million and volume, measured in kilotons.
11. Are there any specific market keywords associated with the report?
Yes, the market keyword associated with the report is "Hydrazine Market," which aids in identifying and referencing the specific market segment covered.
12. How do I determine which pricing option suits my needs best?
The pricing options vary based on user requirements and access needs. Individual users may opt for single-user licenses, while businesses requiring broader access may choose multi-user or enterprise licenses for cost-effective access to the report.
13. Are there any additional resources or data provided in the Hydrazine Market report?
While the report offers comprehensive insights, it's advisable to review the specific contents or supplementary materials provided to ascertain if additional resources or data are available.
14. How can I stay updated on further developments or reports in the Hydrazine Market?
To stay informed about further developments, trends, and reports in the Hydrazine Market, consider subscribing to industry newsletters, following relevant companies and organizations, or regularly checking reputable industry news sources and publications.
Methodology
Step 1 - Identification of Relevant Samples Size from Population Database


Step 2 - Approaches for Defining Global Market Size (Value, Volume* & Price*)

Note*: In applicable scenarios
Step 3 - Data Sources
Primary Research
- Web Analytics
- Survey Reports
- Research Institute
- Latest Research Reports
- Opinion Leaders
Secondary Research
- Annual Reports
- White Paper
- Latest Press Release
- Industry Association
- Paid Database
- Investor Presentations

Step 4 - Data Triangulation
Involves using different sources of information in order to increase the validity of a study
These sources are likely to be stakeholders in a program - participants, other researchers, program staff, other community members, and so on.
Then we put all data in single framework & apply various statistical tools to find out the dynamic on the market.
During the analysis stage, feedback from the stakeholder groups would be compared to determine areas of agreement as well as areas of divergence