

Key Insights
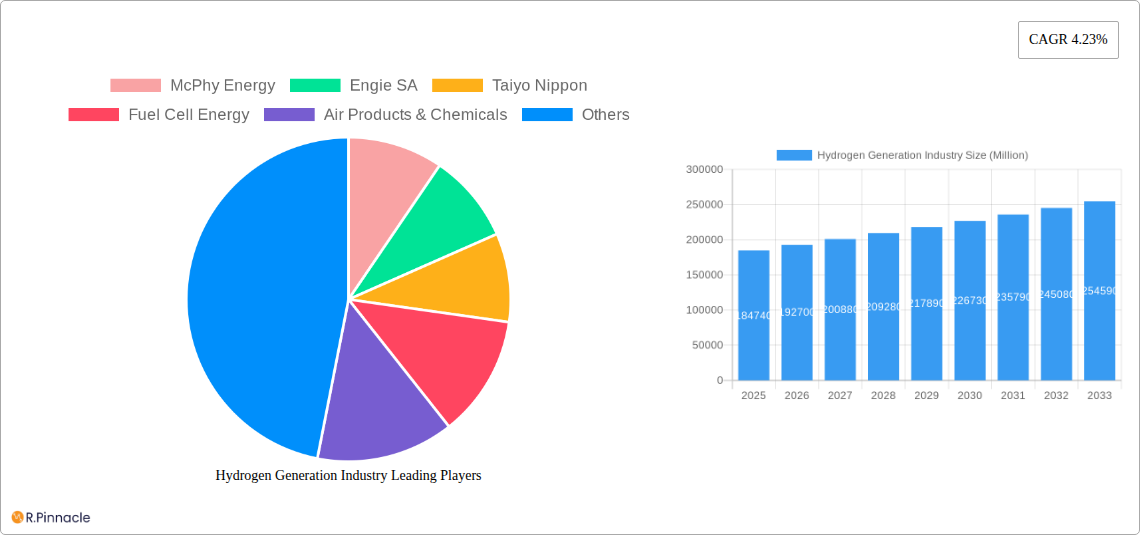
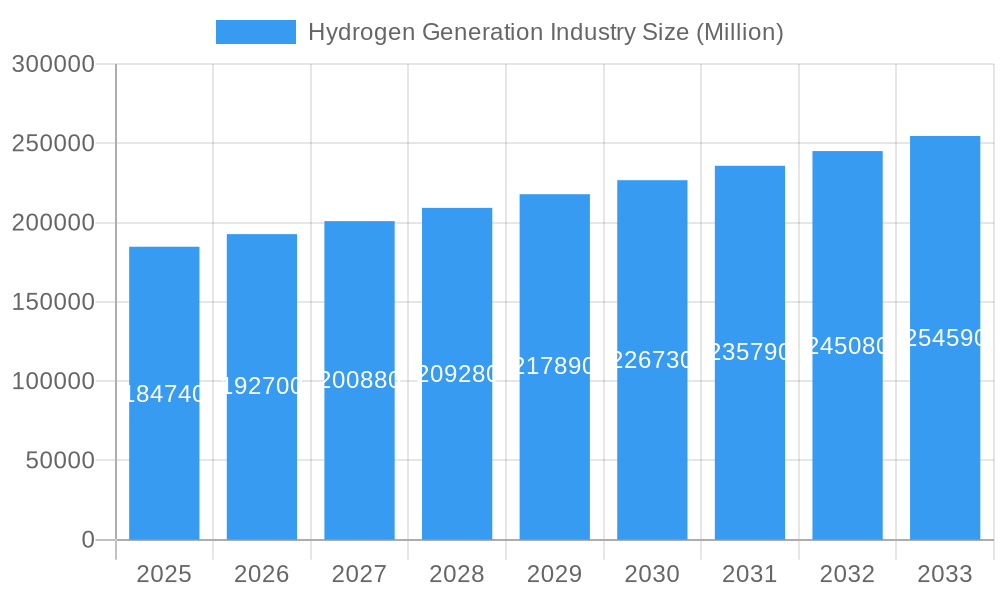
The hydrogen generation industry is experiencing robust growth, projected to reach a market size of $184.74 billion in 2025 and exhibiting a compound annual growth rate (CAGR) of 4.23%. This expansion is driven by increasing demand for clean energy sources, stringent environmental regulations aimed at reducing carbon emissions, and the growing adoption of hydrogen in various applications like oil refining, chemical processing, and iron & steel production. The transition towards a low-carbon economy is significantly boosting the demand for green hydrogen, produced through renewable energy sources like solar and wind power, making it a key driver of market growth. Technological advancements in electrolysis and steam methane reforming (SMR) are further enhancing efficiency and reducing production costs, contributing to wider adoption. While grey hydrogen (produced from natural gas) currently dominates the market, the future holds significant potential for blue hydrogen (produced from natural gas with carbon capture) and green hydrogen, due to growing environmental concerns and government incentives promoting clean energy technologies.
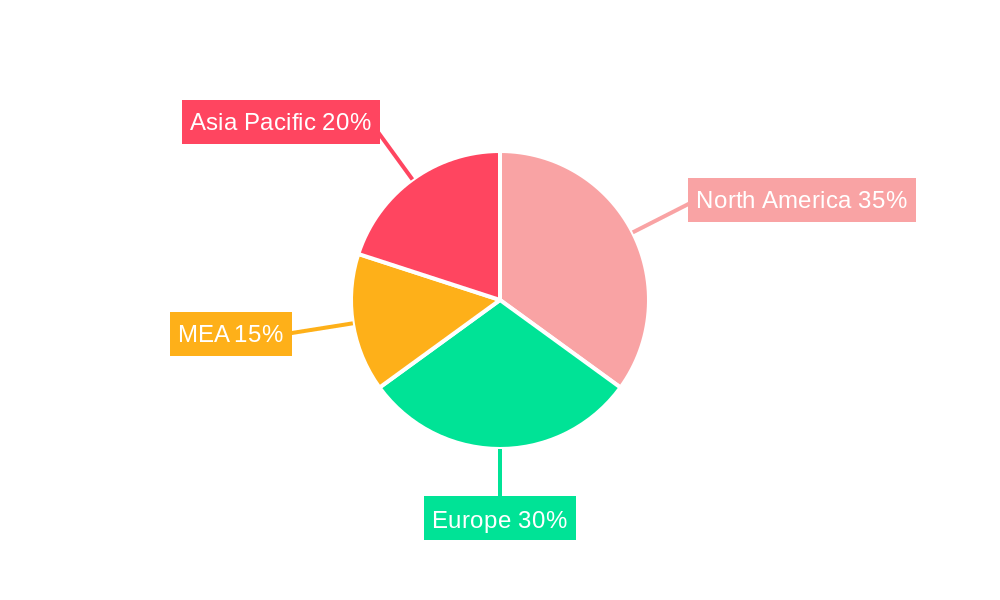
Hydrogen Generation Industry Market Size (In Billion)
Despite significant growth potential, challenges remain. High capital expenditure for green hydrogen production facilities and the development of efficient hydrogen storage and transportation infrastructure represent key restraints. Furthermore, the fluctuating prices of natural gas (a key input for grey and blue hydrogen) and the intermittent nature of renewable energy sources for green hydrogen production continue to pose uncertainties. However, ongoing research and development, coupled with supportive government policies, are gradually addressing these challenges, paving the way for sustained growth in the hydrogen generation industry throughout the forecast period (2025-2033). Regional variations exist, with North America and Europe anticipated to hold significant market share, driven by strong government support and the presence of established players in the energy sector. The Asia-Pacific region also demonstrates considerable growth potential due to its rapidly expanding industrial sector.
Hydrogen Generation Industry Company Market Share
Hydrogen Generation Industry Market Report: 2019-2033
This comprehensive report provides an in-depth analysis of the hydrogen generation industry, encompassing market size, growth projections, technological advancements, and key players. The study period covers 2019-2033, with a focus on the base year 2025 and a forecast period of 2025-2033. This report is invaluable for industry professionals, investors, and researchers seeking to understand the current state and future trajectory of this rapidly evolving sector. The global market is expected to reach xx Million by 2033.
Hydrogen Generation Industry Market Structure & Innovation Trends
The hydrogen generation industry exhibits a moderately concentrated market structure, with several major players commanding significant market share. Companies like Air Liquide, Linde plc, and Engie SA hold substantial positions, driven by their extensive infrastructure and technological capabilities. However, the market is witnessing increased competition from smaller, innovative companies focused on specific technologies or niche applications. Market share data for 2024 suggests Air Liquide holds approximately 15%, Linde plc holds 12%, and Engie SA holds 10%, with the remaining share distributed among other players. Innovation is primarily driven by the need for cost-effective and sustainable hydrogen production methods, spurred by increasing environmental regulations and government incentives. The regulatory landscape is evolving rapidly, with various countries implementing policies to support the development of a green hydrogen economy. The industry also faces competition from alternative energy sources, particularly renewable electricity. Significant M&A activity has been observed in recent years, with deal values exceeding xx Million in 2024 alone, indicating a trend of consolidation and expansion within the sector.
- Market Concentration: Moderately concentrated
- Key Players: Air Liquide, Linde plc, Engie SA, McPhy Energy, ITM Power plc, Enapter, Messer Group GmbH, Cummins, Fuel Cell Energy, Air Products & Chemicals, Taiyo Nippon Sanso
- M&A Activity: Significant, with deal values exceeding xx Million in 2024.
Hydrogen Generation Industry Market Dynamics & Trends
The hydrogen generation industry is currently experiencing a period of significant and sustained growth. This expansion is primarily fueled by the escalating demand from a diverse range of sectors, including the rapidly evolving transportation industry, the critical need for effective energy storage solutions, and various industrial applications that are increasingly prioritizing decarbonization. Analysts project that the market will continue this upward trajectory, achieving a robust Compound Annual Growth Rate (CAGR) of approximately **15-20%** during the forecast period spanning 2025-2033. A key catalyst for this growth is the ongoing technological disruption, particularly within electrolysis technologies and the seamless integration of renewable energy sources. These advancements are instrumental in driving down the cost and significantly improving the overall efficiency of hydrogen production. Concurrently, consumer preferences are undergoing a notable shift towards cleaner and more sustainable energy alternatives, creating a highly favorable and dynamic environment for the widespread adoption of green hydrogen technologies. The competitive landscape within the industry is becoming increasingly intense, compelling companies to concentrate on fostering innovation, implementing strategies for cost reduction, and forging strategic partnerships to solidify and expand their market share. The market penetration of green hydrogen, which currently stands at an estimated **5-10%** in 2025, is anticipated to surge to **25-35%** by 2033. The overarching global imperative to decarbonize across a multitude of industries stands as a principal driver for this market expansion. This is further bolstered by substantial government support in the form of subsidies, attractive tax incentives, and dedicated research funding for clean energy initiatives. Moreover, ongoing advancements in electrolyzer technology are yielding greater operational efficiency and contributing to lower production costs, thereby acting as a further stimulant for market growth.
Dominant Regions & Segments in Hydrogen Generation Industry
The global hydrogen generation market exhibits distinct regional patterns in terms of both current production capabilities and deployment strategies. Europe and North America currently stand as the leading regions, demonstrating significant advancements in both hydrogen production infrastructure and its widespread application. However, the Asia-Pacific region is poised for substantial growth in the forthcoming years, largely attributed to ambitious, large-scale investments in renewable energy infrastructure and the implementation of supportive government policies aimed at fostering hydrogen adoption.
- Leading Regions: Europe and North America (current leaders), with Asia-Pacific projected for significant future growth and potential to become a dominant player.
- Dominant Segments:
- Source: While green hydrogen is rapidly gaining momentum and capturing significant market interest due to its environmental benefits, grey hydrogen continues to hold a substantial share of the market due to its current lower production cost and established infrastructure. Blue hydrogen is strategically positioned to serve as a crucial transitionary solution, bridging the gap between existing fossil fuel-based production and fully renewable hydrogen.
- Technology: Steam Methane Reforming (SMR) currently dominates the market owing to its established infrastructure and economies of scale. However, advanced electrolyzer technologies, including Proton Exchange Membrane (PEM), Alkaline, and Solid Oxide Electrolyzer Cells (SOEC), are experiencing rapid advancements and are steadily gaining market traction due to their increasing efficiency and potential for green hydrogen production.
- Application: Industrial applications, such as oil refining, chemical processing, and iron & steel production, remain the primary consumers of hydrogen. Nevertheless, the transportation sector, particularly with the growing adoption of fuel cell electric vehicles (FCEVs), is exhibiting rapid and promising growth potential.
Key Regional Drivers for Growth:
- Europe: Characterized by stringent environmental regulations, substantial and ongoing investments in renewable energy projects, and a robust industrial base actively seeking decarbonization solutions.
- North America: Driven by significant government initiatives such as the Inflation Reduction Act, a continuous increase in renewable energy capacity, and a burgeoning demand from the transportation sector for cleaner fuel alternatives.
- Asia-Pacific: Fueled by rapid economic growth, significant investments in developing extensive renewable energy infrastructure, and strong government support for the research, development, and commercialization of hydrogen technologies.
Hydrogen Generation Industry Product Innovations
Recent innovations within the hydrogen generation industry are predominantly focused on enhancing the efficiency and driving down the cost associated with hydrogen production. Electrolyzer technologies, in particular, are undergoing rapid advancements, with PEM electrolysis emerging as a technology with significant potential for large-scale industrial deployment. The development and integration of novel materials and advanced designs are contributing to improved electrolyzer durability and a reduction in overall capital expenditure. Furthermore, the concept of integrated systems, which seamlessly combine renewable energy sources with hydrogen production facilities, is gaining considerable traction. These integrated solutions are designed to optimize energy utilization and substantially lower operational costs. In parallel, significant R&D efforts are being directed towards developing advanced hydrogen storage and efficient transportation solutions, which are deemed critical for facilitating wider market adoption and unlocking the full potential of the hydrogen economy.
Report Scope & Segmentation Analysis
This report segments the hydrogen generation market by source (blue, green, grey hydrogen), technology (SMR, coal gasification, other technologies), and application (oil refining, chemical processing, iron & steel production, other applications). Each segment is analyzed in detail, providing market size estimates, growth projections, and competitive dynamics. The report also covers key players, their market share, and recent developments in each segment. Growth projections vary depending on the segment, with green hydrogen and electrolyzer technologies expected to demonstrate the highest growth rates.
Key Drivers of Hydrogen Generation Industry Growth
The growth of the hydrogen generation industry is driven by a combination of factors: the increasing need for clean energy solutions to mitigate climate change, supportive government policies and incentives, advancements in electrolysis technology leading to cost reductions, and growing demand from various sectors like transportation and industry. The falling cost of renewable energy sources, coupled with increasing energy security concerns, further fuels this growth.
Challenges in the Hydrogen Generation Industry Sector
The industry faces challenges including the high capital cost of new facilities, the lack of established infrastructure for hydrogen transportation and storage, and the competition from other clean energy technologies. Furthermore, the intermittency of renewable energy sources used for green hydrogen production poses logistical challenges. Regulatory uncertainty and varying policies across different regions create complexities for large-scale deployment.
Emerging Opportunities in Hydrogen Generation Industry
The hydrogen generation industry is ripe with emerging opportunities, notably the burgeoning demand for hydrogen as a clean fuel in the transportation sector. This includes applications in heavy-duty trucking, shipping, and aviation. The development of novel applications in grid-scale energy storage and distributed power generation also presents significant growth avenues. Furthermore, the strategic expansion of hydrogen production and distribution infrastructure across key industrial hubs and transportation corridors is creating substantial market potential. Advances in materials science, particularly in catalyst development and membrane technology, alongside ongoing process optimization, continue to unlock further cost savings and drive incremental increases in hydrogen production efficiencies. The forging of strategic partnerships between large, established industrial players and agile technology start-ups is proving to be a powerful catalyst for generating innovative solutions and accelerating overall market growth.
Leading Players in the Hydrogen Generation Industry Market
- McPhy Energy
- Engie SA
- Taiyo Nippon Sanso
- Fuel Cell Energy
- Air Products & Chemicals
- Linde plc
- Cummins
- Messer Group GmbH
- Air Liquide
- ITM Power plc
- Enapter
Key Developments in Hydrogen Generation Industry Industry
- October 2023: H2B2 successfully inaugurated the SoHyCal green hydrogen plant located in Fresno, California. This state-of-the-art facility utilizes advanced PEM electrolysis technology for its operations.
- October 2023: Hygenco Green Energies announced its ambitious plans to develop a significant green hydrogen plant in Maharashtra, India. This facility will be dedicated to supplying green hydrogen and oxygen to Sterlite Technologies Ltd., marking a key development in the region.
- May 2023: RWE and the Westfalen Group have formalized plans to develop up to 70 hydrogen refueling stations across Germany by the year 2030. The first of these stations is strategically located at RWE's Emsland power plant, signifying a concrete step towards expanding hydrogen infrastructure.
Future Outlook for Hydrogen Generation Industry Market
The future of the hydrogen generation industry looks promising, with substantial growth expected in the coming years. Continued technological advancements, supportive government policies, and increasing demand from various sectors will drive market expansion. Strategic partnerships and collaborations will be key to overcoming challenges and accelerating the adoption of hydrogen as a clean energy solution. The market is poised for significant expansion, particularly in green hydrogen production and its application in diverse sectors, promising a cleaner and more sustainable energy future.
Hydrogen Generation Industry Segmentation
-
1. Source
- 1.1. Blue hydrogen
- 1.2. Green hydrogen
- 1.3. Grey Hydrogen
-
2. Technology
- 2.1. Steam Methane Reforming (SMR)
- 2.2. Coal Gasification
- 2.3. Other Technologies
-
3. Application
- 3.1. Oil Refining
- 3.2. Chemical Processing
- 3.3. Iron & Steel Production
- 3.4. Other Applications
Hydrogen Generation Industry Segmentation By Geography
-
1. North America
- 1.1. United States
- 1.2. Canada
- 1.3. Rest of North America
-
2. Europe
- 2.1. Germany
- 2.2. France
- 2.3. Italy
- 2.4. United Kingdom
- 2.5. Russian Federation
- 2.6. Rest of Europe
- 3. Middle East
-
4. Saudi Arabia
- 4.1. United Arab Emirates
- 4.2. South Africa
- 4.3. Rest of Middle East and Africa
-
5. Asia Pacific
- 5.1. China
- 5.2. India
- 5.3. Japan
- 5.4. South Korea
- 5.5. Rest of Asia Pacific
-
6. South America
- 6.1. Brazil
- 6.2. Argentina
- 6.3. Rest of South America
Hydrogen Generation Industry Regional Market Share
Geographic Coverage of Hydrogen Generation Industry
Hydrogen Generation Industry REPORT HIGHLIGHTS
| Aspects | Details |
|---|---|
| Study Period | 2020-2034 |
| Base Year | 2025 |
| Estimated Year | 2026 |
| Forecast Period | 2026-2034 |
| Historical Period | 2020-2025 |
| Growth Rate | CAGR of 4.23% from 2020-2034 |
| Segmentation |
|
Table of Contents
- 1. Introduction
- 1.1. Research Scope
- 1.2. Market Segmentation
- 1.3. Research Objective
- 1.4. Definitions and Assumptions
- 2. Executive Summary
- 2.1. Market Snapshot
- 3. Market Dynamics
- 3.1. Market Drivers
- 3.2. Market Restrains
- 3.3. Market Trends
- 3.4. Market Opportunities
- 4. Market Factor Analysis
- 4.1. Porters Five Forces
- 4.1.1. Bargaining Power of Suppliers
- 4.1.2. Bargaining Power of Buyers
- 4.1.3. Threat of New Entrants
- 4.1.4. Threat of Substitutes
- 4.1.5. Competitive Rivalry
- 4.2. PESTEL analysis
- 4.3. BCG Analysis
- 4.3.1. Stars (High Growth, High Market Share)
- 4.3.2. Cash Cows (Low Growth, High Market Share)
- 4.3.3. Question Mark (High Growth, Low Market Share)
- 4.3.4. Dogs (Low Growth, Low Market Share)
- 4.4. Ansoff Matrix Analysis
- 4.5. Supply Chain Analysis
- 4.6. Regulatory Landscape
- 4.7. Current Market Potential and Opportunity Assessment (TAM–SAM–SOM Framework)
- 4.8. PRI Analyst Note
- 4.1. Porters Five Forces
- 5. Market Analysis, Insights and Forecast 2021-2033
- 5.1. Market Analysis, Insights and Forecast - by Source
- 5.1.1. Blue hydrogen
- 5.1.2. Green hydrogen
- 5.1.3. Grey Hydrogen
- 5.2. Market Analysis, Insights and Forecast - by Technology
- 5.2.1. Steam Methane Reforming (SMR)
- 5.2.2. Coal Gasification
- 5.2.3. Other Technologies
- 5.3. Market Analysis, Insights and Forecast - by Application
- 5.3.1. Oil Refining
- 5.3.2. Chemical Processing
- 5.3.3. Iron & Steel Production
- 5.3.4. Other Applications
- 5.4. Market Analysis, Insights and Forecast - by Region
- 5.4.1. North America
- 5.4.2. Europe
- 5.4.3. Middle East
- 5.4.4. Saudi Arabia
- 5.4.5. Asia Pacific
- 5.4.6. South America
- 5.1. Market Analysis, Insights and Forecast - by Source
- 6. Global Hydrogen Generation Industry Analysis, Insights and Forecast, 2021-2033
- 6.1. Market Analysis, Insights and Forecast - by Source
- 6.1.1. Blue hydrogen
- 6.1.2. Green hydrogen
- 6.1.3. Grey Hydrogen
- 6.2. Market Analysis, Insights and Forecast - by Technology
- 6.2.1. Steam Methane Reforming (SMR)
- 6.2.2. Coal Gasification
- 6.2.3. Other Technologies
- 6.3. Market Analysis, Insights and Forecast - by Application
- 6.3.1. Oil Refining
- 6.3.2. Chemical Processing
- 6.3.3. Iron & Steel Production
- 6.3.4. Other Applications
- 6.1. Market Analysis, Insights and Forecast - by Source
- 7. North America Hydrogen Generation Industry Analysis, Insights and Forecast, 2020-2032
- 7.1. Market Analysis, Insights and Forecast - by Source
- 7.1.1. Blue hydrogen
- 7.1.2. Green hydrogen
- 7.1.3. Grey Hydrogen
- 7.2. Market Analysis, Insights and Forecast - by Technology
- 7.2.1. Steam Methane Reforming (SMR)
- 7.2.2. Coal Gasification
- 7.2.3. Other Technologies
- 7.3. Market Analysis, Insights and Forecast - by Application
- 7.3.1. Oil Refining
- 7.3.2. Chemical Processing
- 7.3.3. Iron & Steel Production
- 7.3.4. Other Applications
- 7.1. Market Analysis, Insights and Forecast - by Source
- 8. Europe Hydrogen Generation Industry Analysis, Insights and Forecast, 2020-2032
- 8.1. Market Analysis, Insights and Forecast - by Source
- 8.1.1. Blue hydrogen
- 8.1.2. Green hydrogen
- 8.1.3. Grey Hydrogen
- 8.2. Market Analysis, Insights and Forecast - by Technology
- 8.2.1. Steam Methane Reforming (SMR)
- 8.2.2. Coal Gasification
- 8.2.3. Other Technologies
- 8.3. Market Analysis, Insights and Forecast - by Application
- 8.3.1. Oil Refining
- 8.3.2. Chemical Processing
- 8.3.3. Iron & Steel Production
- 8.3.4. Other Applications
- 8.1. Market Analysis, Insights and Forecast - by Source
- 9. Middle East Hydrogen Generation Industry Analysis, Insights and Forecast, 2020-2032
- 9.1. Market Analysis, Insights and Forecast - by Source
- 9.1.1. Blue hydrogen
- 9.1.2. Green hydrogen
- 9.1.3. Grey Hydrogen
- 9.2. Market Analysis, Insights and Forecast - by Technology
- 9.2.1. Steam Methane Reforming (SMR)
- 9.2.2. Coal Gasification
- 9.2.3. Other Technologies
- 9.3. Market Analysis, Insights and Forecast - by Application
- 9.3.1. Oil Refining
- 9.3.2. Chemical Processing
- 9.3.3. Iron & Steel Production
- 9.3.4. Other Applications
- 9.1. Market Analysis, Insights and Forecast - by Source
- 10. Saudi Arabia Hydrogen Generation Industry Analysis, Insights and Forecast, 2020-2032
- 10.1. Market Analysis, Insights and Forecast - by Source
- 10.1.1. Blue hydrogen
- 10.1.2. Green hydrogen
- 10.1.3. Grey Hydrogen
- 10.2. Market Analysis, Insights and Forecast - by Technology
- 10.2.1. Steam Methane Reforming (SMR)
- 10.2.2. Coal Gasification
- 10.2.3. Other Technologies
- 10.3. Market Analysis, Insights and Forecast - by Application
- 10.3.1. Oil Refining
- 10.3.2. Chemical Processing
- 10.3.3. Iron & Steel Production
- 10.3.4. Other Applications
- 10.1. Market Analysis, Insights and Forecast - by Source
- 11. Asia Pacific Hydrogen Generation Industry Analysis, Insights and Forecast, 2020-2032
- 11.1. Market Analysis, Insights and Forecast - by Source
- 11.1.1. Blue hydrogen
- 11.1.2. Green hydrogen
- 11.1.3. Grey Hydrogen
- 11.2. Market Analysis, Insights and Forecast - by Technology
- 11.2.1. Steam Methane Reforming (SMR)
- 11.2.2. Coal Gasification
- 11.2.3. Other Technologies
- 11.3. Market Analysis, Insights and Forecast - by Application
- 11.3.1. Oil Refining
- 11.3.2. Chemical Processing
- 11.3.3. Iron & Steel Production
- 11.3.4. Other Applications
- 11.1. Market Analysis, Insights and Forecast - by Source
- 12. South America Hydrogen Generation Industry Analysis, Insights and Forecast, 2020-2032
- 12.1. Market Analysis, Insights and Forecast - by Source
- 12.1.1. Blue hydrogen
- 12.1.2. Green hydrogen
- 12.1.3. Grey Hydrogen
- 12.2. Market Analysis, Insights and Forecast - by Technology
- 12.2.1. Steam Methane Reforming (SMR)
- 12.2.2. Coal Gasification
- 12.2.3. Other Technologies
- 12.3. Market Analysis, Insights and Forecast - by Application
- 12.3.1. Oil Refining
- 12.3.2. Chemical Processing
- 12.3.3. Iron & Steel Production
- 12.3.4. Other Applications
- 12.1. Market Analysis, Insights and Forecast - by Source
- 13. Competitive Analysis
- 13.1. Company Profiles
- 13.1.1 McPhy Energy
- 13.1.1.1. Company Overview
- 13.1.1.2. Products
- 13.1.1.3. Company Financials
- 13.1.1.4. SWOT Analysis
- 13.1.2 Engie SA
- 13.1.2.1. Company Overview
- 13.1.2.2. Products
- 13.1.2.3. Company Financials
- 13.1.2.4. SWOT Analysis
- 13.1.3 Taiyo Nippon
- 13.1.3.1. Company Overview
- 13.1.3.2. Products
- 13.1.3.3. Company Financials
- 13.1.3.4. SWOT Analysis
- 13.1.4 Fuel Cell Energy
- 13.1.4.1. Company Overview
- 13.1.4.2. Products
- 13.1.4.3. Company Financials
- 13.1.4.4. SWOT Analysis
- 13.1.5 Air Products & Chemicals
- 13.1.5.1. Company Overview
- 13.1.5.2. Products
- 13.1.5.3. Company Financials
- 13.1.5.4. SWOT Analysis
- 13.1.6 Linde plc
- 13.1.6.1. Company Overview
- 13.1.6.2. Products
- 13.1.6.3. Company Financials
- 13.1.6.4. SWOT Analysis
- 13.1.7 Cummins
- 13.1.7.1. Company Overview
- 13.1.7.2. Products
- 13.1.7.3. Company Financials
- 13.1.7.4. SWOT Analysis
- 13.1.8 Messer Group GmbH
- 13.1.8.1. Company Overview
- 13.1.8.2. Products
- 13.1.8.3. Company Financials
- 13.1.8.4. SWOT Analysis
- 13.1.9 Air Liquide
- 13.1.9.1. Company Overview
- 13.1.9.2. Products
- 13.1.9.3. Company Financials
- 13.1.9.4. SWOT Analysis
- 13.1.10 ITM Power plc
- 13.1.10.1. Company Overview
- 13.1.10.2. Products
- 13.1.10.3. Company Financials
- 13.1.10.4. SWOT Analysis
- 13.1.11 Enapter
- 13.1.11.1. Company Overview
- 13.1.11.2. Products
- 13.1.11.3. Company Financials
- 13.1.11.4. SWOT Analysis
- 13.1.1 McPhy Energy
- 13.2. Market Entropy
- 13.2.1 Company's Key Areas Served
- 13.2.2 Recent Developments
- 13.3. Company Market Share Analysis 2025
- 13.3.1 Top 5 Companies Market Share Analysis
- 13.3.2 Top 3 Companies Market Share Analysis
- 13.4. List of Potential Customers
- 14. Research Methodology
List of Figures
- Figure 1: Global Hydrogen Generation Industry Revenue Breakdown (Million, %) by Region 2025 & 2033
- Figure 2: North America Hydrogen Generation Industry Revenue (Million), by Source 2025 & 2033
- Figure 3: North America Hydrogen Generation Industry Revenue Share (%), by Source 2025 & 2033
- Figure 4: North America Hydrogen Generation Industry Revenue (Million), by Technology 2025 & 2033
- Figure 5: North America Hydrogen Generation Industry Revenue Share (%), by Technology 2025 & 2033
- Figure 6: North America Hydrogen Generation Industry Revenue (Million), by Application 2025 & 2033
- Figure 7: North America Hydrogen Generation Industry Revenue Share (%), by Application 2025 & 2033
- Figure 8: North America Hydrogen Generation Industry Revenue (Million), by Country 2025 & 2033
- Figure 9: North America Hydrogen Generation Industry Revenue Share (%), by Country 2025 & 2033
- Figure 10: Europe Hydrogen Generation Industry Revenue (Million), by Source 2025 & 2033
- Figure 11: Europe Hydrogen Generation Industry Revenue Share (%), by Source 2025 & 2033
- Figure 12: Europe Hydrogen Generation Industry Revenue (Million), by Technology 2025 & 2033
- Figure 13: Europe Hydrogen Generation Industry Revenue Share (%), by Technology 2025 & 2033
- Figure 14: Europe Hydrogen Generation Industry Revenue (Million), by Application 2025 & 2033
- Figure 15: Europe Hydrogen Generation Industry Revenue Share (%), by Application 2025 & 2033
- Figure 16: Europe Hydrogen Generation Industry Revenue (Million), by Country 2025 & 2033
- Figure 17: Europe Hydrogen Generation Industry Revenue Share (%), by Country 2025 & 2033
- Figure 18: Middle East Hydrogen Generation Industry Revenue (Million), by Source 2025 & 2033
- Figure 19: Middle East Hydrogen Generation Industry Revenue Share (%), by Source 2025 & 2033
- Figure 20: Middle East Hydrogen Generation Industry Revenue (Million), by Technology 2025 & 2033
- Figure 21: Middle East Hydrogen Generation Industry Revenue Share (%), by Technology 2025 & 2033
- Figure 22: Middle East Hydrogen Generation Industry Revenue (Million), by Application 2025 & 2033
- Figure 23: Middle East Hydrogen Generation Industry Revenue Share (%), by Application 2025 & 2033
- Figure 24: Middle East Hydrogen Generation Industry Revenue (Million), by Country 2025 & 2033
- Figure 25: Middle East Hydrogen Generation Industry Revenue Share (%), by Country 2025 & 2033
- Figure 26: Saudi Arabia Hydrogen Generation Industry Revenue (Million), by Source 2025 & 2033
- Figure 27: Saudi Arabia Hydrogen Generation Industry Revenue Share (%), by Source 2025 & 2033
- Figure 28: Saudi Arabia Hydrogen Generation Industry Revenue (Million), by Technology 2025 & 2033
- Figure 29: Saudi Arabia Hydrogen Generation Industry Revenue Share (%), by Technology 2025 & 2033
- Figure 30: Saudi Arabia Hydrogen Generation Industry Revenue (Million), by Application 2025 & 2033
- Figure 31: Saudi Arabia Hydrogen Generation Industry Revenue Share (%), by Application 2025 & 2033
- Figure 32: Saudi Arabia Hydrogen Generation Industry Revenue (Million), by Country 2025 & 2033
- Figure 33: Saudi Arabia Hydrogen Generation Industry Revenue Share (%), by Country 2025 & 2033
- Figure 34: Asia Pacific Hydrogen Generation Industry Revenue (Million), by Source 2025 & 2033
- Figure 35: Asia Pacific Hydrogen Generation Industry Revenue Share (%), by Source 2025 & 2033
- Figure 36: Asia Pacific Hydrogen Generation Industry Revenue (Million), by Technology 2025 & 2033
- Figure 37: Asia Pacific Hydrogen Generation Industry Revenue Share (%), by Technology 2025 & 2033
- Figure 38: Asia Pacific Hydrogen Generation Industry Revenue (Million), by Application 2025 & 2033
- Figure 39: Asia Pacific Hydrogen Generation Industry Revenue Share (%), by Application 2025 & 2033
- Figure 40: Asia Pacific Hydrogen Generation Industry Revenue (Million), by Country 2025 & 2033
- Figure 41: Asia Pacific Hydrogen Generation Industry Revenue Share (%), by Country 2025 & 2033
- Figure 42: South America Hydrogen Generation Industry Revenue (Million), by Source 2025 & 2033
- Figure 43: South America Hydrogen Generation Industry Revenue Share (%), by Source 2025 & 2033
- Figure 44: South America Hydrogen Generation Industry Revenue (Million), by Technology 2025 & 2033
- Figure 45: South America Hydrogen Generation Industry Revenue Share (%), by Technology 2025 & 2033
- Figure 46: South America Hydrogen Generation Industry Revenue (Million), by Application 2025 & 2033
- Figure 47: South America Hydrogen Generation Industry Revenue Share (%), by Application 2025 & 2033
- Figure 48: South America Hydrogen Generation Industry Revenue (Million), by Country 2025 & 2033
- Figure 49: South America Hydrogen Generation Industry Revenue Share (%), by Country 2025 & 2033
List of Tables
- Table 1: Global Hydrogen Generation Industry Revenue Million Forecast, by Source 2020 & 2033
- Table 2: Global Hydrogen Generation Industry Revenue Million Forecast, by Technology 2020 & 2033
- Table 3: Global Hydrogen Generation Industry Revenue Million Forecast, by Application 2020 & 2033
- Table 4: Global Hydrogen Generation Industry Revenue Million Forecast, by Region 2020 & 2033
- Table 5: Global Hydrogen Generation Industry Revenue Million Forecast, by Source 2020 & 2033
- Table 6: Global Hydrogen Generation Industry Revenue Million Forecast, by Technology 2020 & 2033
- Table 7: Global Hydrogen Generation Industry Revenue Million Forecast, by Application 2020 & 2033
- Table 8: Global Hydrogen Generation Industry Revenue Million Forecast, by Country 2020 & 2033
- Table 9: United States Hydrogen Generation Industry Revenue (Million) Forecast, by Application 2020 & 2033
- Table 10: Canada Hydrogen Generation Industry Revenue (Million) Forecast, by Application 2020 & 2033
- Table 11: Rest of North America Hydrogen Generation Industry Revenue (Million) Forecast, by Application 2020 & 2033
- Table 12: Global Hydrogen Generation Industry Revenue Million Forecast, by Source 2020 & 2033
- Table 13: Global Hydrogen Generation Industry Revenue Million Forecast, by Technology 2020 & 2033
- Table 14: Global Hydrogen Generation Industry Revenue Million Forecast, by Application 2020 & 2033
- Table 15: Global Hydrogen Generation Industry Revenue Million Forecast, by Country 2020 & 2033
- Table 16: Germany Hydrogen Generation Industry Revenue (Million) Forecast, by Application 2020 & 2033
- Table 17: France Hydrogen Generation Industry Revenue (Million) Forecast, by Application 2020 & 2033
- Table 18: Italy Hydrogen Generation Industry Revenue (Million) Forecast, by Application 2020 & 2033
- Table 19: United Kingdom Hydrogen Generation Industry Revenue (Million) Forecast, by Application 2020 & 2033
- Table 20: Russian Federation Hydrogen Generation Industry Revenue (Million) Forecast, by Application 2020 & 2033
- Table 21: Rest of Europe Hydrogen Generation Industry Revenue (Million) Forecast, by Application 2020 & 2033
- Table 22: Global Hydrogen Generation Industry Revenue Million Forecast, by Source 2020 & 2033
- Table 23: Global Hydrogen Generation Industry Revenue Million Forecast, by Technology 2020 & 2033
- Table 24: Global Hydrogen Generation Industry Revenue Million Forecast, by Application 2020 & 2033
- Table 25: Global Hydrogen Generation Industry Revenue Million Forecast, by Country 2020 & 2033
- Table 26: Global Hydrogen Generation Industry Revenue Million Forecast, by Source 2020 & 2033
- Table 27: Global Hydrogen Generation Industry Revenue Million Forecast, by Technology 2020 & 2033
- Table 28: Global Hydrogen Generation Industry Revenue Million Forecast, by Application 2020 & 2033
- Table 29: Global Hydrogen Generation Industry Revenue Million Forecast, by Country 2020 & 2033
- Table 30: United Arab Emirates Hydrogen Generation Industry Revenue (Million) Forecast, by Application 2020 & 2033
- Table 31: South Africa Hydrogen Generation Industry Revenue (Million) Forecast, by Application 2020 & 2033
- Table 32: Rest of Middle East and Africa Hydrogen Generation Industry Revenue (Million) Forecast, by Application 2020 & 2033
- Table 33: Global Hydrogen Generation Industry Revenue Million Forecast, by Source 2020 & 2033
- Table 34: Global Hydrogen Generation Industry Revenue Million Forecast, by Technology 2020 & 2033
- Table 35: Global Hydrogen Generation Industry Revenue Million Forecast, by Application 2020 & 2033
- Table 36: Global Hydrogen Generation Industry Revenue Million Forecast, by Country 2020 & 2033
- Table 37: China Hydrogen Generation Industry Revenue (Million) Forecast, by Application 2020 & 2033
- Table 38: India Hydrogen Generation Industry Revenue (Million) Forecast, by Application 2020 & 2033
- Table 39: Japan Hydrogen Generation Industry Revenue (Million) Forecast, by Application 2020 & 2033
- Table 40: South Korea Hydrogen Generation Industry Revenue (Million) Forecast, by Application 2020 & 2033
- Table 41: Rest of Asia Pacific Hydrogen Generation Industry Revenue (Million) Forecast, by Application 2020 & 2033
- Table 42: Global Hydrogen Generation Industry Revenue Million Forecast, by Source 2020 & 2033
- Table 43: Global Hydrogen Generation Industry Revenue Million Forecast, by Technology 2020 & 2033
- Table 44: Global Hydrogen Generation Industry Revenue Million Forecast, by Application 2020 & 2033
- Table 45: Global Hydrogen Generation Industry Revenue Million Forecast, by Country 2020 & 2033
- Table 46: Brazil Hydrogen Generation Industry Revenue (Million) Forecast, by Application 2020 & 2033
- Table 47: Argentina Hydrogen Generation Industry Revenue (Million) Forecast, by Application 2020 & 2033
- Table 48: Rest of South America Hydrogen Generation Industry Revenue (Million) Forecast, by Application 2020 & 2033
Frequently Asked Questions
1. What is the projected Compound Annual Growth Rate (CAGR) of the Hydrogen Generation Industry?
The projected CAGR is approximately 4.23%.
2. Which companies are prominent players in the Hydrogen Generation Industry?
Key companies in the market include McPhy Energy, Engie SA, Taiyo Nippon, Fuel Cell Energy, Air Products & Chemicals, Linde plc, Cummins, Messer Group GmbH, Air Liquide, ITM Power plc, Enapter.
3. What are the main segments of the Hydrogen Generation Industry?
The market segments include Source, Technology, Application.
4. Can you provide details about the market size?
The market size is estimated to be USD 184.74 Million as of 2022.
5. What are some drivers contributing to market growth?
4.; Favorable Government Policies4.; Increasing Demand From Refinery and Industrial Sector.
6. What are the notable trends driving market growth?
Oil Refining Segment Expected to Dominate the Market.
7. Are there any restraints impacting market growth?
4.; Higher Production Cost.
8. Can you provide examples of recent developments in the market?
October 2023: H2B2, a technology company with a portfolio in Hydrogen production systems, unveiled the green hydrogen plant, which is expected to become operational in North America, the SoHyCal facility located in Fresno, California, United States. The project envisages 100 percent clean hydrogen production using PEM technology.
9. What pricing options are available for accessing the report?
Pricing options include single-user, multi-user, and enterprise licenses priced at USD 4750, USD 5250, and USD 8750 respectively.
10. Is the market size provided in terms of value or volume?
The market size is provided in terms of value, measured in Million.
11. Are there any specific market keywords associated with the report?
Yes, the market keyword associated with the report is "Hydrogen Generation Industry," which aids in identifying and referencing the specific market segment covered.
12. How do I determine which pricing option suits my needs best?
The pricing options vary based on user requirements and access needs. Individual users may opt for single-user licenses, while businesses requiring broader access may choose multi-user or enterprise licenses for cost-effective access to the report.
13. Are there any additional resources or data provided in the Hydrogen Generation Industry report?
While the report offers comprehensive insights, it's advisable to review the specific contents or supplementary materials provided to ascertain if additional resources or data are available.
14. How can I stay updated on further developments or reports in the Hydrogen Generation Industry?
To stay informed about further developments, trends, and reports in the Hydrogen Generation Industry, consider subscribing to industry newsletters, following relevant companies and organizations, or regularly checking reputable industry news sources and publications.
Methodology
Step 1 - Identification of Relevant Samples Size from Population Database


Step 2 - Approaches for Defining Global Market Size (Value, Volume* & Price*)

Note*: In applicable scenarios
Step 3 - Data Sources
Primary Research
- Web Analytics
- Survey Reports
- Research Institute
- Latest Research Reports
- Opinion Leaders
Secondary Research
- Annual Reports
- White Paper
- Latest Press Release
- Industry Association
- Paid Database
- Investor Presentations

Step 4 - Data Triangulation
Involves using different sources of information in order to increase the validity of a study
These sources are likely to be stakeholders in a program - participants, other researchers, program staff, other community members, and so on.
Then we put all data in single framework & apply various statistical tools to find out the dynamic on the market.
During the analysis stage, feedback from the stakeholder groups would be compared to determine areas of agreement as well as areas of divergence