

Key Insights
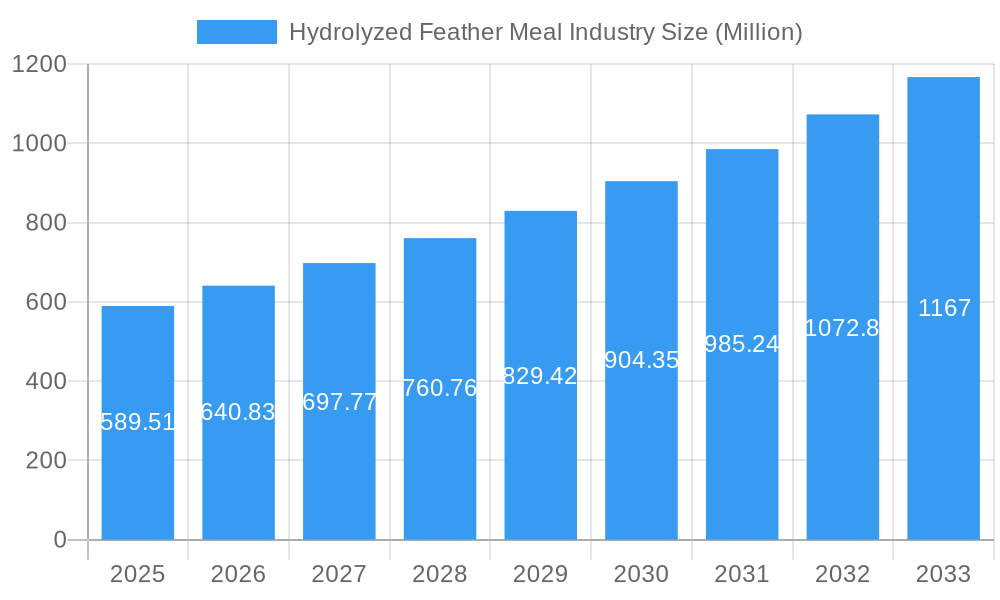
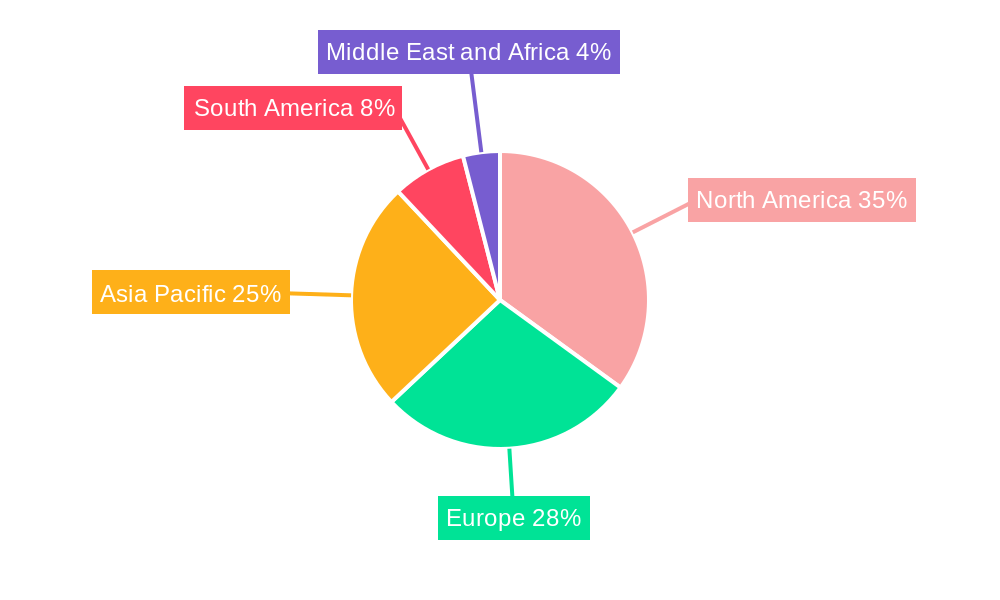
The hydrolyzed feather meal market, valued at $589.51 million in 2025, is projected to experience robust growth, driven by increasing demand for sustainable and cost-effective protein sources in animal feed. The rising global population and the consequential surge in meat consumption are key factors fueling this demand. Furthermore, the stringent regulations surrounding the disposal of poultry waste are incentivizing the adoption of hydrolyzed feather meal as a valuable byproduct. Organic farming practices, focused on reducing reliance on synthetic fertilizers and promoting environmentally friendly alternatives, are further bolstering market expansion. The market is segmented by type (conventional and organic) and application (animal feed, agrochemicals, and other applications), with animal feed currently dominating due to its high protein content and digestibility. Key players like Darling Ingredients and Valley Proteins are actively contributing to market growth through strategic partnerships and investments in advanced processing technologies. Geographical analysis reveals that North America and Europe currently hold significant market share, but the Asia-Pacific region presents substantial growth potential due to its expanding poultry industry and increasing awareness of sustainable agricultural practices. The market's growth trajectory is expected to continue over the forecast period (2025-2033), with a Compound Annual Growth Rate (CAGR) of 8.60%, indicating a promising future for this industry.
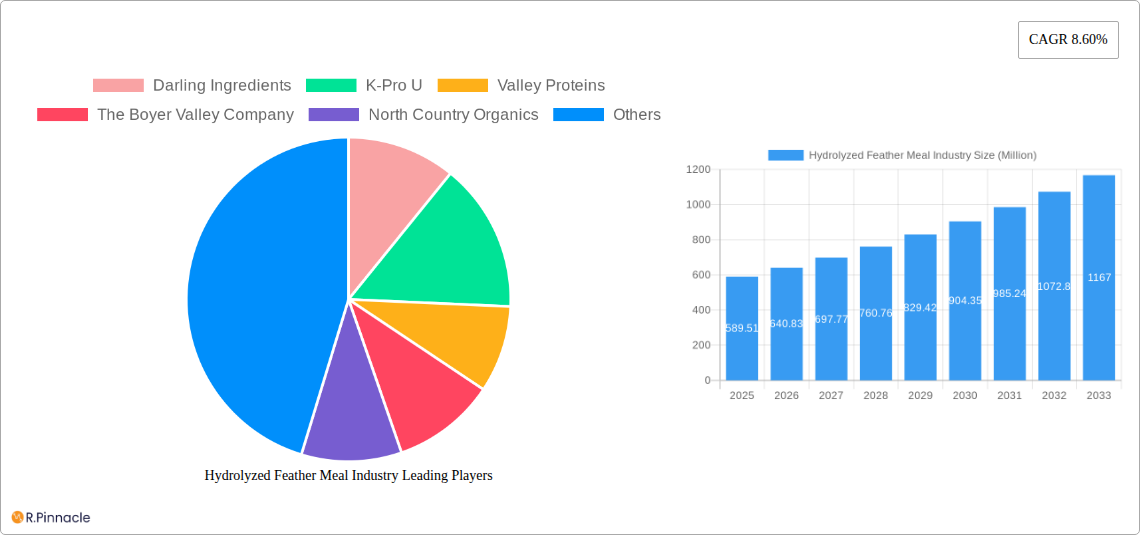
Hydrolyzed Feather Meal Industry Market Size (In Million)
The competitive landscape is characterized by both established players and emerging companies. Companies are focusing on product innovation, such as enhancing the digestibility and palatability of hydrolyzed feather meal, to expand their market share. Furthermore, mergers and acquisitions are likely to shape the market dynamics in the coming years. Challenges remain, however, including potential variations in the quality of the raw material and the need for consistent regulatory frameworks to ensure safe and sustainable production practices. Despite these challenges, the overall outlook for the hydrolyzed feather meal market remains positive, driven by growing environmental concerns, the increasing demand for protein sources, and continuous advancements in processing technologies. Further research into optimizing the nutritional value and exploring new applications beyond animal feed could unlock even greater market potential.
Hydrolyzed Feather Meal Industry Company Market Share
Hydrolyzed Feather Meal Industry: A Comprehensive Market Report (2019-2033)
This comprehensive report provides a detailed analysis of the Hydrolyzed Feather Meal industry, offering invaluable insights for industry professionals, investors, and researchers. Covering the period from 2019 to 2033, with a focus on 2025, this report delves into market dynamics, competitive landscapes, and future growth projections. The global market size is estimated to reach xx Million by 2025 and is projected to grow at a CAGR of xx% during the forecast period (2025-2033).
Hydrolyzed Feather Meal Industry Market Structure & Innovation Trends
This section analyzes the market concentration, innovation drivers, and regulatory landscape of the hydrolyzed feather meal industry. We examine the competitive dynamics, including mergers and acquisitions (M&A) activities, impacting market share distribution among key players. The global market is moderately consolidated, with several major players holding significant market share. Darling Ingredients, Valley Proteins, and K-Pro U are among the leading companies, collectively accounting for an estimated xx% of the global market in 2025. Recent M&A activities have been relatively modest, with deal values in the xx Million range over the past few years.
- Market Concentration: Moderately consolidated, with a few dominant players.
- Innovation Drivers: Sustainability concerns, increasing demand for animal feed, and advancements in processing technologies.
- Regulatory Frameworks: Varying regulations across different regions impact production and usage.
- Product Substitutes: Other protein sources, synthetic amino acids.
- End-User Demographics: Primarily focused on animal feed manufacturers and agricultural businesses.
- M&A Activities: Relatively low frequency in recent years, with deal values totaling xx Million over the past five years.
Hydrolyzed Feather Meal Industry Market Dynamics & Trends
The hydrolyzed feather meal market is experiencing significant growth driven by the rising demand for sustainable and cost-effective protein sources in animal feed. Technological advancements in hydrolysis processes are improving the quality and efficiency of feather meal production. Consumer preferences for environmentally friendly products are boosting the demand for organic hydrolyzed feather meal. The competitive landscape is characterized by both established players and emerging companies focusing on innovation and market penetration. The market is segmented by type (conventional and organic) and application (animal feed, agrochemicals, other). The global market is experiencing a high growth rate driven by these trends. The CAGR for the forecast period (2025-2033) is projected at xx%. Market penetration is expected to increase significantly, particularly in developing regions with large poultry industries.
Dominant Regions & Segments in Hydrolyzed Feather Meal Industry
The North American region currently dominates the hydrolyzed feather meal market, driven by factors such as a large poultry industry and established infrastructure for processing agricultural by-products. Within this region, the United States holds the largest market share.
Key Drivers for North American Dominance:
- Large poultry processing industry
- Well-established waste management infrastructure
- Strong regulatory framework encouraging sustainable practices
- High demand for animal feed
Segment Analysis:
- Animal Feed: This remains the dominant application, accounting for approximately xx% of the total market.
- Conventional Hydrolyzed Feather Meal: Holds a larger market share than organic due to lower production costs.
- Organic Hydrolyzed Feather Meal: Experiencing rapid growth fueled by increasing consumer demand for organic products. This segment is expected to reach xx Million by 2033.
Hydrolyzed Feather Meal Industry Product Innovations
Recent innovations in hydrolyzed feather meal production focus on improving efficiency, reducing environmental impact, and enhancing the nutritional quality of the product. Advancements in hydrolysis technologies are producing higher-quality feather meal with improved digestibility and amino acid profiles. These innovations are driving market expansion by meeting the growing demand for sustainable and high-quality protein sources in animal feed.
Report Scope & Segmentation Analysis
This report segments the hydrolyzed feather meal market by type (conventional and organic) and application (animal feed, agrochemicals, and other applications). The animal feed segment is projected to grow at a CAGR of xx% from 2025 to 2033, driven by the increasing demand for cost-effective protein sources. The organic segment is also experiencing significant growth, driven by consumer preference for sustainable and environmentally friendly products. Competitive dynamics within each segment vary, with established players facing competition from new entrants.
- Conventional: Projected to reach xx Million by 2033.
- Organic: Projected to reach xx Million by 2033.
- Animal Feed: Projected to reach xx Million by 2033.
- Agrochemicals: Projected to reach xx Million by 2033.
- Other Applications: Projected to reach xx Million by 2033.
Key Drivers of Hydrolyzed Feather Meal Industry Growth
Several key factors are driving the growth of the hydrolyzed feather meal industry:
- Increasing demand for sustainable protein sources: Growing environmental concerns are promoting the utilization of byproducts.
- Technological advancements in hydrolysis processes: Improving the efficiency and quality of the product.
- Favorable regulatory environment: Supporting the development and adoption of sustainable feed ingredients.
- Cost-effectiveness: Hydrolyzed feather meal offers a competitive price point compared to other protein sources.
Challenges in the Hydrolyzed Feather Meal Industry Sector
Despite the significant growth opportunities, the hydrolyzed feather meal industry faces several challenges:
- Fluctuations in raw material supply: Dependent on the availability of poultry feathers.
- Stringent regulatory requirements: Varying regulations across different regions impact production costs and market access.
- Competition from alternative protein sources: Synthetic amino acids and other protein-rich feed ingredients.
- Maintaining consistent product quality: Requires advanced technology and strict quality control measures.
Emerging Opportunities in Hydrolyzed Feather Meal Industry
Several emerging opportunities exist in the hydrolyzed feather meal industry:
- Expansion into new geographic markets: Untapped potential in developing countries with large poultry populations.
- Development of value-added products: Formulation of specialized blends tailored to specific animal feed applications.
- Growing demand for organic feather meal: Meeting the rising demand for sustainable and environmentally friendly feed solutions.
- Exploring new applications: Research and development into utilization in other sectors beyond animal feed.
Leading Players in the Hydrolyzed Feather Meal Industry Market
- Darling Ingredients
- K-Pro U
- Valley Proteins
- The Boyer Valley Company
- North Country Organics
- JG Pears
- Kleingarn Agrarprodukte
- FASA Group
Key Developments in Hydrolyzed Feather Meal Industry Industry
- September 2021: Indian scientists developed a new hydrodynamic sustainable, affordable technique to turn poultry feathers & animal hair into fertilizer. This development enhances the potential for wider adoption of feather meal in various applications.
- August 2022: The University of Danang - University of Science and Technology successfully produced a bio-organic fertilizer from chicken feathers. This highlights the growing focus on environmentally friendly applications of feather meal.
Future Outlook for Hydrolyzed Feather Meal Industry Market
The future of the hydrolyzed feather meal market appears promising. Continued innovation in processing technologies, coupled with increasing demand for sustainable and cost-effective protein sources, will drive market expansion. Strategic partnerships, mergers and acquisitions, and expansion into new markets will be crucial for success in this evolving landscape. The industry is poised for significant growth, fueled by both technological advancements and environmental concerns.
Hydrolyzed Feather Meal Industry Segmentation
- 1. Production Analysis
- 2. Consumption Analysis
- 3. Import Market Analysis (Value & Volume)
- 4. Export Market Analysis (Value & Volume)
- 5. Price Trend Analysis
Hydrolyzed Feather Meal Industry Segmentation By Geography
-
1. North America
- 1.1. United States
- 1.2. Canada
- 1.3. Mexico
-
2. South America
- 2.1. Brazil
- 2.2. Argentina
- 2.3. Rest of South America
-
3. Europe
- 3.1. United Kingdom
- 3.2. Germany
- 3.3. France
- 3.4. Italy
- 3.5. Spain
- 3.6. Russia
- 3.7. Benelux
- 3.8. Nordics
- 3.9. Rest of Europe
-
4. Middle East & Africa
- 4.1. Turkey
- 4.2. Israel
- 4.3. GCC
- 4.4. North Africa
- 4.5. South Africa
- 4.6. Rest of Middle East & Africa
-
5. Asia Pacific
- 5.1. China
- 5.2. India
- 5.3. Japan
- 5.4. South Korea
- 5.5. ASEAN
- 5.6. Oceania
- 5.7. Rest of Asia Pacific
Hydrolyzed Feather Meal Industry Regional Market Share
Geographic Coverage of Hydrolyzed Feather Meal Industry
Hydrolyzed Feather Meal Industry REPORT HIGHLIGHTS
| Aspects | Details |
|---|---|
| Study Period | 2020-2034 |
| Base Year | 2025 |
| Estimated Year | 2026 |
| Forecast Period | 2026-2034 |
| Historical Period | 2020-2025 |
| Growth Rate | CAGR of 8.60% from 2020-2034 |
| Segmentation |
|
Table of Contents
- 1. Introduction
- 1.1. Research Scope
- 1.2. Market Segmentation
- 1.3. Research Objective
- 1.4. Definitions and Assumptions
- 2. Executive Summary
- 2.1. Market Snapshot
- 3. Market Dynamics
- 3.1. Market Drivers
- 3.2. Market Restrains
- 3.3. Market Trends
- 3.4. Market Opportunities
- 4. Market Factor Analysis
- 4.1. Porters Five Forces
- 4.1.1. Bargaining Power of Suppliers
- 4.1.2. Bargaining Power of Buyers
- 4.1.3. Threat of New Entrants
- 4.1.4. Threat of Substitutes
- 4.1.5. Competitive Rivalry
- 4.2. PESTEL analysis
- 4.3. BCG Analysis
- 4.3.1. Stars (High Growth, High Market Share)
- 4.3.2. Cash Cows (Low Growth, High Market Share)
- 4.3.3. Question Mark (High Growth, Low Market Share)
- 4.3.4. Dogs (Low Growth, Low Market Share)
- 4.4. Ansoff Matrix Analysis
- 4.5. Supply Chain Analysis
- 4.6. Regulatory Landscape
- 4.7. Current Market Potential and Opportunity Assessment (TAM–SAM–SOM Framework)
- 4.8. PRI Analyst Note
- 4.1. Porters Five Forces
- 5. Market Analysis, Insights and Forecast 2021-2033
- 5.1. Market Analysis, Insights and Forecast - by Production Analysis
- 5.2. Market Analysis, Insights and Forecast - by Consumption Analysis
- 5.3. Market Analysis, Insights and Forecast - by Import Market Analysis (Value & Volume)
- 5.4. Market Analysis, Insights and Forecast - by Export Market Analysis (Value & Volume)
- 5.5. Market Analysis, Insights and Forecast - by Price Trend Analysis
- 5.6. Market Analysis, Insights and Forecast - by Region
- 5.6.1. North America
- 5.6.2. South America
- 5.6.3. Europe
- 5.6.4. Middle East & Africa
- 5.6.5. Asia Pacific
- 6. Global Hydrolyzed Feather Meal Industry Analysis, Insights and Forecast, 2021-2033
- 6.1. Market Analysis, Insights and Forecast - by Production Analysis
- 6.2. Market Analysis, Insights and Forecast - by Consumption Analysis
- 6.3. Market Analysis, Insights and Forecast - by Import Market Analysis (Value & Volume)
- 6.4. Market Analysis, Insights and Forecast - by Export Market Analysis (Value & Volume)
- 6.5. Market Analysis, Insights and Forecast - by Price Trend Analysis
- 7. North America Hydrolyzed Feather Meal Industry Analysis, Insights and Forecast, 2020-2032
- 7.1. Market Analysis, Insights and Forecast - by Production Analysis
- 7.2. Market Analysis, Insights and Forecast - by Consumption Analysis
- 7.3. Market Analysis, Insights and Forecast - by Import Market Analysis (Value & Volume)
- 7.4. Market Analysis, Insights and Forecast - by Export Market Analysis (Value & Volume)
- 7.5. Market Analysis, Insights and Forecast - by Price Trend Analysis
- 8. South America Hydrolyzed Feather Meal Industry Analysis, Insights and Forecast, 2020-2032
- 8.1. Market Analysis, Insights and Forecast - by Production Analysis
- 8.2. Market Analysis, Insights and Forecast - by Consumption Analysis
- 8.3. Market Analysis, Insights and Forecast - by Import Market Analysis (Value & Volume)
- 8.4. Market Analysis, Insights and Forecast - by Export Market Analysis (Value & Volume)
- 8.5. Market Analysis, Insights and Forecast - by Price Trend Analysis
- 9. Europe Hydrolyzed Feather Meal Industry Analysis, Insights and Forecast, 2020-2032
- 9.1. Market Analysis, Insights and Forecast - by Production Analysis
- 9.2. Market Analysis, Insights and Forecast - by Consumption Analysis
- 9.3. Market Analysis, Insights and Forecast - by Import Market Analysis (Value & Volume)
- 9.4. Market Analysis, Insights and Forecast - by Export Market Analysis (Value & Volume)
- 9.5. Market Analysis, Insights and Forecast - by Price Trend Analysis
- 10. Middle East & Africa Hydrolyzed Feather Meal Industry Analysis, Insights and Forecast, 2020-2032
- 10.1. Market Analysis, Insights and Forecast - by Production Analysis
- 10.2. Market Analysis, Insights and Forecast - by Consumption Analysis
- 10.3. Market Analysis, Insights and Forecast - by Import Market Analysis (Value & Volume)
- 10.4. Market Analysis, Insights and Forecast - by Export Market Analysis (Value & Volume)
- 10.5. Market Analysis, Insights and Forecast - by Price Trend Analysis
- 11. Asia Pacific Hydrolyzed Feather Meal Industry Analysis, Insights and Forecast, 2020-2032
- 11.1. Market Analysis, Insights and Forecast - by Production Analysis
- 11.2. Market Analysis, Insights and Forecast - by Consumption Analysis
- 11.3. Market Analysis, Insights and Forecast - by Import Market Analysis (Value & Volume)
- 11.4. Market Analysis, Insights and Forecast - by Export Market Analysis (Value & Volume)
- 11.5. Market Analysis, Insights and Forecast - by Price Trend Analysis
- 12. Competitive Analysis
- 12.1. Company Profiles
- 12.1.1 Darling Ingredients
- 12.1.1.1. Company Overview
- 12.1.1.2. Products
- 12.1.1.3. Company Financials
- 12.1.1.4. SWOT Analysis
- 12.1.2 K-Pro U
- 12.1.2.1. Company Overview
- 12.1.2.2. Products
- 12.1.2.3. Company Financials
- 12.1.2.4. SWOT Analysis
- 12.1.3 Valley Proteins
- 12.1.3.1. Company Overview
- 12.1.3.2. Products
- 12.1.3.3. Company Financials
- 12.1.3.4. SWOT Analysis
- 12.1.4 The Boyer Valley Company
- 12.1.4.1. Company Overview
- 12.1.4.2. Products
- 12.1.4.3. Company Financials
- 12.1.4.4. SWOT Analysis
- 12.1.5 North Country Organics
- 12.1.5.1. Company Overview
- 12.1.5.2. Products
- 12.1.5.3. Company Financials
- 12.1.5.4. SWOT Analysis
- 12.1.6 JG Pears
- 12.1.6.1. Company Overview
- 12.1.6.2. Products
- 12.1.6.3. Company Financials
- 12.1.6.4. SWOT Analysis
- 12.1.7 Kleingarn Agrarprodukte
- 12.1.7.1. Company Overview
- 12.1.7.2. Products
- 12.1.7.3. Company Financials
- 12.1.7.4. SWOT Analysis
- 12.1.8 FASA Group
- 12.1.8.1. Company Overview
- 12.1.8.2. Products
- 12.1.8.3. Company Financials
- 12.1.8.4. SWOT Analysis
- 12.1.1 Darling Ingredients
- 12.2. Market Entropy
- 12.2.1 Company's Key Areas Served
- 12.2.2 Recent Developments
- 12.3. Company Market Share Analysis 2025
- 12.3.1 Top 5 Companies Market Share Analysis
- 12.3.2 Top 3 Companies Market Share Analysis
- 12.4. List of Potential Customers
- 13. Research Methodology
List of Figures
- Figure 1: Global Hydrolyzed Feather Meal Industry Revenue Breakdown (Million, %) by Region 2025 & 2033
- Figure 2: North America Hydrolyzed Feather Meal Industry Revenue (Million), by Production Analysis 2025 & 2033
- Figure 3: North America Hydrolyzed Feather Meal Industry Revenue Share (%), by Production Analysis 2025 & 2033
- Figure 4: North America Hydrolyzed Feather Meal Industry Revenue (Million), by Consumption Analysis 2025 & 2033
- Figure 5: North America Hydrolyzed Feather Meal Industry Revenue Share (%), by Consumption Analysis 2025 & 2033
- Figure 6: North America Hydrolyzed Feather Meal Industry Revenue (Million), by Import Market Analysis (Value & Volume) 2025 & 2033
- Figure 7: North America Hydrolyzed Feather Meal Industry Revenue Share (%), by Import Market Analysis (Value & Volume) 2025 & 2033
- Figure 8: North America Hydrolyzed Feather Meal Industry Revenue (Million), by Export Market Analysis (Value & Volume) 2025 & 2033
- Figure 9: North America Hydrolyzed Feather Meal Industry Revenue Share (%), by Export Market Analysis (Value & Volume) 2025 & 2033
- Figure 10: North America Hydrolyzed Feather Meal Industry Revenue (Million), by Price Trend Analysis 2025 & 2033
- Figure 11: North America Hydrolyzed Feather Meal Industry Revenue Share (%), by Price Trend Analysis 2025 & 2033
- Figure 12: North America Hydrolyzed Feather Meal Industry Revenue (Million), by Country 2025 & 2033
- Figure 13: North America Hydrolyzed Feather Meal Industry Revenue Share (%), by Country 2025 & 2033
- Figure 14: South America Hydrolyzed Feather Meal Industry Revenue (Million), by Production Analysis 2025 & 2033
- Figure 15: South America Hydrolyzed Feather Meal Industry Revenue Share (%), by Production Analysis 2025 & 2033
- Figure 16: South America Hydrolyzed Feather Meal Industry Revenue (Million), by Consumption Analysis 2025 & 2033
- Figure 17: South America Hydrolyzed Feather Meal Industry Revenue Share (%), by Consumption Analysis 2025 & 2033
- Figure 18: South America Hydrolyzed Feather Meal Industry Revenue (Million), by Import Market Analysis (Value & Volume) 2025 & 2033
- Figure 19: South America Hydrolyzed Feather Meal Industry Revenue Share (%), by Import Market Analysis (Value & Volume) 2025 & 2033
- Figure 20: South America Hydrolyzed Feather Meal Industry Revenue (Million), by Export Market Analysis (Value & Volume) 2025 & 2033
- Figure 21: South America Hydrolyzed Feather Meal Industry Revenue Share (%), by Export Market Analysis (Value & Volume) 2025 & 2033
- Figure 22: South America Hydrolyzed Feather Meal Industry Revenue (Million), by Price Trend Analysis 2025 & 2033
- Figure 23: South America Hydrolyzed Feather Meal Industry Revenue Share (%), by Price Trend Analysis 2025 & 2033
- Figure 24: South America Hydrolyzed Feather Meal Industry Revenue (Million), by Country 2025 & 2033
- Figure 25: South America Hydrolyzed Feather Meal Industry Revenue Share (%), by Country 2025 & 2033
- Figure 26: Europe Hydrolyzed Feather Meal Industry Revenue (Million), by Production Analysis 2025 & 2033
- Figure 27: Europe Hydrolyzed Feather Meal Industry Revenue Share (%), by Production Analysis 2025 & 2033
- Figure 28: Europe Hydrolyzed Feather Meal Industry Revenue (Million), by Consumption Analysis 2025 & 2033
- Figure 29: Europe Hydrolyzed Feather Meal Industry Revenue Share (%), by Consumption Analysis 2025 & 2033
- Figure 30: Europe Hydrolyzed Feather Meal Industry Revenue (Million), by Import Market Analysis (Value & Volume) 2025 & 2033
- Figure 31: Europe Hydrolyzed Feather Meal Industry Revenue Share (%), by Import Market Analysis (Value & Volume) 2025 & 2033
- Figure 32: Europe Hydrolyzed Feather Meal Industry Revenue (Million), by Export Market Analysis (Value & Volume) 2025 & 2033
- Figure 33: Europe Hydrolyzed Feather Meal Industry Revenue Share (%), by Export Market Analysis (Value & Volume) 2025 & 2033
- Figure 34: Europe Hydrolyzed Feather Meal Industry Revenue (Million), by Price Trend Analysis 2025 & 2033
- Figure 35: Europe Hydrolyzed Feather Meal Industry Revenue Share (%), by Price Trend Analysis 2025 & 2033
- Figure 36: Europe Hydrolyzed Feather Meal Industry Revenue (Million), by Country 2025 & 2033
- Figure 37: Europe Hydrolyzed Feather Meal Industry Revenue Share (%), by Country 2025 & 2033
- Figure 38: Middle East & Africa Hydrolyzed Feather Meal Industry Revenue (Million), by Production Analysis 2025 & 2033
- Figure 39: Middle East & Africa Hydrolyzed Feather Meal Industry Revenue Share (%), by Production Analysis 2025 & 2033
- Figure 40: Middle East & Africa Hydrolyzed Feather Meal Industry Revenue (Million), by Consumption Analysis 2025 & 2033
- Figure 41: Middle East & Africa Hydrolyzed Feather Meal Industry Revenue Share (%), by Consumption Analysis 2025 & 2033
- Figure 42: Middle East & Africa Hydrolyzed Feather Meal Industry Revenue (Million), by Import Market Analysis (Value & Volume) 2025 & 2033
- Figure 43: Middle East & Africa Hydrolyzed Feather Meal Industry Revenue Share (%), by Import Market Analysis (Value & Volume) 2025 & 2033
- Figure 44: Middle East & Africa Hydrolyzed Feather Meal Industry Revenue (Million), by Export Market Analysis (Value & Volume) 2025 & 2033
- Figure 45: Middle East & Africa Hydrolyzed Feather Meal Industry Revenue Share (%), by Export Market Analysis (Value & Volume) 2025 & 2033
- Figure 46: Middle East & Africa Hydrolyzed Feather Meal Industry Revenue (Million), by Price Trend Analysis 2025 & 2033
- Figure 47: Middle East & Africa Hydrolyzed Feather Meal Industry Revenue Share (%), by Price Trend Analysis 2025 & 2033
- Figure 48: Middle East & Africa Hydrolyzed Feather Meal Industry Revenue (Million), by Country 2025 & 2033
- Figure 49: Middle East & Africa Hydrolyzed Feather Meal Industry Revenue Share (%), by Country 2025 & 2033
- Figure 50: Asia Pacific Hydrolyzed Feather Meal Industry Revenue (Million), by Production Analysis 2025 & 2033
- Figure 51: Asia Pacific Hydrolyzed Feather Meal Industry Revenue Share (%), by Production Analysis 2025 & 2033
- Figure 52: Asia Pacific Hydrolyzed Feather Meal Industry Revenue (Million), by Consumption Analysis 2025 & 2033
- Figure 53: Asia Pacific Hydrolyzed Feather Meal Industry Revenue Share (%), by Consumption Analysis 2025 & 2033
- Figure 54: Asia Pacific Hydrolyzed Feather Meal Industry Revenue (Million), by Import Market Analysis (Value & Volume) 2025 & 2033
- Figure 55: Asia Pacific Hydrolyzed Feather Meal Industry Revenue Share (%), by Import Market Analysis (Value & Volume) 2025 & 2033
- Figure 56: Asia Pacific Hydrolyzed Feather Meal Industry Revenue (Million), by Export Market Analysis (Value & Volume) 2025 & 2033
- Figure 57: Asia Pacific Hydrolyzed Feather Meal Industry Revenue Share (%), by Export Market Analysis (Value & Volume) 2025 & 2033
- Figure 58: Asia Pacific Hydrolyzed Feather Meal Industry Revenue (Million), by Price Trend Analysis 2025 & 2033
- Figure 59: Asia Pacific Hydrolyzed Feather Meal Industry Revenue Share (%), by Price Trend Analysis 2025 & 2033
- Figure 60: Asia Pacific Hydrolyzed Feather Meal Industry Revenue (Million), by Country 2025 & 2033
- Figure 61: Asia Pacific Hydrolyzed Feather Meal Industry Revenue Share (%), by Country 2025 & 2033
List of Tables
- Table 1: Global Hydrolyzed Feather Meal Industry Revenue Million Forecast, by Production Analysis 2020 & 2033
- Table 2: Global Hydrolyzed Feather Meal Industry Revenue Million Forecast, by Consumption Analysis 2020 & 2033
- Table 3: Global Hydrolyzed Feather Meal Industry Revenue Million Forecast, by Import Market Analysis (Value & Volume) 2020 & 2033
- Table 4: Global Hydrolyzed Feather Meal Industry Revenue Million Forecast, by Export Market Analysis (Value & Volume) 2020 & 2033
- Table 5: Global Hydrolyzed Feather Meal Industry Revenue Million Forecast, by Price Trend Analysis 2020 & 2033
- Table 6: Global Hydrolyzed Feather Meal Industry Revenue Million Forecast, by Region 2020 & 2033
- Table 7: Global Hydrolyzed Feather Meal Industry Revenue Million Forecast, by Production Analysis 2020 & 2033
- Table 8: Global Hydrolyzed Feather Meal Industry Revenue Million Forecast, by Consumption Analysis 2020 & 2033
- Table 9: Global Hydrolyzed Feather Meal Industry Revenue Million Forecast, by Import Market Analysis (Value & Volume) 2020 & 2033
- Table 10: Global Hydrolyzed Feather Meal Industry Revenue Million Forecast, by Export Market Analysis (Value & Volume) 2020 & 2033
- Table 11: Global Hydrolyzed Feather Meal Industry Revenue Million Forecast, by Price Trend Analysis 2020 & 2033
- Table 12: Global Hydrolyzed Feather Meal Industry Revenue Million Forecast, by Country 2020 & 2033
- Table 13: United States Hydrolyzed Feather Meal Industry Revenue (Million) Forecast, by Application 2020 & 2033
- Table 14: Canada Hydrolyzed Feather Meal Industry Revenue (Million) Forecast, by Application 2020 & 2033
- Table 15: Mexico Hydrolyzed Feather Meal Industry Revenue (Million) Forecast, by Application 2020 & 2033
- Table 16: Global Hydrolyzed Feather Meal Industry Revenue Million Forecast, by Production Analysis 2020 & 2033
- Table 17: Global Hydrolyzed Feather Meal Industry Revenue Million Forecast, by Consumption Analysis 2020 & 2033
- Table 18: Global Hydrolyzed Feather Meal Industry Revenue Million Forecast, by Import Market Analysis (Value & Volume) 2020 & 2033
- Table 19: Global Hydrolyzed Feather Meal Industry Revenue Million Forecast, by Export Market Analysis (Value & Volume) 2020 & 2033
- Table 20: Global Hydrolyzed Feather Meal Industry Revenue Million Forecast, by Price Trend Analysis 2020 & 2033
- Table 21: Global Hydrolyzed Feather Meal Industry Revenue Million Forecast, by Country 2020 & 2033
- Table 22: Brazil Hydrolyzed Feather Meal Industry Revenue (Million) Forecast, by Application 2020 & 2033
- Table 23: Argentina Hydrolyzed Feather Meal Industry Revenue (Million) Forecast, by Application 2020 & 2033
- Table 24: Rest of South America Hydrolyzed Feather Meal Industry Revenue (Million) Forecast, by Application 2020 & 2033
- Table 25: Global Hydrolyzed Feather Meal Industry Revenue Million Forecast, by Production Analysis 2020 & 2033
- Table 26: Global Hydrolyzed Feather Meal Industry Revenue Million Forecast, by Consumption Analysis 2020 & 2033
- Table 27: Global Hydrolyzed Feather Meal Industry Revenue Million Forecast, by Import Market Analysis (Value & Volume) 2020 & 2033
- Table 28: Global Hydrolyzed Feather Meal Industry Revenue Million Forecast, by Export Market Analysis (Value & Volume) 2020 & 2033
- Table 29: Global Hydrolyzed Feather Meal Industry Revenue Million Forecast, by Price Trend Analysis 2020 & 2033
- Table 30: Global Hydrolyzed Feather Meal Industry Revenue Million Forecast, by Country 2020 & 2033
- Table 31: United Kingdom Hydrolyzed Feather Meal Industry Revenue (Million) Forecast, by Application 2020 & 2033
- Table 32: Germany Hydrolyzed Feather Meal Industry Revenue (Million) Forecast, by Application 2020 & 2033
- Table 33: France Hydrolyzed Feather Meal Industry Revenue (Million) Forecast, by Application 2020 & 2033
- Table 34: Italy Hydrolyzed Feather Meal Industry Revenue (Million) Forecast, by Application 2020 & 2033
- Table 35: Spain Hydrolyzed Feather Meal Industry Revenue (Million) Forecast, by Application 2020 & 2033
- Table 36: Russia Hydrolyzed Feather Meal Industry Revenue (Million) Forecast, by Application 2020 & 2033
- Table 37: Benelux Hydrolyzed Feather Meal Industry Revenue (Million) Forecast, by Application 2020 & 2033
- Table 38: Nordics Hydrolyzed Feather Meal Industry Revenue (Million) Forecast, by Application 2020 & 2033
- Table 39: Rest of Europe Hydrolyzed Feather Meal Industry Revenue (Million) Forecast, by Application 2020 & 2033
- Table 40: Global Hydrolyzed Feather Meal Industry Revenue Million Forecast, by Production Analysis 2020 & 2033
- Table 41: Global Hydrolyzed Feather Meal Industry Revenue Million Forecast, by Consumption Analysis 2020 & 2033
- Table 42: Global Hydrolyzed Feather Meal Industry Revenue Million Forecast, by Import Market Analysis (Value & Volume) 2020 & 2033
- Table 43: Global Hydrolyzed Feather Meal Industry Revenue Million Forecast, by Export Market Analysis (Value & Volume) 2020 & 2033
- Table 44: Global Hydrolyzed Feather Meal Industry Revenue Million Forecast, by Price Trend Analysis 2020 & 2033
- Table 45: Global Hydrolyzed Feather Meal Industry Revenue Million Forecast, by Country 2020 & 2033
- Table 46: Turkey Hydrolyzed Feather Meal Industry Revenue (Million) Forecast, by Application 2020 & 2033
- Table 47: Israel Hydrolyzed Feather Meal Industry Revenue (Million) Forecast, by Application 2020 & 2033
- Table 48: GCC Hydrolyzed Feather Meal Industry Revenue (Million) Forecast, by Application 2020 & 2033
- Table 49: North Africa Hydrolyzed Feather Meal Industry Revenue (Million) Forecast, by Application 2020 & 2033
- Table 50: South Africa Hydrolyzed Feather Meal Industry Revenue (Million) Forecast, by Application 2020 & 2033
- Table 51: Rest of Middle East & Africa Hydrolyzed Feather Meal Industry Revenue (Million) Forecast, by Application 2020 & 2033
- Table 52: Global Hydrolyzed Feather Meal Industry Revenue Million Forecast, by Production Analysis 2020 & 2033
- Table 53: Global Hydrolyzed Feather Meal Industry Revenue Million Forecast, by Consumption Analysis 2020 & 2033
- Table 54: Global Hydrolyzed Feather Meal Industry Revenue Million Forecast, by Import Market Analysis (Value & Volume) 2020 & 2033
- Table 55: Global Hydrolyzed Feather Meal Industry Revenue Million Forecast, by Export Market Analysis (Value & Volume) 2020 & 2033
- Table 56: Global Hydrolyzed Feather Meal Industry Revenue Million Forecast, by Price Trend Analysis 2020 & 2033
- Table 57: Global Hydrolyzed Feather Meal Industry Revenue Million Forecast, by Country 2020 & 2033
- Table 58: China Hydrolyzed Feather Meal Industry Revenue (Million) Forecast, by Application 2020 & 2033
- Table 59: India Hydrolyzed Feather Meal Industry Revenue (Million) Forecast, by Application 2020 & 2033
- Table 60: Japan Hydrolyzed Feather Meal Industry Revenue (Million) Forecast, by Application 2020 & 2033
- Table 61: South Korea Hydrolyzed Feather Meal Industry Revenue (Million) Forecast, by Application 2020 & 2033
- Table 62: ASEAN Hydrolyzed Feather Meal Industry Revenue (Million) Forecast, by Application 2020 & 2033
- Table 63: Oceania Hydrolyzed Feather Meal Industry Revenue (Million) Forecast, by Application 2020 & 2033
- Table 64: Rest of Asia Pacific Hydrolyzed Feather Meal Industry Revenue (Million) Forecast, by Application 2020 & 2033
Frequently Asked Questions
1. What is the projected Compound Annual Growth Rate (CAGR) of the Hydrolyzed Feather Meal Industry?
The projected CAGR is approximately 8.60%.
2. Which companies are prominent players in the Hydrolyzed Feather Meal Industry?
Key companies in the market include Darling Ingredients, K-Pro U, Valley Proteins, The Boyer Valley Company, North Country Organics, JG Pears, Kleingarn Agrarprodukte, FASA Group.
3. What are the main segments of the Hydrolyzed Feather Meal Industry?
The market segments include Production Analysis, Consumption Analysis, Import Market Analysis (Value & Volume), Export Market Analysis (Value & Volume), Price Trend Analysis.
4. Can you provide details about the market size?
The market size is estimated to be USD 589.51 Million as of 2022.
5. What are some drivers contributing to market growth?
Adoption of Organic and Eco-friendly Farming Practices; Declining Area of Arable Land and Rising Food Security Concerns.
6. What are the notable trends driving market growth?
Increasing demand for organic farming accelerating feather meal market.
7. Are there any restraints impacting market growth?
High Demand for Conventional and Synthetic Products; Lack of Awareness and Other Factors Limiting the Adoption of Agricultural Inoculants.
8. Can you provide examples of recent developments in the market?
August 2022: The University of Danang - University of Science and Technology has successfully made a type of bio-organic fertilizer from chicken feathers with the desire to reduce environmental pollution from by-products such as chicken feathers.
9. What pricing options are available for accessing the report?
Pricing options include single-user, multi-user, and enterprise licenses priced at USD 4750, USD 5250, and USD 8750 respectively.
10. Is the market size provided in terms of value or volume?
The market size is provided in terms of value, measured in Million.
11. Are there any specific market keywords associated with the report?
Yes, the market keyword associated with the report is "Hydrolyzed Feather Meal Industry," which aids in identifying and referencing the specific market segment covered.
12. How do I determine which pricing option suits my needs best?
The pricing options vary based on user requirements and access needs. Individual users may opt for single-user licenses, while businesses requiring broader access may choose multi-user or enterprise licenses for cost-effective access to the report.
13. Are there any additional resources or data provided in the Hydrolyzed Feather Meal Industry report?
While the report offers comprehensive insights, it's advisable to review the specific contents or supplementary materials provided to ascertain if additional resources or data are available.
14. How can I stay updated on further developments or reports in the Hydrolyzed Feather Meal Industry?
To stay informed about further developments, trends, and reports in the Hydrolyzed Feather Meal Industry, consider subscribing to industry newsletters, following relevant companies and organizations, or regularly checking reputable industry news sources and publications.
Methodology
Step 1 - Identification of Relevant Samples Size from Population Database


Step 2 - Approaches for Defining Global Market Size (Value, Volume* & Price*)

Note*: In applicable scenarios
Step 3 - Data Sources
Primary Research
- Web Analytics
- Survey Reports
- Research Institute
- Latest Research Reports
- Opinion Leaders
Secondary Research
- Annual Reports
- White Paper
- Latest Press Release
- Industry Association
- Paid Database
- Investor Presentations

Step 4 - Data Triangulation
Involves using different sources of information in order to increase the validity of a study
These sources are likely to be stakeholders in a program - participants, other researchers, program staff, other community members, and so on.
Then we put all data in single framework & apply various statistical tools to find out the dynamic on the market.
During the analysis stage, feedback from the stakeholder groups would be compared to determine areas of agreement as well as areas of divergence