

Key Insights
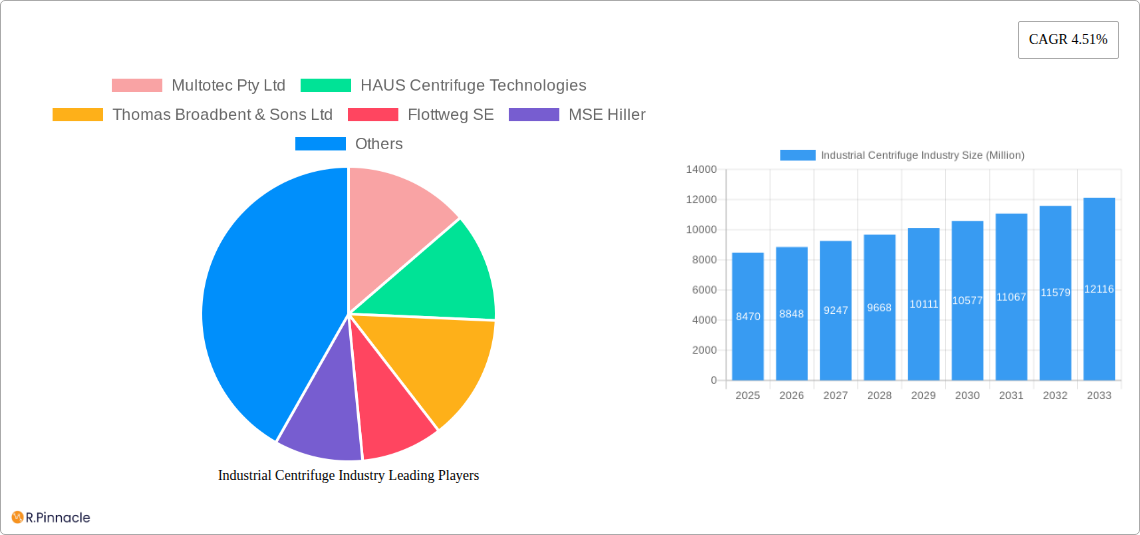
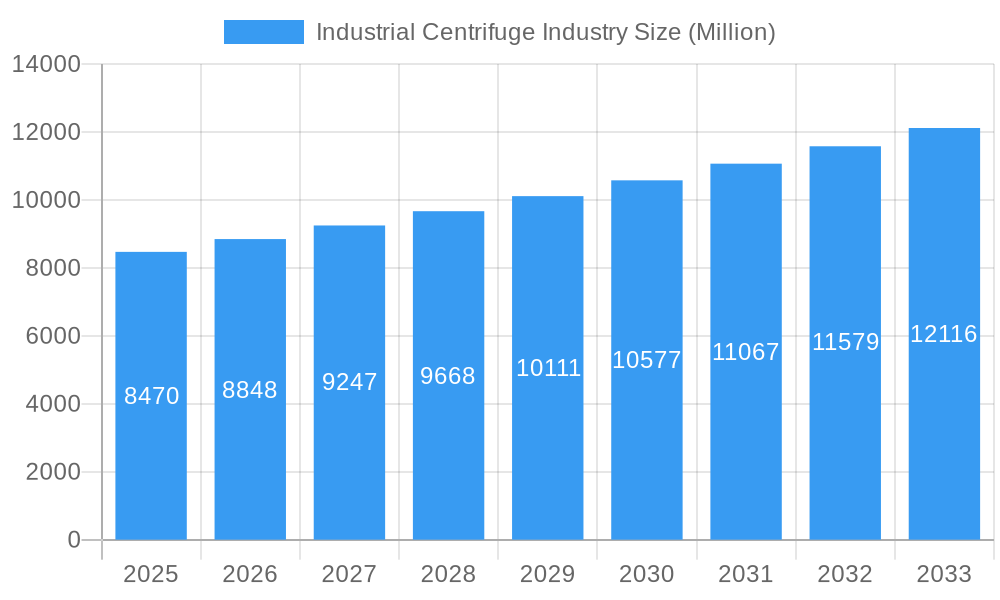
The industrial centrifuge market, valued at $8.47 billion in 2025, is projected to experience robust growth, driven by increasing demand across diverse sectors. A compound annual growth rate (CAGR) of 4.51% from 2025 to 2033 indicates a significant expansion, primarily fueled by the rising need for efficient separation and purification processes in industries like food and beverage, pharmaceuticals, and water treatment. Technological advancements leading to more efficient and energy-saving centrifuge designs, alongside stricter environmental regulations promoting waste reduction and resource recovery, further contribute to market expansion. The continuous segment holds a significant market share due to its higher processing capacity and efficiency compared to batch operation. Horizontal centrifuges are preferred in many applications due to their ease of maintenance and large capacity, while vertical centrifuges cater to specific needs, such as high-speed separation. Geographically, North America and Europe currently dominate the market, benefiting from established industrial infrastructure and stringent regulatory frameworks. However, the Asia-Pacific region is expected to witness the fastest growth due to rapid industrialization and increasing investments in manufacturing.
Industrial Centrifuge Industry Market Size (In Billion)
The market segmentation reveals significant opportunities for specialized centrifuge manufacturers. The food and beverage industry relies heavily on centrifuges for clarifying juices, separating solids from liquids, and enhancing product quality. Pharmaceutical applications demand high levels of purity and sterility, requiring advanced centrifuge technology. Similarly, water and wastewater treatment facilities utilize centrifuges for sludge dewatering and solids separation. The chemical industry employs centrifuges for various separation processes, while the metal and mining sector utilizes them for mineral processing and waste management. Competition is intense, with key players like Multotec, Flottweg, GEA Group, and Alfa Laval constantly innovating to meet evolving industry demands. Future growth will depend on manufacturers' ability to adapt to evolving regulations, offer customized solutions, and leverage technological advancements like automation and smart sensors.
Industrial Centrifuge Industry Company Market Share
Industrial Centrifuge Industry Market Report: 2019-2033
This comprehensive report provides a detailed analysis of the global industrial centrifuge market, offering actionable insights for industry professionals, investors, and stakeholders. The report covers the period from 2019 to 2033, with a base year of 2025 and a forecast period of 2025-2033. The market is segmented by type, design, operation mode, and industry, providing a granular understanding of market dynamics and future trends. The total market value is expected to reach xx Million by 2033.
Industrial Centrifuge Industry Market Structure & Innovation Trends
The industrial centrifuge market is moderately concentrated, with key players holding significant market share. Multotec Pty Ltd, HAUS Centrifuge Technologies, Thomas Broadbent & Sons Ltd, Flottweg SE, MSE Hiller, GEA Group AG, Ferrum Ltd, Andritz AG, and Alfa Laval AB are among the leading companies, collectively accounting for an estimated xx% of the global market in 2025. Market share variations among these players are influenced by factors such as technological advancements, geographic reach, and M&A activities. The estimated value of M&A deals in the industry during 2019-2024 totaled approximately xx Million.
Innovation is a key driver, fueled by the need for higher efficiency, automation, and improved separation capabilities. Regulatory frameworks concerning environmental protection and safety standards significantly influence the market. Product substitutes, while limited, include filtration and other separation techniques, creating niche competition. End-user demographics are diverse, spanning various industries with varying requirements. Recent M&A activities indicate a trend toward consolidation and expansion within the industry.
- Market Concentration: Moderately concentrated, with top players holding xx% market share.
- Innovation Drivers: Efficiency improvements, automation, advanced separation techniques.
- Regulatory Impact: Stringent environmental and safety standards.
- M&A Activity: Significant deals totaling xx Million in 2019-2024.
Industrial Centrifuge Industry Market Dynamics & Trends
The industrial centrifuge market is experiencing robust growth, driven by increasing demand across diverse end-use industries. Technological advancements, such as the integration of AI and improved control systems (as seen with GEA's X Control), are disrupting the market, leading to enhanced efficiency and reduced operational costs. The market is characterized by continuous innovation in design, materials, and operation modes. Consumer preferences are shifting towards automated, sustainable, and cost-effective solutions. The compound annual growth rate (CAGR) is projected to be xx% during the forecast period (2025-2033). Market penetration in developing economies is expected to increase significantly due to rising industrialization and infrastructure development. Competitive dynamics are shaped by product differentiation, technological advancements, and strategic partnerships.
Dominant Regions & Segments in Industrial Centrifuge Industry
The [Dominant Region, e.g., North America] region currently holds the largest market share, driven by robust industrial growth and high adoption rates across various sectors. Within the segmentation, the continuous operation mode holds the largest share, followed by horizontal centrifuge design. Within industries, the chemical, food & beverage and pharmaceutical sectors show the highest demand.
Key Drivers by Segment:
- Sedimentation Centrifuges: Driven by demand for efficient solid-liquid separation in various industries.
- Filtering Centrifuges: Increasing demand for high purity products in industries like pharmaceuticals.
- Horizontal Centrifuges: Preferred for high-throughput applications.
- Vertical Centrifuges: Suitable for smaller-scale operations or specific applications.
- Batch Operation Mode: Used in niche applications with variable feedstocks.
- Continuous Operation Mode: High demand due to its efficiency and scalability in continuous processing.
- Food and Beverages: Stringent quality and hygiene standards fuel adoption.
- Pharmaceutical: High demand for precise separation and purification.
- Water and Wastewater Treatment: Essential for removing impurities and pollutants.
- Chemical: Large-scale applications for diverse separation processes.
- Metal and Mining: Demand for efficient mineral separation and tailings processing.
- Power: Used in processes related to power generation and waste management.
- Pulp and Paper: Essential for efficient fiber separation and waste treatment.
- Other Industries: Growing demand from diverse sectors, such as oil and gas.
The dominance of specific regions and segments is primarily attributed to factors such as strong industrial growth, technological advancements, and supportive government policies. Economic growth and infrastructure development play a crucial role in market expansion.
Industrial Centrifuge Industry Product Innovations
Recent advancements include AI-integrated control systems, enhancing efficiency and data analysis. New designs focus on improved energy efficiency, reduced maintenance needs, and increased operational reliability. Materials science innovations enable centrifuges to handle more aggressive chemicals and higher temperatures. These innovations address market needs for higher throughput, better separation, and reduced operational costs. The focus is on providing tailored solutions for various industries and applications.
Report Scope & Segmentation Analysis
This report comprehensively segments the industrial centrifuge market by type (Sedimentation, Filtering), design (Horizontal, Vertical), operation mode (Batch, Continuous), and industry (Food and Beverages, Pharmaceutical, Water and Wastewater Treatment, Chemical, Metal and Mining, Power, Pulp and Paper, Other). Each segment's growth projections, market sizes, and competitive dynamics are analyzed in detail providing a complete understanding of the market's structure and potential.
Key Drivers of Industrial Centrifuge Industry Growth
Key growth drivers include increasing industrialization across various sectors, stringent environmental regulations, rising demand for high-purity products (especially in pharmaceuticals), technological advancements leading to enhanced efficiency and automation, and the development of new applications in emerging industries.
Challenges in the Industrial Centrifuge Industry Sector
Challenges include fluctuating raw material prices, stringent safety regulations requiring significant investment, the need for specialized expertise for operation and maintenance, and intense competition among established and emerging players, all impacting overall profitability. Supply chain disruptions can also lead to production delays and increased costs.
Emerging Opportunities in Industrial Centrifuge Industry
Emerging opportunities lie in developing energy-efficient designs, expanding into new and emerging markets (especially developing economies), integrating advanced technologies such as AI and IoT for predictive maintenance and remote monitoring, and creating specialized solutions for niche applications within existing industries.
Leading Players in the Industrial Centrifuge Industry Market
- Multotec Pty Ltd
- HAUS Centrifuge Technologies
- Thomas Broadbent & Sons Ltd
- Flottweg SE
- MSE Hiller
- GEA Group AG
- Ferrum Ltd
- Andritz AG
- Alfa Laval AB
Key Developments in Industrial Centrifuge Industry Industry
- January 2024: GEA unveiled X Control, a new centrifuge control system incorporating AI for improved data analysis and self-optimization.
- September 2023: The US Army ERDC upgraded beam centrifuges, enhancing functionality and modernization.
- February 2023: Eppendorf Group expanded its manufacturing presence in China, focusing on local market needs.
Future Outlook for Industrial Centrifuge Industry Market
The industrial centrifuge market is poised for continued growth, driven by technological innovation, increasing industrialization, and rising demand across various sectors. Strategic partnerships, mergers, and acquisitions are expected to reshape the competitive landscape. Opportunities exist in developing customized solutions for niche applications and expanding into new markets. The market is expected to experience robust growth, with a positive outlook for the next decade.
Industrial Centrifuge Industry Segmentation
-
1. Type
-
1.1. Sedimentation
- 1.1.1. Clarifier/Thickener Centrifuges
- 1.1.2. Decanter Centrifuges
- 1.1.3. Disc Stack Centrifuges
- 1.1.4. Hydrocyclones
- 1.1.5. Other Sedimentation Centrifuges
-
1.2. Filtering
- 1.2.1. Basket Centrifuges
- 1.2.2. Scroll Screen Centrifuges
- 1.2.3. Peeler Centrifuges
- 1.2.4. Pusher Centrifuges
- 1.2.5. Other Filtering Centrifuges
-
1.1. Sedimentation
-
2. Design
- 2.1. Horizontal Centrifuges
- 2.2. Vertical Centrifuges
-
3. Operation Mode
- 3.1. Batch
- 3.2. Continuous
-
4. Industry
- 4.1. Food and Beverages
- 4.2. Pharmaceutical
- 4.3. Water and Wastewater Treatment
- 4.4. Chemical
- 4.5. Metal and Mining
- 4.6. Power
- 4.7. Pulp and Paper
- 4.8. Other Industries
Industrial Centrifuge Industry Segmentation By Geography
-
1. North America
- 1.1. United States
- 1.2. Canada
- 1.3. Rest of North America
-
2. Europe
- 2.1. Germany
- 2.2. France
- 2.3. United Kingdom
- 2.4. Italy
- 2.5. Spain
- 2.6. Russia
- 2.7. NORDIC
- 2.8. Turkey
- 2.9. Rest of Europe
-
3. Asia Pacific
- 3.1. China
- 3.2. India
- 3.3. Japan
- 3.4. Australia
- 3.5. South Korea
- 3.6. Malaysia
- 3.7. Thailand
- 3.8. Indonesia
- 3.9. Vietnam
- 3.10. Rest of the Asia Pacific
-
4. South America
- 4.1. Brazil
- 4.2. Argentina
- 4.3. Chile
- 4.4. Colombia
- 4.5. Rest of South America
-
5. Middle East and Africa
- 5.1. United Arab Emirates
- 5.2. Saudi Arabia
- 5.3. Qatar
- 5.4. South Africa
- 5.5. Nigeria
- 5.6. Egypt
- 5.7. Rest of the Middle East and Africa
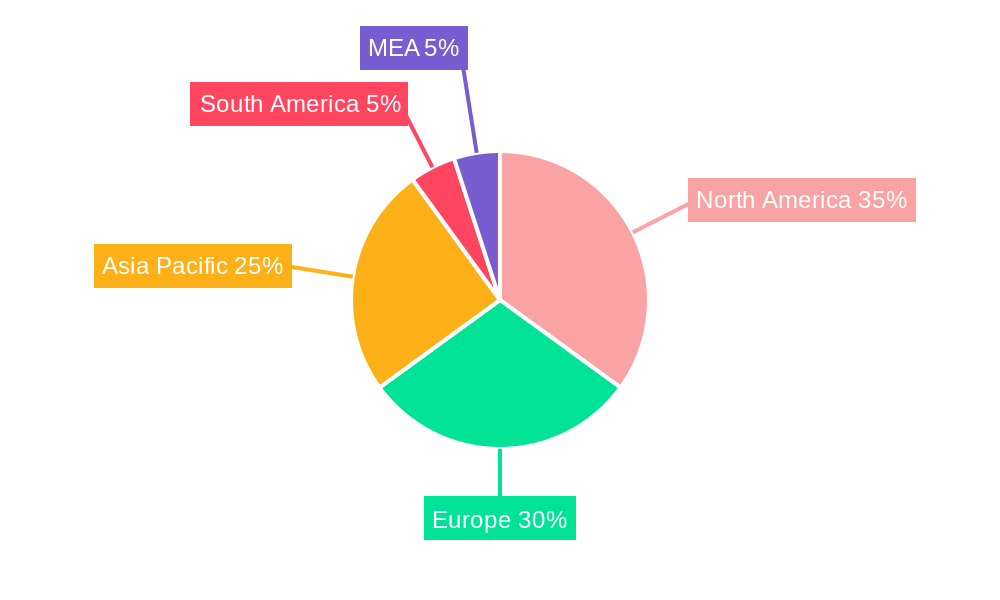
Industrial Centrifuge Industry Regional Market Share
Geographic Coverage of Industrial Centrifuge Industry
Industrial Centrifuge Industry REPORT HIGHLIGHTS
| Aspects | Details |
|---|---|
| Study Period | 2020-2034 |
| Base Year | 2025 |
| Estimated Year | 2026 |
| Forecast Period | 2026-2034 |
| Historical Period | 2020-2025 |
| Growth Rate | CAGR of 4.51% from 2020-2034 |
| Segmentation |
|
Table of Contents
- 1. Introduction
- 1.1. Research Scope
- 1.2. Market Segmentation
- 1.3. Research Objective
- 1.4. Definitions and Assumptions
- 2. Executive Summary
- 2.1. Market Snapshot
- 3. Market Dynamics
- 3.1. Market Drivers
- 3.2. Market Restrains
- 3.3. Market Trends
- 3.4. Market Opportunities
- 4. Market Factor Analysis
- 4.1. Porters Five Forces
- 4.1.1. Bargaining Power of Suppliers
- 4.1.2. Bargaining Power of Buyers
- 4.1.3. Threat of New Entrants
- 4.1.4. Threat of Substitutes
- 4.1.5. Competitive Rivalry
- 4.2. PESTEL analysis
- 4.3. BCG Analysis
- 4.3.1. Stars (High Growth, High Market Share)
- 4.3.2. Cash Cows (Low Growth, High Market Share)
- 4.3.3. Question Mark (High Growth, Low Market Share)
- 4.3.4. Dogs (Low Growth, Low Market Share)
- 4.4. Ansoff Matrix Analysis
- 4.5. Supply Chain Analysis
- 4.6. Regulatory Landscape
- 4.7. Current Market Potential and Opportunity Assessment (TAM–SAM–SOM Framework)
- 4.8. PRI Analyst Note
- 4.1. Porters Five Forces
- 5. Market Analysis, Insights and Forecast 2021-2033
- 5.1. Market Analysis, Insights and Forecast - by Type
- 5.1.1. Sedimentation
- 5.1.1.1. Clarifier/Thickener Centrifuges
- 5.1.1.2. Decanter Centrifuges
- 5.1.1.3. Disc Stack Centrifuges
- 5.1.1.4. Hydrocyclones
- 5.1.1.5. Other Sedimentation Centrifuges
- 5.1.2. Filtering
- 5.1.2.1. Basket Centrifuges
- 5.1.2.2. Scroll Screen Centrifuges
- 5.1.2.3. Peeler Centrifuges
- 5.1.2.4. Pusher Centrifuges
- 5.1.2.5. Other Filtering Centrifuges
- 5.1.1. Sedimentation
- 5.2. Market Analysis, Insights and Forecast - by Design
- 5.2.1. Horizontal Centrifuges
- 5.2.2. Vertical Centrifuges
- 5.3. Market Analysis, Insights and Forecast - by Operation Mode
- 5.3.1. Batch
- 5.3.2. Continuous
- 5.4. Market Analysis, Insights and Forecast - by Industry
- 5.4.1. Food and Beverages
- 5.4.2. Pharmaceutical
- 5.4.3. Water and Wastewater Treatment
- 5.4.4. Chemical
- 5.4.5. Metal and Mining
- 5.4.6. Power
- 5.4.7. Pulp and Paper
- 5.4.8. Other Industries
- 5.5. Market Analysis, Insights and Forecast - by Region
- 5.5.1. North America
- 5.5.2. Europe
- 5.5.3. Asia Pacific
- 5.5.4. South America
- 5.5.5. Middle East and Africa
- 5.1. Market Analysis, Insights and Forecast - by Type
- 6. Global Industrial Centrifuge Industry Analysis, Insights and Forecast, 2021-2033
- 6.1. Market Analysis, Insights and Forecast - by Type
- 6.1.1. Sedimentation
- 6.1.1.1. Clarifier/Thickener Centrifuges
- 6.1.1.2. Decanter Centrifuges
- 6.1.1.3. Disc Stack Centrifuges
- 6.1.1.4. Hydrocyclones
- 6.1.1.5. Other Sedimentation Centrifuges
- 6.1.2. Filtering
- 6.1.2.1. Basket Centrifuges
- 6.1.2.2. Scroll Screen Centrifuges
- 6.1.2.3. Peeler Centrifuges
- 6.1.2.4. Pusher Centrifuges
- 6.1.2.5. Other Filtering Centrifuges
- 6.1.1. Sedimentation
- 6.2. Market Analysis, Insights and Forecast - by Design
- 6.2.1. Horizontal Centrifuges
- 6.2.2. Vertical Centrifuges
- 6.3. Market Analysis, Insights and Forecast - by Operation Mode
- 6.3.1. Batch
- 6.3.2. Continuous
- 6.4. Market Analysis, Insights and Forecast - by Industry
- 6.4.1. Food and Beverages
- 6.4.2. Pharmaceutical
- 6.4.3. Water and Wastewater Treatment
- 6.4.4. Chemical
- 6.4.5. Metal and Mining
- 6.4.6. Power
- 6.4.7. Pulp and Paper
- 6.4.8. Other Industries
- 6.1. Market Analysis, Insights and Forecast - by Type
- 7. North America Industrial Centrifuge Industry Analysis, Insights and Forecast, 2020-2032
- 7.1. Market Analysis, Insights and Forecast - by Type
- 7.1.1. Sedimentation
- 7.1.1.1. Clarifier/Thickener Centrifuges
- 7.1.1.2. Decanter Centrifuges
- 7.1.1.3. Disc Stack Centrifuges
- 7.1.1.4. Hydrocyclones
- 7.1.1.5. Other Sedimentation Centrifuges
- 7.1.2. Filtering
- 7.1.2.1. Basket Centrifuges
- 7.1.2.2. Scroll Screen Centrifuges
- 7.1.2.3. Peeler Centrifuges
- 7.1.2.4. Pusher Centrifuges
- 7.1.2.5. Other Filtering Centrifuges
- 7.1.1. Sedimentation
- 7.2. Market Analysis, Insights and Forecast - by Design
- 7.2.1. Horizontal Centrifuges
- 7.2.2. Vertical Centrifuges
- 7.3. Market Analysis, Insights and Forecast - by Operation Mode
- 7.3.1. Batch
- 7.3.2. Continuous
- 7.4. Market Analysis, Insights and Forecast - by Industry
- 7.4.1. Food and Beverages
- 7.4.2. Pharmaceutical
- 7.4.3. Water and Wastewater Treatment
- 7.4.4. Chemical
- 7.4.5. Metal and Mining
- 7.4.6. Power
- 7.4.7. Pulp and Paper
- 7.4.8. Other Industries
- 7.1. Market Analysis, Insights and Forecast - by Type
- 8. Europe Industrial Centrifuge Industry Analysis, Insights and Forecast, 2020-2032
- 8.1. Market Analysis, Insights and Forecast - by Type
- 8.1.1. Sedimentation
- 8.1.1.1. Clarifier/Thickener Centrifuges
- 8.1.1.2. Decanter Centrifuges
- 8.1.1.3. Disc Stack Centrifuges
- 8.1.1.4. Hydrocyclones
- 8.1.1.5. Other Sedimentation Centrifuges
- 8.1.2. Filtering
- 8.1.2.1. Basket Centrifuges
- 8.1.2.2. Scroll Screen Centrifuges
- 8.1.2.3. Peeler Centrifuges
- 8.1.2.4. Pusher Centrifuges
- 8.1.2.5. Other Filtering Centrifuges
- 8.1.1. Sedimentation
- 8.2. Market Analysis, Insights and Forecast - by Design
- 8.2.1. Horizontal Centrifuges
- 8.2.2. Vertical Centrifuges
- 8.3. Market Analysis, Insights and Forecast - by Operation Mode
- 8.3.1. Batch
- 8.3.2. Continuous
- 8.4. Market Analysis, Insights and Forecast - by Industry
- 8.4.1. Food and Beverages
- 8.4.2. Pharmaceutical
- 8.4.3. Water and Wastewater Treatment
- 8.4.4. Chemical
- 8.4.5. Metal and Mining
- 8.4.6. Power
- 8.4.7. Pulp and Paper
- 8.4.8. Other Industries
- 8.1. Market Analysis, Insights and Forecast - by Type
- 9. Asia Pacific Industrial Centrifuge Industry Analysis, Insights and Forecast, 2020-2032
- 9.1. Market Analysis, Insights and Forecast - by Type
- 9.1.1. Sedimentation
- 9.1.1.1. Clarifier/Thickener Centrifuges
- 9.1.1.2. Decanter Centrifuges
- 9.1.1.3. Disc Stack Centrifuges
- 9.1.1.4. Hydrocyclones
- 9.1.1.5. Other Sedimentation Centrifuges
- 9.1.2. Filtering
- 9.1.2.1. Basket Centrifuges
- 9.1.2.2. Scroll Screen Centrifuges
- 9.1.2.3. Peeler Centrifuges
- 9.1.2.4. Pusher Centrifuges
- 9.1.2.5. Other Filtering Centrifuges
- 9.1.1. Sedimentation
- 9.2. Market Analysis, Insights and Forecast - by Design
- 9.2.1. Horizontal Centrifuges
- 9.2.2. Vertical Centrifuges
- 9.3. Market Analysis, Insights and Forecast - by Operation Mode
- 9.3.1. Batch
- 9.3.2. Continuous
- 9.4. Market Analysis, Insights and Forecast - by Industry
- 9.4.1. Food and Beverages
- 9.4.2. Pharmaceutical
- 9.4.3. Water and Wastewater Treatment
- 9.4.4. Chemical
- 9.4.5. Metal and Mining
- 9.4.6. Power
- 9.4.7. Pulp and Paper
- 9.4.8. Other Industries
- 9.1. Market Analysis, Insights and Forecast - by Type
- 10. South America Industrial Centrifuge Industry Analysis, Insights and Forecast, 2020-2032
- 10.1. Market Analysis, Insights and Forecast - by Type
- 10.1.1. Sedimentation
- 10.1.1.1. Clarifier/Thickener Centrifuges
- 10.1.1.2. Decanter Centrifuges
- 10.1.1.3. Disc Stack Centrifuges
- 10.1.1.4. Hydrocyclones
- 10.1.1.5. Other Sedimentation Centrifuges
- 10.1.2. Filtering
- 10.1.2.1. Basket Centrifuges
- 10.1.2.2. Scroll Screen Centrifuges
- 10.1.2.3. Peeler Centrifuges
- 10.1.2.4. Pusher Centrifuges
- 10.1.2.5. Other Filtering Centrifuges
- 10.1.1. Sedimentation
- 10.2. Market Analysis, Insights and Forecast - by Design
- 10.2.1. Horizontal Centrifuges
- 10.2.2. Vertical Centrifuges
- 10.3. Market Analysis, Insights and Forecast - by Operation Mode
- 10.3.1. Batch
- 10.3.2. Continuous
- 10.4. Market Analysis, Insights and Forecast - by Industry
- 10.4.1. Food and Beverages
- 10.4.2. Pharmaceutical
- 10.4.3. Water and Wastewater Treatment
- 10.4.4. Chemical
- 10.4.5. Metal and Mining
- 10.4.6. Power
- 10.4.7. Pulp and Paper
- 10.4.8. Other Industries
- 10.1. Market Analysis, Insights and Forecast - by Type
- 11. Middle East and Africa Industrial Centrifuge Industry Analysis, Insights and Forecast, 2020-2032
- 11.1. Market Analysis, Insights and Forecast - by Type
- 11.1.1. Sedimentation
- 11.1.1.1. Clarifier/Thickener Centrifuges
- 11.1.1.2. Decanter Centrifuges
- 11.1.1.3. Disc Stack Centrifuges
- 11.1.1.4. Hydrocyclones
- 11.1.1.5. Other Sedimentation Centrifuges
- 11.1.2. Filtering
- 11.1.2.1. Basket Centrifuges
- 11.1.2.2. Scroll Screen Centrifuges
- 11.1.2.3. Peeler Centrifuges
- 11.1.2.4. Pusher Centrifuges
- 11.1.2.5. Other Filtering Centrifuges
- 11.1.1. Sedimentation
- 11.2. Market Analysis, Insights and Forecast - by Design
- 11.2.1. Horizontal Centrifuges
- 11.2.2. Vertical Centrifuges
- 11.3. Market Analysis, Insights and Forecast - by Operation Mode
- 11.3.1. Batch
- 11.3.2. Continuous
- 11.4. Market Analysis, Insights and Forecast - by Industry
- 11.4.1. Food and Beverages
- 11.4.2. Pharmaceutical
- 11.4.3. Water and Wastewater Treatment
- 11.4.4. Chemical
- 11.4.5. Metal and Mining
- 11.4.6. Power
- 11.4.7. Pulp and Paper
- 11.4.8. Other Industries
- 11.1. Market Analysis, Insights and Forecast - by Type
- 12. Competitive Analysis
- 12.1. Company Profiles
- 12.1.1 Multotec Pty Ltd
- 12.1.1.1. Company Overview
- 12.1.1.2. Products
- 12.1.1.3. Company Financials
- 12.1.1.4. SWOT Analysis
- 12.1.2 HAUS Centrifuge Technologies
- 12.1.2.1. Company Overview
- 12.1.2.2. Products
- 12.1.2.3. Company Financials
- 12.1.2.4. SWOT Analysis
- 12.1.3 Thomas Broadbent & Sons Ltd
- 12.1.3.1. Company Overview
- 12.1.3.2. Products
- 12.1.3.3. Company Financials
- 12.1.3.4. SWOT Analysis
- 12.1.4 Flottweg SE
- 12.1.4.1. Company Overview
- 12.1.4.2. Products
- 12.1.4.3. Company Financials
- 12.1.4.4. SWOT Analysis
- 12.1.5 MSE Hiller
- 12.1.5.1. Company Overview
- 12.1.5.2. Products
- 12.1.5.3. Company Financials
- 12.1.5.4. SWOT Analysis
- 12.1.6 GEA Group AG
- 12.1.6.1. Company Overview
- 12.1.6.2. Products
- 12.1.6.3. Company Financials
- 12.1.6.4. SWOT Analysis
- 12.1.7 Ferrum Ltd
- 12.1.7.1. Company Overview
- 12.1.7.2. Products
- 12.1.7.3. Company Financials
- 12.1.7.4. SWOT Analysis
- 12.1.8 Andritz AG
- 12.1.8.1. Company Overview
- 12.1.8.2. Products
- 12.1.8.3. Company Financials
- 12.1.8.4. SWOT Analysis
- 12.1.9 Alfa Laval AB
- 12.1.9.1. Company Overview
- 12.1.9.2. Products
- 12.1.9.3. Company Financials
- 12.1.9.4. SWOT Analysis
- 12.1.1 Multotec Pty Ltd
- 12.2. Market Entropy
- 12.2.1 Company's Key Areas Served
- 12.2.2 Recent Developments
- 12.3. Company Market Share Analysis 2025
- 12.3.1 Top 5 Companies Market Share Analysis
- 12.3.2 Top 3 Companies Market Share Analysis
- 12.4. List of Potential Customers
- 13. Research Methodology
List of Figures
- Figure 1: Global Industrial Centrifuge Industry Revenue Breakdown (Million, %) by Region 2025 & 2033
- Figure 2: Global Industrial Centrifuge Industry Volume Breakdown (K Unit, %) by Region 2025 & 2033
- Figure 3: North America Industrial Centrifuge Industry Revenue (Million), by Type 2025 & 2033
- Figure 4: North America Industrial Centrifuge Industry Volume (K Unit), by Type 2025 & 2033
- Figure 5: North America Industrial Centrifuge Industry Revenue Share (%), by Type 2025 & 2033
- Figure 6: North America Industrial Centrifuge Industry Volume Share (%), by Type 2025 & 2033
- Figure 7: North America Industrial Centrifuge Industry Revenue (Million), by Design 2025 & 2033
- Figure 8: North America Industrial Centrifuge Industry Volume (K Unit), by Design 2025 & 2033
- Figure 9: North America Industrial Centrifuge Industry Revenue Share (%), by Design 2025 & 2033
- Figure 10: North America Industrial Centrifuge Industry Volume Share (%), by Design 2025 & 2033
- Figure 11: North America Industrial Centrifuge Industry Revenue (Million), by Operation Mode 2025 & 2033
- Figure 12: North America Industrial Centrifuge Industry Volume (K Unit), by Operation Mode 2025 & 2033
- Figure 13: North America Industrial Centrifuge Industry Revenue Share (%), by Operation Mode 2025 & 2033
- Figure 14: North America Industrial Centrifuge Industry Volume Share (%), by Operation Mode 2025 & 2033
- Figure 15: North America Industrial Centrifuge Industry Revenue (Million), by Industry 2025 & 2033
- Figure 16: North America Industrial Centrifuge Industry Volume (K Unit), by Industry 2025 & 2033
- Figure 17: North America Industrial Centrifuge Industry Revenue Share (%), by Industry 2025 & 2033
- Figure 18: North America Industrial Centrifuge Industry Volume Share (%), by Industry 2025 & 2033
- Figure 19: North America Industrial Centrifuge Industry Revenue (Million), by Country 2025 & 2033
- Figure 20: North America Industrial Centrifuge Industry Volume (K Unit), by Country 2025 & 2033
- Figure 21: North America Industrial Centrifuge Industry Revenue Share (%), by Country 2025 & 2033
- Figure 22: North America Industrial Centrifuge Industry Volume Share (%), by Country 2025 & 2033
- Figure 23: Europe Industrial Centrifuge Industry Revenue (Million), by Type 2025 & 2033
- Figure 24: Europe Industrial Centrifuge Industry Volume (K Unit), by Type 2025 & 2033
- Figure 25: Europe Industrial Centrifuge Industry Revenue Share (%), by Type 2025 & 2033
- Figure 26: Europe Industrial Centrifuge Industry Volume Share (%), by Type 2025 & 2033
- Figure 27: Europe Industrial Centrifuge Industry Revenue (Million), by Design 2025 & 2033
- Figure 28: Europe Industrial Centrifuge Industry Volume (K Unit), by Design 2025 & 2033
- Figure 29: Europe Industrial Centrifuge Industry Revenue Share (%), by Design 2025 & 2033
- Figure 30: Europe Industrial Centrifuge Industry Volume Share (%), by Design 2025 & 2033
- Figure 31: Europe Industrial Centrifuge Industry Revenue (Million), by Operation Mode 2025 & 2033
- Figure 32: Europe Industrial Centrifuge Industry Volume (K Unit), by Operation Mode 2025 & 2033
- Figure 33: Europe Industrial Centrifuge Industry Revenue Share (%), by Operation Mode 2025 & 2033
- Figure 34: Europe Industrial Centrifuge Industry Volume Share (%), by Operation Mode 2025 & 2033
- Figure 35: Europe Industrial Centrifuge Industry Revenue (Million), by Industry 2025 & 2033
- Figure 36: Europe Industrial Centrifuge Industry Volume (K Unit), by Industry 2025 & 2033
- Figure 37: Europe Industrial Centrifuge Industry Revenue Share (%), by Industry 2025 & 2033
- Figure 38: Europe Industrial Centrifuge Industry Volume Share (%), by Industry 2025 & 2033
- Figure 39: Europe Industrial Centrifuge Industry Revenue (Million), by Country 2025 & 2033
- Figure 40: Europe Industrial Centrifuge Industry Volume (K Unit), by Country 2025 & 2033
- Figure 41: Europe Industrial Centrifuge Industry Revenue Share (%), by Country 2025 & 2033
- Figure 42: Europe Industrial Centrifuge Industry Volume Share (%), by Country 2025 & 2033
- Figure 43: Asia Pacific Industrial Centrifuge Industry Revenue (Million), by Type 2025 & 2033
- Figure 44: Asia Pacific Industrial Centrifuge Industry Volume (K Unit), by Type 2025 & 2033
- Figure 45: Asia Pacific Industrial Centrifuge Industry Revenue Share (%), by Type 2025 & 2033
- Figure 46: Asia Pacific Industrial Centrifuge Industry Volume Share (%), by Type 2025 & 2033
- Figure 47: Asia Pacific Industrial Centrifuge Industry Revenue (Million), by Design 2025 & 2033
- Figure 48: Asia Pacific Industrial Centrifuge Industry Volume (K Unit), by Design 2025 & 2033
- Figure 49: Asia Pacific Industrial Centrifuge Industry Revenue Share (%), by Design 2025 & 2033
- Figure 50: Asia Pacific Industrial Centrifuge Industry Volume Share (%), by Design 2025 & 2033
- Figure 51: Asia Pacific Industrial Centrifuge Industry Revenue (Million), by Operation Mode 2025 & 2033
- Figure 52: Asia Pacific Industrial Centrifuge Industry Volume (K Unit), by Operation Mode 2025 & 2033
- Figure 53: Asia Pacific Industrial Centrifuge Industry Revenue Share (%), by Operation Mode 2025 & 2033
- Figure 54: Asia Pacific Industrial Centrifuge Industry Volume Share (%), by Operation Mode 2025 & 2033
- Figure 55: Asia Pacific Industrial Centrifuge Industry Revenue (Million), by Industry 2025 & 2033
- Figure 56: Asia Pacific Industrial Centrifuge Industry Volume (K Unit), by Industry 2025 & 2033
- Figure 57: Asia Pacific Industrial Centrifuge Industry Revenue Share (%), by Industry 2025 & 2033
- Figure 58: Asia Pacific Industrial Centrifuge Industry Volume Share (%), by Industry 2025 & 2033
- Figure 59: Asia Pacific Industrial Centrifuge Industry Revenue (Million), by Country 2025 & 2033
- Figure 60: Asia Pacific Industrial Centrifuge Industry Volume (K Unit), by Country 2025 & 2033
- Figure 61: Asia Pacific Industrial Centrifuge Industry Revenue Share (%), by Country 2025 & 2033
- Figure 62: Asia Pacific Industrial Centrifuge Industry Volume Share (%), by Country 2025 & 2033
- Figure 63: South America Industrial Centrifuge Industry Revenue (Million), by Type 2025 & 2033
- Figure 64: South America Industrial Centrifuge Industry Volume (K Unit), by Type 2025 & 2033
- Figure 65: South America Industrial Centrifuge Industry Revenue Share (%), by Type 2025 & 2033
- Figure 66: South America Industrial Centrifuge Industry Volume Share (%), by Type 2025 & 2033
- Figure 67: South America Industrial Centrifuge Industry Revenue (Million), by Design 2025 & 2033
- Figure 68: South America Industrial Centrifuge Industry Volume (K Unit), by Design 2025 & 2033
- Figure 69: South America Industrial Centrifuge Industry Revenue Share (%), by Design 2025 & 2033
- Figure 70: South America Industrial Centrifuge Industry Volume Share (%), by Design 2025 & 2033
- Figure 71: South America Industrial Centrifuge Industry Revenue (Million), by Operation Mode 2025 & 2033
- Figure 72: South America Industrial Centrifuge Industry Volume (K Unit), by Operation Mode 2025 & 2033
- Figure 73: South America Industrial Centrifuge Industry Revenue Share (%), by Operation Mode 2025 & 2033
- Figure 74: South America Industrial Centrifuge Industry Volume Share (%), by Operation Mode 2025 & 2033
- Figure 75: South America Industrial Centrifuge Industry Revenue (Million), by Industry 2025 & 2033
- Figure 76: South America Industrial Centrifuge Industry Volume (K Unit), by Industry 2025 & 2033
- Figure 77: South America Industrial Centrifuge Industry Revenue Share (%), by Industry 2025 & 2033
- Figure 78: South America Industrial Centrifuge Industry Volume Share (%), by Industry 2025 & 2033
- Figure 79: South America Industrial Centrifuge Industry Revenue (Million), by Country 2025 & 2033
- Figure 80: South America Industrial Centrifuge Industry Volume (K Unit), by Country 2025 & 2033
- Figure 81: South America Industrial Centrifuge Industry Revenue Share (%), by Country 2025 & 2033
- Figure 82: South America Industrial Centrifuge Industry Volume Share (%), by Country 2025 & 2033
- Figure 83: Middle East and Africa Industrial Centrifuge Industry Revenue (Million), by Type 2025 & 2033
- Figure 84: Middle East and Africa Industrial Centrifuge Industry Volume (K Unit), by Type 2025 & 2033
- Figure 85: Middle East and Africa Industrial Centrifuge Industry Revenue Share (%), by Type 2025 & 2033
- Figure 86: Middle East and Africa Industrial Centrifuge Industry Volume Share (%), by Type 2025 & 2033
- Figure 87: Middle East and Africa Industrial Centrifuge Industry Revenue (Million), by Design 2025 & 2033
- Figure 88: Middle East and Africa Industrial Centrifuge Industry Volume (K Unit), by Design 2025 & 2033
- Figure 89: Middle East and Africa Industrial Centrifuge Industry Revenue Share (%), by Design 2025 & 2033
- Figure 90: Middle East and Africa Industrial Centrifuge Industry Volume Share (%), by Design 2025 & 2033
- Figure 91: Middle East and Africa Industrial Centrifuge Industry Revenue (Million), by Operation Mode 2025 & 2033
- Figure 92: Middle East and Africa Industrial Centrifuge Industry Volume (K Unit), by Operation Mode 2025 & 2033
- Figure 93: Middle East and Africa Industrial Centrifuge Industry Revenue Share (%), by Operation Mode 2025 & 2033
- Figure 94: Middle East and Africa Industrial Centrifuge Industry Volume Share (%), by Operation Mode 2025 & 2033
- Figure 95: Middle East and Africa Industrial Centrifuge Industry Revenue (Million), by Industry 2025 & 2033
- Figure 96: Middle East and Africa Industrial Centrifuge Industry Volume (K Unit), by Industry 2025 & 2033
- Figure 97: Middle East and Africa Industrial Centrifuge Industry Revenue Share (%), by Industry 2025 & 2033
- Figure 98: Middle East and Africa Industrial Centrifuge Industry Volume Share (%), by Industry 2025 & 2033
- Figure 99: Middle East and Africa Industrial Centrifuge Industry Revenue (Million), by Country 2025 & 2033
- Figure 100: Middle East and Africa Industrial Centrifuge Industry Volume (K Unit), by Country 2025 & 2033
- Figure 101: Middle East and Africa Industrial Centrifuge Industry Revenue Share (%), by Country 2025 & 2033
- Figure 102: Middle East and Africa Industrial Centrifuge Industry Volume Share (%), by Country 2025 & 2033
List of Tables
- Table 1: Global Industrial Centrifuge Industry Revenue Million Forecast, by Type 2020 & 2033
- Table 2: Global Industrial Centrifuge Industry Volume K Unit Forecast, by Type 2020 & 2033
- Table 3: Global Industrial Centrifuge Industry Revenue Million Forecast, by Design 2020 & 2033
- Table 4: Global Industrial Centrifuge Industry Volume K Unit Forecast, by Design 2020 & 2033
- Table 5: Global Industrial Centrifuge Industry Revenue Million Forecast, by Operation Mode 2020 & 2033
- Table 6: Global Industrial Centrifuge Industry Volume K Unit Forecast, by Operation Mode 2020 & 2033
- Table 7: Global Industrial Centrifuge Industry Revenue Million Forecast, by Industry 2020 & 2033
- Table 8: Global Industrial Centrifuge Industry Volume K Unit Forecast, by Industry 2020 & 2033
- Table 9: Global Industrial Centrifuge Industry Revenue Million Forecast, by Region 2020 & 2033
- Table 10: Global Industrial Centrifuge Industry Volume K Unit Forecast, by Region 2020 & 2033
- Table 11: Global Industrial Centrifuge Industry Revenue Million Forecast, by Type 2020 & 2033
- Table 12: Global Industrial Centrifuge Industry Volume K Unit Forecast, by Type 2020 & 2033
- Table 13: Global Industrial Centrifuge Industry Revenue Million Forecast, by Design 2020 & 2033
- Table 14: Global Industrial Centrifuge Industry Volume K Unit Forecast, by Design 2020 & 2033
- Table 15: Global Industrial Centrifuge Industry Revenue Million Forecast, by Operation Mode 2020 & 2033
- Table 16: Global Industrial Centrifuge Industry Volume K Unit Forecast, by Operation Mode 2020 & 2033
- Table 17: Global Industrial Centrifuge Industry Revenue Million Forecast, by Industry 2020 & 2033
- Table 18: Global Industrial Centrifuge Industry Volume K Unit Forecast, by Industry 2020 & 2033
- Table 19: Global Industrial Centrifuge Industry Revenue Million Forecast, by Country 2020 & 2033
- Table 20: Global Industrial Centrifuge Industry Volume K Unit Forecast, by Country 2020 & 2033
- Table 21: United States Industrial Centrifuge Industry Revenue (Million) Forecast, by Application 2020 & 2033
- Table 22: United States Industrial Centrifuge Industry Volume (K Unit) Forecast, by Application 2020 & 2033
- Table 23: Canada Industrial Centrifuge Industry Revenue (Million) Forecast, by Application 2020 & 2033
- Table 24: Canada Industrial Centrifuge Industry Volume (K Unit) Forecast, by Application 2020 & 2033
- Table 25: Rest of North America Industrial Centrifuge Industry Revenue (Million) Forecast, by Application 2020 & 2033
- Table 26: Rest of North America Industrial Centrifuge Industry Volume (K Unit) Forecast, by Application 2020 & 2033
- Table 27: Global Industrial Centrifuge Industry Revenue Million Forecast, by Type 2020 & 2033
- Table 28: Global Industrial Centrifuge Industry Volume K Unit Forecast, by Type 2020 & 2033
- Table 29: Global Industrial Centrifuge Industry Revenue Million Forecast, by Design 2020 & 2033
- Table 30: Global Industrial Centrifuge Industry Volume K Unit Forecast, by Design 2020 & 2033
- Table 31: Global Industrial Centrifuge Industry Revenue Million Forecast, by Operation Mode 2020 & 2033
- Table 32: Global Industrial Centrifuge Industry Volume K Unit Forecast, by Operation Mode 2020 & 2033
- Table 33: Global Industrial Centrifuge Industry Revenue Million Forecast, by Industry 2020 & 2033
- Table 34: Global Industrial Centrifuge Industry Volume K Unit Forecast, by Industry 2020 & 2033
- Table 35: Global Industrial Centrifuge Industry Revenue Million Forecast, by Country 2020 & 2033
- Table 36: Global Industrial Centrifuge Industry Volume K Unit Forecast, by Country 2020 & 2033
- Table 37: Germany Industrial Centrifuge Industry Revenue (Million) Forecast, by Application 2020 & 2033
- Table 38: Germany Industrial Centrifuge Industry Volume (K Unit) Forecast, by Application 2020 & 2033
- Table 39: France Industrial Centrifuge Industry Revenue (Million) Forecast, by Application 2020 & 2033
- Table 40: France Industrial Centrifuge Industry Volume (K Unit) Forecast, by Application 2020 & 2033
- Table 41: United Kingdom Industrial Centrifuge Industry Revenue (Million) Forecast, by Application 2020 & 2033
- Table 42: United Kingdom Industrial Centrifuge Industry Volume (K Unit) Forecast, by Application 2020 & 2033
- Table 43: Italy Industrial Centrifuge Industry Revenue (Million) Forecast, by Application 2020 & 2033
- Table 44: Italy Industrial Centrifuge Industry Volume (K Unit) Forecast, by Application 2020 & 2033
- Table 45: Spain Industrial Centrifuge Industry Revenue (Million) Forecast, by Application 2020 & 2033
- Table 46: Spain Industrial Centrifuge Industry Volume (K Unit) Forecast, by Application 2020 & 2033
- Table 47: Russia Industrial Centrifuge Industry Revenue (Million) Forecast, by Application 2020 & 2033
- Table 48: Russia Industrial Centrifuge Industry Volume (K Unit) Forecast, by Application 2020 & 2033
- Table 49: NORDIC Industrial Centrifuge Industry Revenue (Million) Forecast, by Application 2020 & 2033
- Table 50: NORDIC Industrial Centrifuge Industry Volume (K Unit) Forecast, by Application 2020 & 2033
- Table 51: Turkey Industrial Centrifuge Industry Revenue (Million) Forecast, by Application 2020 & 2033
- Table 52: Turkey Industrial Centrifuge Industry Volume (K Unit) Forecast, by Application 2020 & 2033
- Table 53: Rest of Europe Industrial Centrifuge Industry Revenue (Million) Forecast, by Application 2020 & 2033
- Table 54: Rest of Europe Industrial Centrifuge Industry Volume (K Unit) Forecast, by Application 2020 & 2033
- Table 55: Global Industrial Centrifuge Industry Revenue Million Forecast, by Type 2020 & 2033
- Table 56: Global Industrial Centrifuge Industry Volume K Unit Forecast, by Type 2020 & 2033
- Table 57: Global Industrial Centrifuge Industry Revenue Million Forecast, by Design 2020 & 2033
- Table 58: Global Industrial Centrifuge Industry Volume K Unit Forecast, by Design 2020 & 2033
- Table 59: Global Industrial Centrifuge Industry Revenue Million Forecast, by Operation Mode 2020 & 2033
- Table 60: Global Industrial Centrifuge Industry Volume K Unit Forecast, by Operation Mode 2020 & 2033
- Table 61: Global Industrial Centrifuge Industry Revenue Million Forecast, by Industry 2020 & 2033
- Table 62: Global Industrial Centrifuge Industry Volume K Unit Forecast, by Industry 2020 & 2033
- Table 63: Global Industrial Centrifuge Industry Revenue Million Forecast, by Country 2020 & 2033
- Table 64: Global Industrial Centrifuge Industry Volume K Unit Forecast, by Country 2020 & 2033
- Table 65: China Industrial Centrifuge Industry Revenue (Million) Forecast, by Application 2020 & 2033
- Table 66: China Industrial Centrifuge Industry Volume (K Unit) Forecast, by Application 2020 & 2033
- Table 67: India Industrial Centrifuge Industry Revenue (Million) Forecast, by Application 2020 & 2033
- Table 68: India Industrial Centrifuge Industry Volume (K Unit) Forecast, by Application 2020 & 2033
- Table 69: Japan Industrial Centrifuge Industry Revenue (Million) Forecast, by Application 2020 & 2033
- Table 70: Japan Industrial Centrifuge Industry Volume (K Unit) Forecast, by Application 2020 & 2033
- Table 71: Australia Industrial Centrifuge Industry Revenue (Million) Forecast, by Application 2020 & 2033
- Table 72: Australia Industrial Centrifuge Industry Volume (K Unit) Forecast, by Application 2020 & 2033
- Table 73: South Korea Industrial Centrifuge Industry Revenue (Million) Forecast, by Application 2020 & 2033
- Table 74: South Korea Industrial Centrifuge Industry Volume (K Unit) Forecast, by Application 2020 & 2033
- Table 75: Malaysia Industrial Centrifuge Industry Revenue (Million) Forecast, by Application 2020 & 2033
- Table 76: Malaysia Industrial Centrifuge Industry Volume (K Unit) Forecast, by Application 2020 & 2033
- Table 77: Thailand Industrial Centrifuge Industry Revenue (Million) Forecast, by Application 2020 & 2033
- Table 78: Thailand Industrial Centrifuge Industry Volume (K Unit) Forecast, by Application 2020 & 2033
- Table 79: Indonesia Industrial Centrifuge Industry Revenue (Million) Forecast, by Application 2020 & 2033
- Table 80: Indonesia Industrial Centrifuge Industry Volume (K Unit) Forecast, by Application 2020 & 2033
- Table 81: Vietnam Industrial Centrifuge Industry Revenue (Million) Forecast, by Application 2020 & 2033
- Table 82: Vietnam Industrial Centrifuge Industry Volume (K Unit) Forecast, by Application 2020 & 2033
- Table 83: Rest of the Asia Pacific Industrial Centrifuge Industry Revenue (Million) Forecast, by Application 2020 & 2033
- Table 84: Rest of the Asia Pacific Industrial Centrifuge Industry Volume (K Unit) Forecast, by Application 2020 & 2033
- Table 85: Global Industrial Centrifuge Industry Revenue Million Forecast, by Type 2020 & 2033
- Table 86: Global Industrial Centrifuge Industry Volume K Unit Forecast, by Type 2020 & 2033
- Table 87: Global Industrial Centrifuge Industry Revenue Million Forecast, by Design 2020 & 2033
- Table 88: Global Industrial Centrifuge Industry Volume K Unit Forecast, by Design 2020 & 2033
- Table 89: Global Industrial Centrifuge Industry Revenue Million Forecast, by Operation Mode 2020 & 2033
- Table 90: Global Industrial Centrifuge Industry Volume K Unit Forecast, by Operation Mode 2020 & 2033
- Table 91: Global Industrial Centrifuge Industry Revenue Million Forecast, by Industry 2020 & 2033
- Table 92: Global Industrial Centrifuge Industry Volume K Unit Forecast, by Industry 2020 & 2033
- Table 93: Global Industrial Centrifuge Industry Revenue Million Forecast, by Country 2020 & 2033
- Table 94: Global Industrial Centrifuge Industry Volume K Unit Forecast, by Country 2020 & 2033
- Table 95: Brazil Industrial Centrifuge Industry Revenue (Million) Forecast, by Application 2020 & 2033
- Table 96: Brazil Industrial Centrifuge Industry Volume (K Unit) Forecast, by Application 2020 & 2033
- Table 97: Argentina Industrial Centrifuge Industry Revenue (Million) Forecast, by Application 2020 & 2033
- Table 98: Argentina Industrial Centrifuge Industry Volume (K Unit) Forecast, by Application 2020 & 2033
- Table 99: Chile Industrial Centrifuge Industry Revenue (Million) Forecast, by Application 2020 & 2033
- Table 100: Chile Industrial Centrifuge Industry Volume (K Unit) Forecast, by Application 2020 & 2033
- Table 101: Colombia Industrial Centrifuge Industry Revenue (Million) Forecast, by Application 2020 & 2033
- Table 102: Colombia Industrial Centrifuge Industry Volume (K Unit) Forecast, by Application 2020 & 2033
- Table 103: Rest of South America Industrial Centrifuge Industry Revenue (Million) Forecast, by Application 2020 & 2033
- Table 104: Rest of South America Industrial Centrifuge Industry Volume (K Unit) Forecast, by Application 2020 & 2033
- Table 105: Global Industrial Centrifuge Industry Revenue Million Forecast, by Type 2020 & 2033
- Table 106: Global Industrial Centrifuge Industry Volume K Unit Forecast, by Type 2020 & 2033
- Table 107: Global Industrial Centrifuge Industry Revenue Million Forecast, by Design 2020 & 2033
- Table 108: Global Industrial Centrifuge Industry Volume K Unit Forecast, by Design 2020 & 2033
- Table 109: Global Industrial Centrifuge Industry Revenue Million Forecast, by Operation Mode 2020 & 2033
- Table 110: Global Industrial Centrifuge Industry Volume K Unit Forecast, by Operation Mode 2020 & 2033
- Table 111: Global Industrial Centrifuge Industry Revenue Million Forecast, by Industry 2020 & 2033
- Table 112: Global Industrial Centrifuge Industry Volume K Unit Forecast, by Industry 2020 & 2033
- Table 113: Global Industrial Centrifuge Industry Revenue Million Forecast, by Country 2020 & 2033
- Table 114: Global Industrial Centrifuge Industry Volume K Unit Forecast, by Country 2020 & 2033
- Table 115: United Arab Emirates Industrial Centrifuge Industry Revenue (Million) Forecast, by Application 2020 & 2033
- Table 116: United Arab Emirates Industrial Centrifuge Industry Volume (K Unit) Forecast, by Application 2020 & 2033
- Table 117: Saudi Arabia Industrial Centrifuge Industry Revenue (Million) Forecast, by Application 2020 & 2033
- Table 118: Saudi Arabia Industrial Centrifuge Industry Volume (K Unit) Forecast, by Application 2020 & 2033
- Table 119: Qatar Industrial Centrifuge Industry Revenue (Million) Forecast, by Application 2020 & 2033
- Table 120: Qatar Industrial Centrifuge Industry Volume (K Unit) Forecast, by Application 2020 & 2033
- Table 121: South Africa Industrial Centrifuge Industry Revenue (Million) Forecast, by Application 2020 & 2033
- Table 122: South Africa Industrial Centrifuge Industry Volume (K Unit) Forecast, by Application 2020 & 2033
- Table 123: Nigeria Industrial Centrifuge Industry Revenue (Million) Forecast, by Application 2020 & 2033
- Table 124: Nigeria Industrial Centrifuge Industry Volume (K Unit) Forecast, by Application 2020 & 2033
- Table 125: Egypt Industrial Centrifuge Industry Revenue (Million) Forecast, by Application 2020 & 2033
- Table 126: Egypt Industrial Centrifuge Industry Volume (K Unit) Forecast, by Application 2020 & 2033
- Table 127: Rest of the Middle East and Africa Industrial Centrifuge Industry Revenue (Million) Forecast, by Application 2020 & 2033
- Table 128: Rest of the Middle East and Africa Industrial Centrifuge Industry Volume (K Unit) Forecast, by Application 2020 & 2033
Frequently Asked Questions
1. What is the projected Compound Annual Growth Rate (CAGR) of the Industrial Centrifuge Industry?
The projected CAGR is approximately 4.51%.
2. Which companies are prominent players in the Industrial Centrifuge Industry?
Key companies in the market include Multotec Pty Ltd, HAUS Centrifuge Technologies, Thomas Broadbent & Sons Ltd, Flottweg SE, MSE Hiller, GEA Group AG, Ferrum Ltd, Andritz AG, Alfa Laval AB.
3. What are the main segments of the Industrial Centrifuge Industry?
The market segments include Type, Design, Operation Mode, Industry.
4. Can you provide details about the market size?
The market size is estimated to be USD 8.47 Million as of 2022.
5. What are some drivers contributing to market growth?
4.; Increasing Demand from Various End-user Industries.
6. What are the notable trends driving market growth?
The Chemical Industry to Dominate the Market.
7. Are there any restraints impacting market growth?
4.; Higher Capital and Operational Cost.
8. Can you provide examples of recent developments in the market?
January 2024: GEA unveiled X Control, a fresh centrifuge control system. The introduction of X Control sets the stage for incorporating Artificial Intelligence (AI), promising quicker and simpler data collection and analysis and self-optimization of the entire system in the future. The heightened computing capabilities will also enhance integration with SCADA (Supervisory Control and Data Acquisition) systems.
9. What pricing options are available for accessing the report?
Pricing options include single-user, multi-user, and enterprise licenses priced at USD 4750, USD 5250, and USD 8750 respectively.
10. Is the market size provided in terms of value or volume?
The market size is provided in terms of value, measured in Million and volume, measured in K Unit.
11. Are there any specific market keywords associated with the report?
Yes, the market keyword associated with the report is "Industrial Centrifuge Industry," which aids in identifying and referencing the specific market segment covered.
12. How do I determine which pricing option suits my needs best?
The pricing options vary based on user requirements and access needs. Individual users may opt for single-user licenses, while businesses requiring broader access may choose multi-user or enterprise licenses for cost-effective access to the report.
13. Are there any additional resources or data provided in the Industrial Centrifuge Industry report?
While the report offers comprehensive insights, it's advisable to review the specific contents or supplementary materials provided to ascertain if additional resources or data are available.
14. How can I stay updated on further developments or reports in the Industrial Centrifuge Industry?
To stay informed about further developments, trends, and reports in the Industrial Centrifuge Industry, consider subscribing to industry newsletters, following relevant companies and organizations, or regularly checking reputable industry news sources and publications.
Methodology
Step 1 - Identification of Relevant Samples Size from Population Database


Step 2 - Approaches for Defining Global Market Size (Value, Volume* & Price*)

Note*: In applicable scenarios
Step 3 - Data Sources
Primary Research
- Web Analytics
- Survey Reports
- Research Institute
- Latest Research Reports
- Opinion Leaders
Secondary Research
- Annual Reports
- White Paper
- Latest Press Release
- Industry Association
- Paid Database
- Investor Presentations

Step 4 - Data Triangulation
Involves using different sources of information in order to increase the validity of a study
These sources are likely to be stakeholders in a program - participants, other researchers, program staff, other community members, and so on.
Then we put all data in single framework & apply various statistical tools to find out the dynamic on the market.
During the analysis stage, feedback from the stakeholder groups would be compared to determine areas of agreement as well as areas of divergence